Logging DNS Requests - client IP, requested FQDN, and response addresses
-
I'm looking for help on how to monitor not just the requested DNS FQDN and returned address lists, but also the IP of the client who requested them.
Can't seem to isolate the client-level detail from resolver.log.
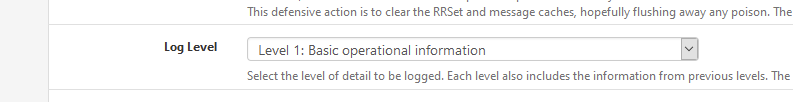
I've tried setting unbound resolver's log level in advanced settings from Level 1: Basic operational information to either
Level 3: Query Level information
or
Level 5: Client Identification for cache misses
but can't seem to parse out the detail I'd expect.Ideally, I'd like to get the following fields out via telegraf to an InfluxDB data store for reporting in Grafana:
<datetime>,<clientIP>,<requestedFQDN>,<responseIPsArray>,<RTT>Turning on Level 5 debugging for unbound seems a VERY heavy-handed way to get this detail (if the above fields can actually be parsed from that properly).
Didn't see any obvious detail on the actual client making the request.
e.g.Jul 13 14:36:37 unbound 18436:0 debug: iter_handle processing q with state QUERY RESPONSE STATE Jul 13 14:36:37 unbound 18436:0 info: incoming scrubbed packet: ;; ->>HEADER<<- opcode: QUERY, rcode: NOERROR, id: 0 ;; flags: qr aa ; QUERY: 1, ANSWER: 1, AUTHORITY: 0, ADDITIONAL: 0 ;; QUESTION SECTION: ns2.megaservers-dns.de. IN A ;; ANSWER SECTION: ns2.megaservers-dns.de. 86400 IN A 185.107.192.199 ;; AUTHORITY SECTION: ;; ADDITIONAL SECTION: ;; MSG SIZE rcvd: 56What's the recommended way to get this info?
pfSense 2.4.5p1,
Thanks,
-Fabrizio -
Did you enable query logging in the DNS resolver advanced options?
server: log-queries: yes -
@jimp said in Logging DNS Requests - client IP, requested FQDN, and response addresses:
server:
log-queries: yesNot sure where this is documented but I have been looking for this option for a few years now. This works. It is however not under advanced options -tab, rather under general settings -tab and custom options.
Security Consultant at Mint Security Ltd - www.mintsecurity.fi
-
@tsmalmbe said in Logging DNS Requests - client IP, requested FQDN, and response addresses:
Not sure where this is documented but I have been looking for this option for a few years now.
The unbound conf manual.
See here : https://nlnetlabs.nl/documentation/unbound/unbound.conf/ and fast forward to "log-queries".
The option isn't accessible with the GUI? so use the custom option box, where you can set what you want as long as the syntax is ok.As said in the documentation : this will probably a create lot of log info that over writes itself very fast -> make the logs files bigger or huge.
-
Thanks everyone.
current unbound logging volume makes getting this detail via log analysis a no-go solution, at least not without a scripted cron-based solution that would parse and store the interested metrics and then purge the log. May look at something like this at some point, but no time for this development work now.
It would really be nice to be able to see the following detail along with the DNS Cache Speed metrics:
-
count of distinct clients that have hits for each cache entry
-
hit counts over time per client per cache entry along with the initial FQDN requested per client that correlates to the cache record.
-
-
Sorry for reopening this old thread but did not see a point in creating a new one.
Currently I am using pfblockNG and I can not see responseIPs unless on log level 5.
I added the following to the general settings -tab and custom options and applied and even rebooted pfsense but still no luck.
server:
log-queries: yeseven with this option added to the options i do not see any difference the response IPs is still missing unless i have the log level set to 5 which generates a lot of noise.

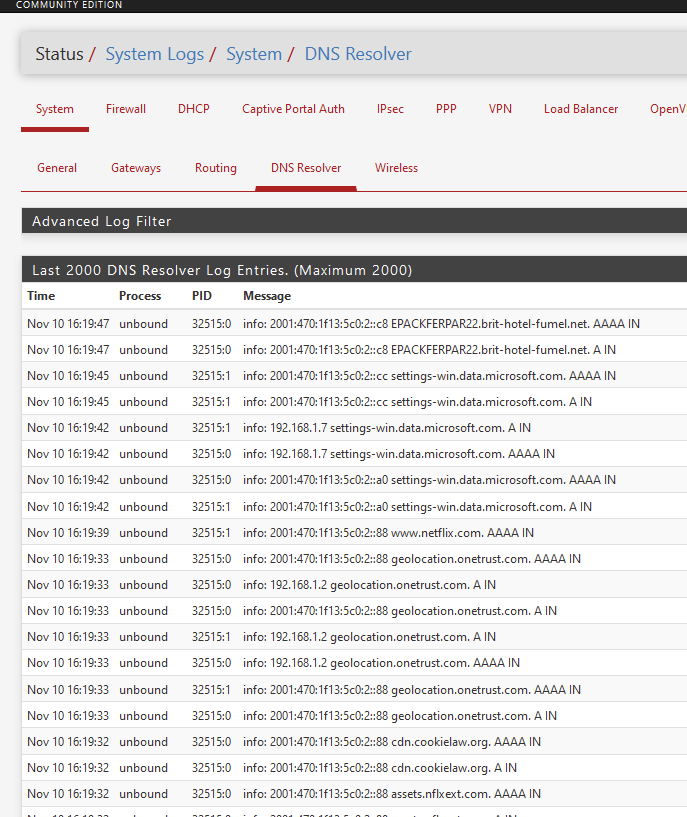
This is what is logged when on log level 5 and having the log-queries option enabled.
cat /var/log/resolver.log | grep hello.eu
Nov 10 13:47:22 pfSense unbound: [8691:0] info: 192.168.0.15 hello.eu. A IN
Nov 10 13:47:22 pfSense unbound: [8691:0] info: validator operate: query hello.eu. A IN
Nov 10 13:47:22 pfSense unbound: [8691:0] info: resolving hello.eu. A IN
Nov 10 13:47:22 pfSense unbound: [8691:0] info: processQueryTargets: hello.eu. A IN
Nov 10 13:47:22 pfSense unbound: [8691:0] info: sending query: hello.eu. A IN
Nov 10 13:47:22 pfSense unbound: [8691:0] info: 0RDd mod1 rep hello.eu. A IN
Nov 10 13:47:22 pfSense unbound: [8691:0] info: iterator operate: query hello.eu. A IN
Nov 10 13:47:22 pfSense unbound: [8691:0] info: response for hello.eu. A IN
Nov 10 13:47:22 pfSense unbound: [8691:0] info: incoming scrubbed packet: ;; ->>HEADER<<- opcode: QUERY, rcode: NOERROR, id: 0 ;; flags: qr rd ra ; QUERY: 1, ANSWER: 2, AUTHORITY: 0, ADDITIONAL: 0  ;; QUESTION SECTION: hello.eu.	IN	A  ;; ANSWER SECTION: hello.eu.	14399	IN	A	165.160.15.20 hello.eu.	14399	IN	A	165.160.13.20  ;; AUTHORITY SECTION:  ;; ADDITIONAL SECTION: ;; MSG SIZE  rcvd: 58
Nov 10 13:47:22 pfSense unbound: [8691:0] info: finishing processing for hello.eu. A IN
Nov 10 13:47:22 pfSense unbound: [8691:0] info: validator operate: query hello.eu. A IN
Nov 10 13:47:22 pfSense unbound: [8691:0] info: no signer, using hello.eu. TYPE0 CLASS0
Nov 10 13:47:22 pfSense unbound: [8691:0] info: validator: FindKey hello.eu. A IN
Nov 10 13:47:22 pfSense unbound: [8691:0] info: target keyname hello.eu. DNSKEY IN
Nov 10 13:47:22 pfSense unbound: [8691:0] info: next keyname hello.eu. DNSKEY IN
Nov 10 13:47:22 pfSense unbound: [8691:0] info: generate request hello.eu. DS IN
Nov 10 13:47:22 pfSense unbound: [8691:0] info: validator operate: query hello.eu. DS IN
Nov 10 13:47:22 pfSense unbound: [8691:0] info: resolving hello.eu. DS IN
Nov 10 13:47:22 pfSense unbound: [8691:0] info: processQueryTargets: hello.eu. DS IN
Nov 10 13:47:22 pfSense unbound: [8691:0] info: sending query: hello.eu. DS IN
Nov 10 13:47:22 pfSense unbound: [8691:0] info: 0vRDCD mod1  hello.eu. DS IN
Nov 10 13:47:22 pfSense unbound: [8691:0] info: 1RDdc mod0 rep hello.eu. A IN
Nov 10 13:47:23 pfSense unbound: [8691:0] info: 0vRDCD mod1  hello.eu. DS IN
Nov 10 13:47:23 pfSense unbound: [8691:0] info: 1RDdc mod0 rep hello.eu. A IN
Nov 10 13:47:23 pfSense unbound: [8691:0] debug: try edns1xx0 <hello.eu.> 8.8.8.8#53
Nov 10 13:47:23 pfSense unbound: [8691:0] info: iterator operate: query hello.eu. DS IN
Nov 10 13:47:23 pfSense unbound: [8691:0] info: response for hello.eu. DS IN
Nov 10 13:47:23 pfSense unbound: [8691:0] info: incoming scrubbed packet: ;; ->>HEADER<<- opcode: QUERY, rcode: NOERROR, id: 0 ;; flags: qr rd ra ; QUERY: 1, ANSWER: 0, AUTHORITY: 6, ADDITIONAL: 0  ;; QUESTION SECTION: hello.eu.	IN	DS  ;; ANSWER SECTION:  ;; AUTHORITY SECTION: QBQ65Q6097OCPPR0EUCQNSC1FHE073UA.eu.	599	IN	NSEC3	1 1 1 5CA1AB1E qbq6ocgmt2jnij4jnf2ccrfi4ce4nue0 NS SOA RRSIG DNSKEY NSEC3PARAM ;{flags: optout} QBQ65Q6097OCPPR0EUCQNSC1FHE073UA.eu.	599	IN	RRSIG	NSEC3 8 2 600 20201115214452 20201108212822 49485 eu. I1RJ2Xid7b+8MvYFG/wlQW2ITAa3rKlieEoi327l38qQ6z5WjS1iybu5RqivBn7N3BjgYwpkZLfdh1W7LtcHRVhqJS3/dzuFoZGiyDb6ZSzqIDxb2Y6rCEIaA6MplvbbTOllVCaeiyz4QzWQD+UM/d+GmN6xmqCKhSc3YBZp+30= ;{id = 49485} eu.	599	IN	SOA	nl.dns.eu. tech.eurid.eu. 1066667209 3600 1800 3600000 600 eu.	599	IN	RRSIG	SOA 8 1 86400 20201117134714 20201110124714 49485 eu. p0OcPTTNDXO2YQOQBF0ataST4eGm5dFs9Kgwv+TWYZRn485ouk5vdTpjYsGYAFQIwIUpf10NbpNXciAoTd4pxHDZk78Nq37HzwqDFt+AL1c+1ZA9kvNnQKhlqNPyFmaEJEB6CQ6mVSPeSvr8cuj4xvlBfw4nO2y294Px4XyxJyU= ;{id = 49485} O12A97G7C5N1F6FND5CSAN376JRJ0TUB.eu.	599	IN	NSEC3	1 1 1 5CA1AB1E o12fn126piloqap30lgch1fv422tjsic NS DS RRSIG ;{flags: optout} O12A97G7C5N1F6FND5CSAN376JRJ0TUB.eu.	599	IN	RRSIG	NSEC3 8 2 600 20201117110740 20201110105559 49485 eu. QdN9pGrYYN0mW2sqvV7CMuQLhLHku3Hd+Sh1fmv8KwyiXUQbyOFyrsSkYT4AVWJq2c98WAHMnJO9pGCaVxIuvSbXeeEoOSyCff+1gBiRaC4NszNMYULlcYgZYXvQ6f/6u6nIcz2HK1cRnh1jjI28C//jqE3GLZESohvWC4bqnF0= ;{id = 49485}  ;; ADDITIONAL SECTION: ;; MSG SIZE  rcvd: 733
Nov 10 13:47:23 pfSense unbound: [8691:0] info: finishing processing for hello.eu. DS IN
Nov 10 13:47:23 pfSense unbound: [8691:0] info: validator operate: query hello.eu. DS IN
Nov 10 13:47:23 pfSense unbound: [8691:0] info: validator: inform_super, sub is hello.eu. DS IN
Nov 10 13:47:23 pfSense unbound: [8691:0] info: super is hello.eu. A IN
Nov 10 13:47:23 pfSense unbound: [8691:0] info: validator operate: query hello.eu. A IN
I was hoping to get the logs in a simple format like dnsmasq
Nov 10 13:47:23 pfSense dnsmasq[1248]: query[A] mazedecrypt.top from 77.77.77.77
Nov 10 13:47:23 pfSense dnsmasq[1248]: forwarded mazedecrypt.top to 8.8.8.8
Nov 10 13:47:23 pfSense dnsmasq[1248]: reply mazedecrypt.top is 91.218.114.38
currently running version:
2.4.5-RELEASE-p1 (amd64)
built on Tue Jun 02 17:51:17 EDT 2020Any help would be appreciated.
-
Hello!
You can run a script to continually pluck out the bits you are interested in and put them into their own logfile with something like :
clog -f /var/log/resolver.log | grep --line-buffered "info: resolving" | tee -a /var/log/myqueries.logDaemonizing this is another exercise.
This might get easier with the logging changes in 2.5John
-
log-queries ?
With this : https://nlnetlabs.nl/documentation/unbound/unbound.conf/
I set this :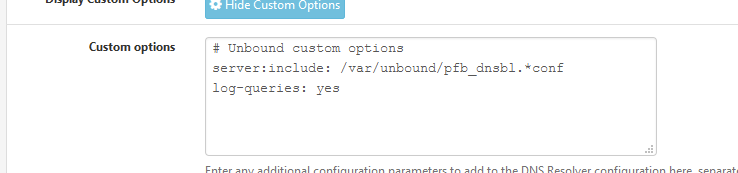
I saw this :
I did not change this :
edit :
The format is how the unbound guys created it - unbound is created and maintained here : https://nlnetlabs.nl/ - pfSense is 'just' importing the FreeBSD port.
Changing the log format means : changing the source and re compile.But ..... I didn't read the doc (see above) - maybe there is an command option ?
-
@serbus Thanks for the suggestion but not something we would want to go down the route of unless we had no other options.
@Gertjan
Thanks for confirming.It looks like some of the output I was hoping to be in the logs are missing such as the resolved IPs but i suppose it does not make a difference as the connections will be logged.
It will make life a little bit more awkward to investiagate incidents on our SIEM but as the SIEM also does resolution on domains and addresses its not too much trouble.
-
-
@vijay7 said in Logging DNS Requests - client IP, requested FQDN, and response addresses:
Hi i dont have dnsbl*.conf in my pfsense
Months ago, this file was put in the Resolver > Custon option box by pfBlokcerNG.
These days, its 2021 now, and several pfBlockerNG later, this file isn't needed anymore.
That is, if you're using 'Python' mode.
With the classic mode, I still have :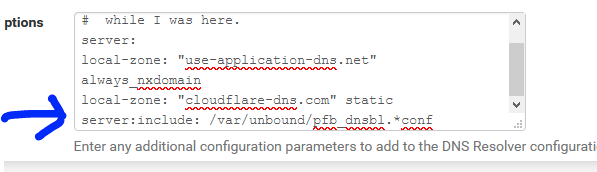
The pfblokcerNG 'force update' shows this also :
..... Removing DNSBL Unbound python integration settings Adding DNSBL Unbound mode (Resolver adv. setting) DNS Resolver ( enabled ) unbound.conf modifications: Removed DNSBL Unbound Python mode Removed DNSBL Unbound Python mode script Added DNSBL Unbound mode ....@vijay7 said in Logging DNS Requests - client IP, requested FQDN, and response addresses:
is there any way, to get the client IP in DNS query logs.
@BBcan177, author of pfBlokcerNG, explained in another thread that this is a shortcoming of the current unbound version that pfSense 2.4.5-p1 uses.
The new unbound version, available for the upcoming 2.5.0 uses a more recent unbound, which does show the IP's.
It's not possible to upgrade the unbound version using pfSense 2.4.5-p12@vijay7 said in Logging DNS Requests - client IP, requested FQDN, and response addresses:
@jimp Need your help here.
He will tell you that 2.5.0 is ready when .... it's ready.
-
@fabrizior That feature would be awesome
Be able to see accessed sites per interface, summarized some how
Have you found a way to do that?
Maybe I will give a go to elasticsearch
Have a good time -
@foreigner
I have not found a way yet, though I have not upgraded yet either. After upgrade, eventually, will probably ingest the dns logs to my influxdb via telegraf with a log parser input plugin since I already have telegraf gathering metrics with influxdb and a grafana dashboard. logstash and ES might be more efficient, but that seems redundant for me right now. -
I just tested pfelk: https://github.com/pfelk/pfelk
and it displays the requested domains nicelyI took me around a couple of hours to see the results
At least the outbound and firewall dashboards are usefull for me, although ELK consumes a lot of memory :S
It might help if one is in a hurry...
-
@foreigner cool. nice find. You’re right, that seems rather heavy. I might have a look at the log parsers and see if I can rev. engineer some of them into a telegraf log parser format and into my existing influxdb. And replicate the kibana dashboards in grafana… when/if I can find time.
Though… not being on 2.5 yet, no resolver request fqdn/IPs in the dns log to grab anyway if I understand all this correctly.