Suboptimal routing troughput, debugging options ?
-
Any services that uses promiscious mode to become privy to traffic kills throughput on the SG-1100.
So any monitoring packages is no-go (Darkstat, NtopNG and so on). They absolutely kills throughput. -
That's it nothing else is running, so as far as I can tell nothing in promiscuous mode.
And yet still from device on LAN ( with 1G link )$ speedtest | grep Mbit Download: 4.89 Mbit/s Upload: 10.53 Mbit/swhile from the router itself:
$ speedtest | grep Mbit
Download: 301.41 Mbit/s
Upload: 42.64 Mbit/s
If the max throughput this device can do is only this, then fine, I will just get an upgrade, and get an other one, but as far as I understand it should do much more then this, just need to understand why it doesn't.
So what kind of debug options I still have left to find out where is the bottleneck ?
- Link speed

- OPT vs LAN
- CPU time not spent on other BS on client
- CPU time not spent on other BS on router
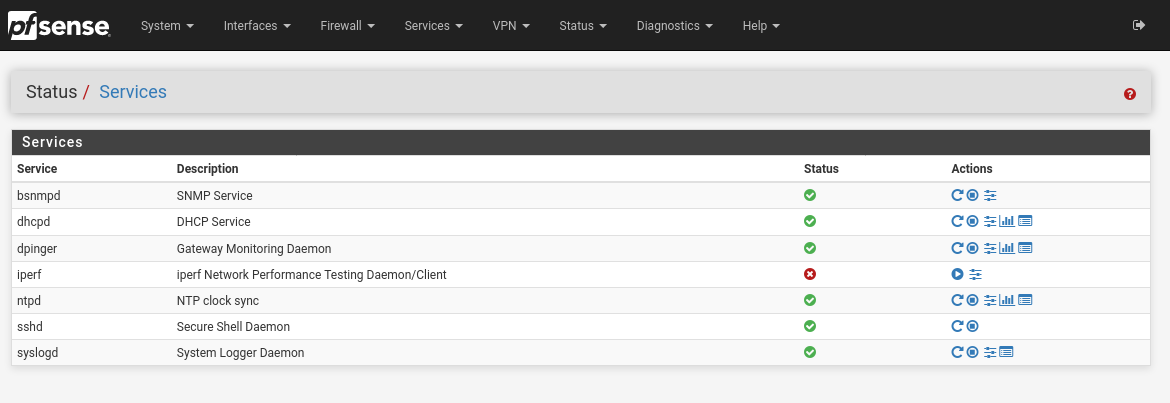
- All extra services on the router disabled
- Traffic shaping is not configured
- Firewall rules logging turned off
- Something I missed

- Link speed
-
Ahh, with those kinds of speed reductions it's not a promiscious mode package that's the culprit.
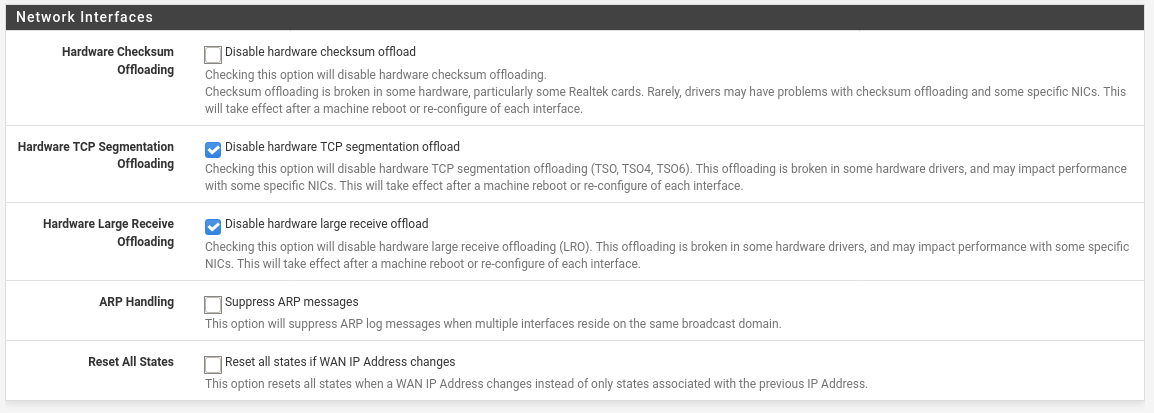
My last option is to make sure the hardware offload settings are correct for the SG-1100.
You can find them in SYSTEM -> Advanced -> Networking: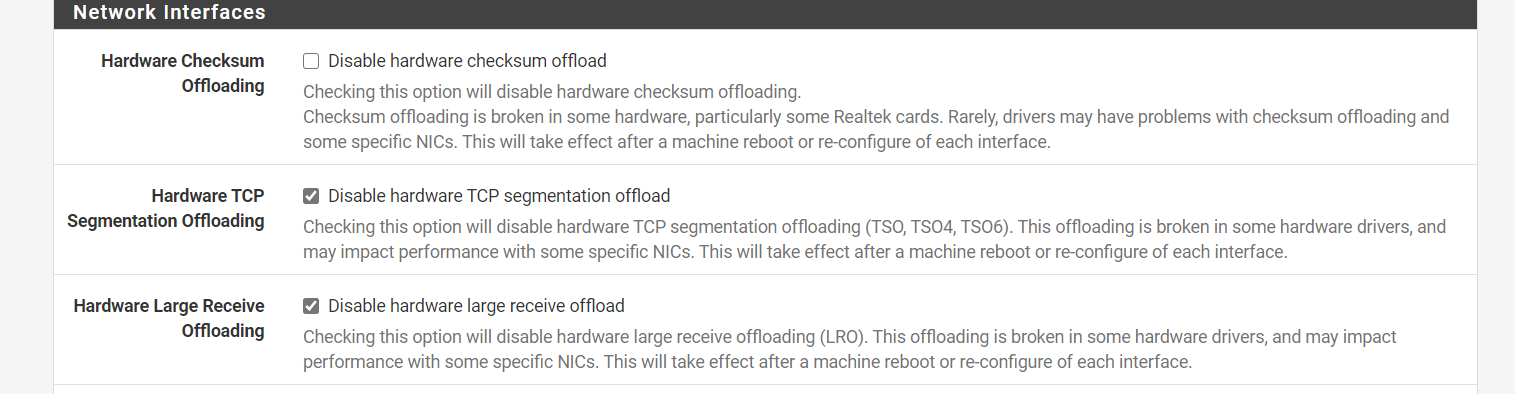
-
Or if you prefer:PS > $Path = "config-router-20201005161053.xml" PS > $XPath = "/pfsense/system" PS > Select-Xml -Path $Path -XPath $Xpath | Select-Object -ExpandProperty Node | grep disable disablenatreflection : yes disablesegmentationoffloading : disablelargereceiveoffloading :So can add to the list:
- Offloading settings
- Offloading settings
-
Do you have multiple public IPs there? If it were somehow NATing internal clients to a different external IP there might be something applied to them differently.
The level if throttling still looks like something low level. Or a fixed limit somewhere. Hmm.
Steve
-
ifconfig | grep inet | grep -v inet6
        inet 127.0.0.1 netmask 0xff000000
        inet 289.320.21.968 netmask 0xffffe000 broadcast 289.320.21.255
        inet 192.168.0.1 netmask 0xffff0000 broadcast 192.168.255.255
        inet 10.0.0.1 netmask 0xffffff00 broadcast 10.0.0.255
( note I edited out my public IP with some dummy one )
same from the web interface
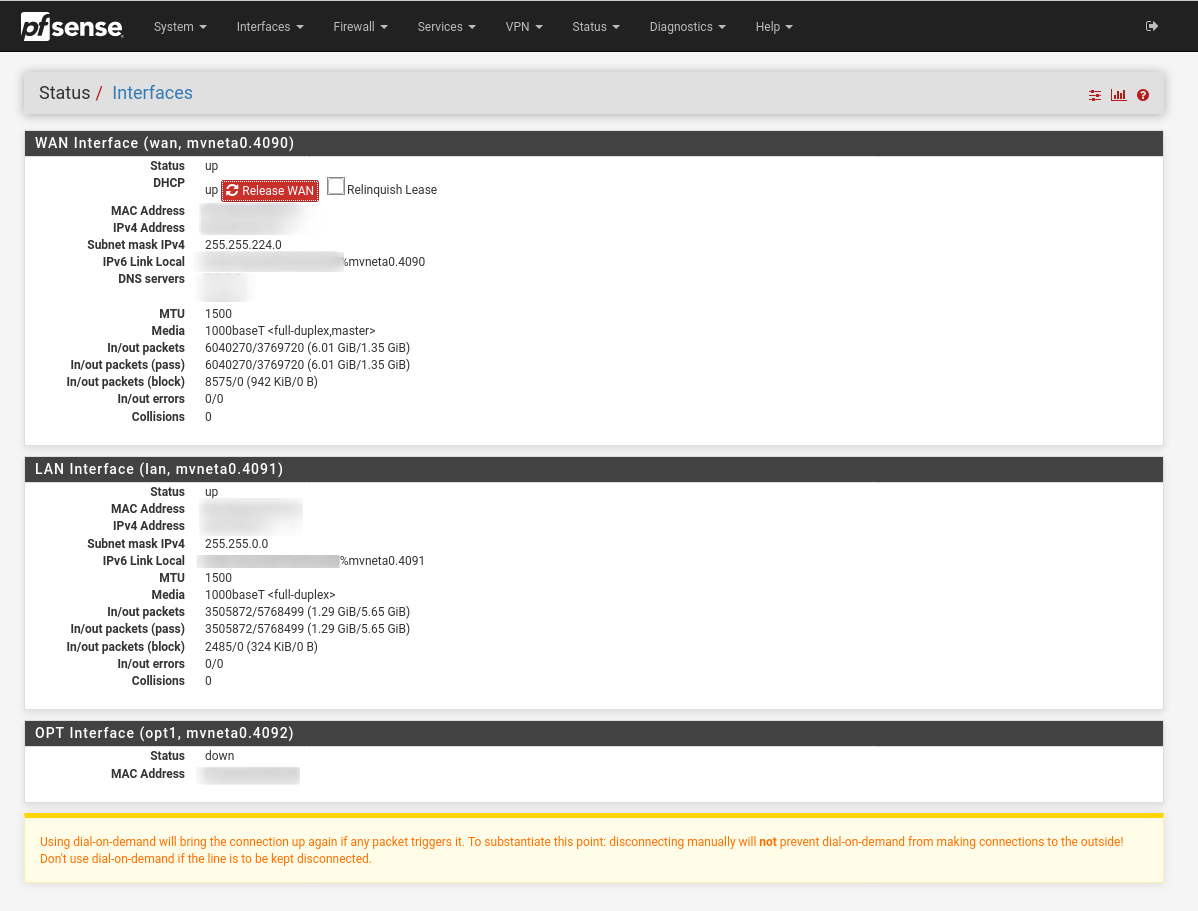
So as far as I know I don't have extra public IP.
Happy to share all relevant parts of my config if we know what we are searching for, but sanitizing the whole config isn't trivial, and obviously it has a lot of sensitive data as well in it.
-
You don't have a VPN configured or anything that might be tunneling that traffic?
If you search 'what is my IP' or similar on a LAN client it reports the expected public IP?
Steve
-
$ ifconfig mvneta0.4090 | grep "inet " | cut -f2 -d" " > /tmp/wan-ip.txt
$ curl -s https://api.ipify.org > /tmp/external-seen.txt
$ diff /tmp/wan-ip.txt /tmp/external-seen.txt
$
Same IP on the interface, seen from outsite, on the router and the client, and it's not even a CGN address it's good old fashion class A public IP , confirmed it with the AS number as well.
-
Can we see the top -aSH output to review?
Ah you able to test it at a different location? Or just put it behind some other router (doublre NAT) as a test?
Hard to imagine anything that could possibly be doing this....
Steve
-
Snapshoot of TOP ( sanitized )
last pid: 55189;  load averages:  0.18,  0.23,  0.23                                                                                                                                       up 0+08:05:13  16:33:19
127 processes: 3 running, 105 sleeping, 19 waiting
CPU:  0.4% user,  0.0% nice,  0.8% system,  0.0% interrupt, 98.8% idle
Mem: 20M Active, 140M Inact, 143M Wired, 26M Buf, 663M Free
Swap:

  PID USERNAME   PRI NICE   SIZE    RES STATE   C   TIME    WCPU COMMAND
   11 root       155 ki31     0K    32K RUN     0 468:16  99.68% [idle{idle: cpu0}]
   11 root       155 ki31     0K    32K CPU1    1 470:32  98.19% [idle{idle: cpu1}]
55039 root        20    0  8392K  3868K CPU0    0   0:00   0.36% top -aSH
   12 root       -60    -     0K   304K WAIT    0   0:39   0.14% [intr{swi4: clock (0)}]
   12 root       -92    -     0K   304K WAIT    0   4:55   0.11% [intr{gic0,s42: mvneta0}]
    6 root       -16    -     0K    16K e6000s  1   0:12   0.04% [e6000sw tick kproc]
60037 root        20    0 13896K  6580K select  0   0:01   0.04% sshd: root@pts/0 (sshd)
 8573 root        20    0  6592K   888K select  0   0:09   0.02% /usr/sbin/syslogd -s -c -c -l /var/dhcpd/var/run/log -P /var/run/syslog.pid -f /etc/syslog.conf
    8 root       -16    -     0K    16K pftm    0   0:11   0.02% [pf purge]
41968 root        20    0  7104K   772K nanslp  0   0:05   0.01% /usr/local/bin/dpinger -S -r 0 -i WAN_DHCP -B 289.320.21.968 -p /var/run/dpinger_WAN_DHCP~289.320.21.968~84.241.64.1.pid -u /var/
28762 root        20    0  6824K   876K bpf     1   0:05   0.01% /usr/local/sbin/filterlog -i pflog0 -p /var/run/filterlog.pid
58532 dhcpd       20    0 15348K  1472K select  0   0:05   0.01% /usr/local/sbin/dhcpd -user dhcpd -group _dhcp -chroot /var/dhcpd -cf /etc/dhcpd.conf -pf /var/run/dhcpd.pid mvneta0.4091
52480 root        20    0 12292K  1820K select  1   0:04   0.01% /usr/local/sbin/ntpd -g -c /var/etc/ntpd.conf -p /var/run/ntpd.pid{ntpd}
10453 root        20    0  6260K   380K nanslp  0   0:00   0.01% minicron: helper /usr/local/bin/ping_hosts.sh  (minicron)
75307 root        20    0 40476K  2716K select  0   0:25   0.01% /usr/sbin/bsnmpd -c /var/etc/snmpd.conf -p /var/run/snmpd.pid
    9 root       -16    -     0K    16K -       0   0:03   0.01% [rand_harvestq]
41968 root        20    0  7104K   772K sbwait  1   0:02   0.01% /usr/local/bin/dpinger -S -r 0 -i WAN_DHCP -B 289.320.21.968 -p /var/run/dpinger_WAN_DHCP~289.320.21.968~84.241.64.1.pid -u /var/
  361 root        20    0   100M  1384K kqread  0   0:02   0.00% php-fpm: master process (/usr/local/lib/php-fpm.conf) (php-fpm)
   28 root        20    -     0K    32K sdflus  1   0:01   0.00% [bufdaemon{/ worker}]
   24 root       -16    -     0K    48K psleep  1   0:01   0.00% [pagedaemon{dom0}]
41968 root        20    0  7104K   772K nanslp  0   0:01   0.00% /usr/local/bin/dpinger -S -r 0 -i WAN_DHCP -B 289.320.21.968 -p /var/run/dpinger_WAN_DHCP~289.320.21.968~84.241.64.1.pid -u /var/
   30 root        16    -     0K    16K syncer  0   0:02   0.00% [syncer]
   28 root       -16    -     0K    32K psleep  0   0:00   0.00% [bufdaemon{bufdaemon}]
   27 root       -16    -     0K    16K -       1   0:00   0.00% [bufspacedaemon]
   29 root       -16    -     0K    16K vlruwt  0   0:00   0.00% [vnlru]
    0 root       -16    -     0K   208K swapin  1   0:20   0.00% [kernel{swapper}]
  364 root        52    0   106M  6364K accept  0   0:12   0.00% php-fpm: pool nginx (php-fpm){php-fpm}
78177 root        52   20  7172K  2248K wait    1   0:09   0.00% /bin/sh /var/db/rrd/updaterrd.sh
   17 root       -16    -     0K    16K mmcsd   0   0:08   0.00% [mmcsd0: mmc/sd card]
51457 root        20    0 23292K  2028K kqread  1   0:06   0.00% nginx: worker process (nginx)
  363 root        20    0   100M  7104K accept  0   0:03   0.00% php-fpm: pool nginx (php-fpm)
72191 root        52    0   102M  4208K accept  0   0:03   0.00% php-fpm: pool nginx (php-fpm)
   14 root        -8    -     0K    48K -       1   0:02   0.00% [geom{g_up}]
   12 root       -80    -     0K   304K WAIT    1   0:01   0.00% [intr{gic0,s26:-ci_xenon1}]
   16 root       -16    -     0K    16K mx25jq  0   0:00   0.00% [task: mx25l flash]
   15 root       -68    -     0K   160K -       0   0:00   0.00% [usb{usbus1}]
   15 root       -68    -     0K   160K -       1   0:00   0.00% [usb{usbus0}]
69605 root        20    0  7452K  2904K pause   0   0:00   0.00% /bin/tcsh
52112 root        20    0  6696K   776K nanslp  0   0:00   0.00% /usr/sbin/cron -s
   14 root        -8    -     0K    48K -       1   0:00   0.00% [geom{g_event}]
    1 root        25    0  5012K   408K wait    0   0:00   0.00% [init]
37393 root        20    0  6488K  1608K nanslp  1   0:00   0.00% /usr/libexec/getty al.Pc ttyv0
41968 root        20    0  7104K   772K accept  0   0:00   0.00% /usr/local/bin/dpinger -S -r 0 -i WAN_DHCP -B 289.320.21.968 -p /var/run/dpinger_WAN_DHCP~289.320.21.968~84.241.64.1.pid -u /var/
   70 root        -8    -     0K    16K mdwait  1   0:00   0.00% [md0]
38181 root        20    0  6728K  1732K nanslp  1   0:00   0.00% /usr/local/libexec/sshg-blocker{sshg-blocker}
    0 root         8    -     0K   208K -       0   0:00   0.00% [kernel{thread taskq}]
26048 _dhcp       20    0  6616K   664K select  1   0:00   0.00% dhclient: mvneta0.4090 (dhclient)
37574 root        52    0  8044K  2264K wait    1   0:00   0.00% login [pam] (login)
  425 root        20    0  9132K   252K select  1   0:00   0.00% /sbin/devd -q -f /etc/pfSense-devd.conf
37858 root        28    0  7172K  2056K wait    0   0:00   0.00% /bin/sh /usr/local/sbin/sshguard -i /var/run/sshguard.pid
  403 root        40   20  7088K   900K kqread  1   0:00   0.00% /usr/local/sbin/check_reload_status
60309 root        52    0  7172K  2148K wait    0   0:00   0.00% -sh (sh)
39053 root        37    0  7172K  2096K wait    1   0:00   0.00% -sh (sh)
   12 root       -76    -     0K   304K WAIT    0   0:00   0.00% [intr{swi0: uart}]
44610 root        52    0  7172K  2192K ttyin   0   0:00   0.00% /bin/sh /etc/rc.initial
and yes I did try it with double NAT, the ISP gave me a cable modem, which was acting as a router as well, and got the same "performance" when it's only a modem aka, the public IP sits on my pfSense, and the same when it's a router, the public IP sits on the ISP's device, the only change in the config was, that I had to do is turn off the bogus network block on the WAN interface, as this way the WAN had the C class IP.
Also a
ps auxto show the whole list of running things ( sanitized )ps aux USER PID %CPU %MEM VSZ RSS TT STAT STARTED TIME COMMAND root 11 192.6 0.0 0 32 - RNL 08:28 968:12.73 [idle] root 0 0.0 0.0 0 208 - DLs 08:28 0:00.14 [kernel] root 1 0.0 0.0 5012 408 - ILs 08:28 0:00.08 /sbin/init -- root 2 0.0 0.0 0 16 - DL 08:28 0:00.00 [crypto] root 3 0.0 0.0 0 16 - DL 08:28 0:00.00 [crypto returns 0] root 4 0.0 0.0 0 16 - DL 08:28 0:00.00 [crypto returns 1] root 5 0.0 0.0 0 32 - DL 08:28 0:00.00 [cam] root 6 0.0 0.0 0 16 - DL 08:28 0:12.82 [e6000sw tick kproc] root 7 0.0 0.0 0 16 - DL 08:28 0:00.00 [sctp_iterator] root 8 0.0 0.0 0 16 - DL 08:28 0:11.26 [pf purge] root 9 0.0 0.0 0 16 - DL 08:28 0:02.80 [rand_harvestq] root 10 0.0 0.0 0 16 - DL 08:28 0:00.00 [audit] root 12 0.0 0.0 0 304 - WL 08:28 5:43.80 [intr] root 13 0.0 0.0 0 32 - DL 08:28 0:00.00 [ng_queue] root 14 0.0 0.0 0 48 - DL 08:28 0:02.19 [geom] root 15 0.0 0.0 0 160 - DL 08:28 0:00.44 [usb] root 16 0.0 0.0 0 16 - DL 08:28 0:00.00 [task: mx25l flash] root 17 0.0 0.0 0 16 - DL 08:28 0:08.58 [mmcsd0: mmc/sd card] root 18 0.0 0.0 0 16 - DL 08:28 0:00.00 [mmcsd0boot0: mmc/sd] root 19 0.0 0.0 0 16 - DL 08:28 0:00.00 [mmcsd0boot1: mmc/sd] root 20 0.0 0.0 0 16 - DL 08:28 0:00.01 [soaiod1] root 21 0.0 0.0 0 16 - DL 08:28 0:00.01 [soaiod2] root 22 0.0 0.0 0 16 - DL 08:28 0:00.01 [soaiod3] root 23 0.0 0.0 0 16 - DL 08:28 0:00.01 [soaiod4] root 24 0.0 0.0 0 48 - DL 08:28 0:00.97 [pagedaemon] root 25 0.0 0.0 0 16 - DL 08:28 0:00.00 [vmdaemon] root 26 0.0 0.0 0 16 - DNL 08:28 0:00.00 [pagezero] root 27 0.0 0.0 0 16 - DL 08:28 0:00.31 [bufspacedaemon] root 28 0.0 0.0 0 32 - DL 08:28 0:01.39 [bufdaemon] root 29 0.0 0.0 0 16 - DL 08:28 0:00.33 [vnlru] root 30 0.0 0.0 0 16 - DL 08:28 0:02.45 [syncer] root 70 0.0 0.0 0 16 - DL 08:28 0:00.06 [md0] root 361 0.0 0.1 102064 1384 - Ss 08:28 0:01.59 php-fpm: master process (/usr/local/lib/php-fpm.conf) (php-fpm) root 363 0.0 0.5 102196 4624 - I 08:28 0:03.43 php-fpm: pool nginx (php-fpm) root 364 0.0 0.6 108472 6364 - I 08:28 0:11.72 php-fpm: pool nginx (php-fpm) root 403 0.0 0.1 7088 900 - INs 08:28 0:00.03 /usr/local/sbin/check_reload_status root 404 0.0 0.0 7088 360 - IN 08:28 0:00.00 check_reload_status: Monitoring daemon of check_reload_status root 425 0.0 0.0 9132 252 - Ss 08:28 0:00.04 /sbin/devd -q -f /etc/pfSense-devd.conf root 8573 0.0 0.1 6592 896 - Ss 08:29 0:09.16 /usr/sbin/syslogd -s -c -c -l /var/dhcpd/var/run/log -P /var/run/syslog.pid -f /etc/syslog.conf root 10151 0.0 0.0 6260 324 - Is 08:29 0:00.00 /usr/local/bin/minicron 240 /var/run/ping_hosts.pid /usr/local/bin/ping_hosts.sh root 10453 0.0 0.0 6260 376 - I 08:29 0:00.03 minicron: helper /usr/local/bin/ping_hosts.sh (minicron) root 10529 0.0 0.0 6260 324 - Is 08:29 0:00.00 /usr/local/bin/minicron 3600 /var/run/expire_accounts.pid /usr/local/sbin/fcgicli -f /etc/rc.expireaccounts root 11339 0.0 0.0 6260 300 - I 08:29 0:00.00 minicron: helper /usr/local/sbin/fcgicli -f /etc/rc.expireaccounts (minicron) root 11528 0.0 0.0 6260 324 - Is 08:29 0:00.00 /usr/local/bin/minicron 86400 /var/run/update_alias_url_data.pid /usr/local/sbin/fcgicli -f /etc/rc.update_alias_url_data root 11629 0.0 0.0 6260 268 - I 08:29 0:00.00 minicron: helper /usr/local/sbin/fcgicli -f /etc/rc.update_alias_url_data (minicron) root 13116 0.0 0.1 13736 852 - Is 08:28 0:00.01 /usr/sbin/sshd root 23014 0.0 0.1 6616 528 - Is 08:28 0:00.01 dhclient: mvneta0.4090 [priv] (dhclient) _dhcp 26048 0.0 0.1 6616 648 - ICs 08:28 0:00.04 dhclient: mvneta0.4090 (dhclient) root 28762 0.0 0.1 6824 872 - Ss 08:28 0:04.75 /usr/local/sbin/filterlog -i pflog0 -p /var/run/filterlog.pid root 37393 0.0 0.2 6488 1604 - I 08:29 0:00.08 /usr/libexec/getty al.Pc ttyv0 root 37858 0.0 0.2 7172 2056 - Is 08:29 0:00.03 /bin/sh /usr/local/sbin/sshguard -i /var/run/sshguard.pid root 37945 0.0 0.1 6264 1504 - I 08:29 0:00.01 /bin/cat root 38173 0.0 0.3 12216 2744 - IC 08:29 0:00.01 /usr/local/libexec/sshg-parser root 38181 0.0 0.2 6728 1728 - IC 08:29 0:00.06 /usr/local/libexec/sshg-blocker root 38404 0.0 0.0 7172 240 - I 08:29 0:00.00 /bin/sh /usr/local/sbin/sshguard -i /var/run/sshguard.pid root 38679 0.0 0.2 7172 2020 - I 08:29 0:00.01 /bin/sh /usr/local/libexec/sshg-fw-pf root 41968 0.0 0.1 7104 772 - Is 08:28 0:08.54 /usr/local/bin/dpinger -S -r 0 -i WAN_DHCP -B 289.320.21.127 -p /var/run/dpinger_WAN_DHCP~289.320.21.127~84.241.64.1.pid -u /var/run/dpinger_WAN_DHCP~ root 51282 0.0 0.1 21244 568 - Is 08:28 0:00.00 nginx: master process /usr/local/sbin/nginx -c /var/etc/nginx-webConfigurator.conf (nginx) root 51457 0.0 0.2 23292 2028 - I 08:28 0:06.24 nginx: worker process (nginx) root 52112 0.0 0.1 6696 768 - Is 08:28 0:00.15 /usr/sbin/cron -s root 52480 0.0 0.2 12292 1840 - Ss 08:28 0:04.05 /usr/local/sbin/ntpd -g -c /var/etc/ntpd.conf -p /var/run/ntpd.pid root 56542 0.0 0.2 4212 1844 - SNC 16:48 0:00.00 sleep 60 dhcpd 58532 0.0 0.2 15348 1756 - Ss 08:28 0:04.74 /usr/local/sbin/dhcpd -user dhcpd -group _dhcp -chroot /var/dhcpd -cf /etc/dhcpd.conf -pf /var/run/dhcpd.pid mvneta0.4091 root 60037 0.0 0.7 13896 6608 - Ss 08:35 0:00.62 sshd: root@pts/0 (sshd) root 72191 0.0 0.4 104244 4208 - I 10:53 0:02.76 php-fpm: pool nginx (php-fpm) root 75307 0.0 0.3 40476 2724 - Ss 08:29 0:26.08 /usr/sbin/bsnmpd -c /var/etc/snmpd.conf -p /var/run/snmpd.pid root 37574 0.0 0.2 8044 2268 u0 Is 08:29 0:00.04 login [pam] (login) root 39053 0.0 0.2 7172 2104 u0 I 08:29 0:00.02 -sh (sh) root 44610 0.0 0.2 7172 2200 u0 I+ 08:29 0:00.02 /bin/sh /etc/rc.initial root 78177 0.0 0.2 7172 2268 u0- SN 08:29 0:09.27 /bin/sh /var/db/rrd/updaterrd.sh root 56863 0.0 0.3 7572 3032 0 R+ 16:48 0:00.01 ps aux root 60309 0.0 0.2 7172 2156 0 Is 08:35 0:00.02 -sh (sh) root 60753 0.0 0.2 7172 2196 0 I 08:35 0:00.02 /bin/sh /etc/rc.initial root 69605 0.0 0.3 7452 2908 0 S 08:35 0:00.19 /bin/tcsh -
You were actually running a test when those were taken?
-
Yes, the only thing which pop up maybe up to max 5-10% is
intr{gic0,s42: mvneta0}]but still above 90% idle on both cpu0 and cpu1. -
Any idea / suggestion ?
-
Not really. I would say this is some WAN side connection issue except you can see much higher speeds when connecting from the device itself.
Please open a ticket with us so we can review the config and connection status: https://go.netgate.com/
Steve