Unbound cache hit rate is anaemic
-
I've just been using Pfsense for a brief time, but I've been concerned about Unbound. At first it was restarting and flushing the cache every day or even hourly. That was the DHCP registration issue, all that is off now. Pfblocker is updating Unbound live, and that seems to be working. But my cache hit rate is low, mid 30% for all threads (4). I know its impossible to have a standard but previous hit rates on the same network same devices were in the 70% range regularly. Any thoughts, love to hear them.
-
Hi,
Ask pfSense how often Unbound restarts :
grep 'info: start of service' /var/log/resolver.log -
(deleted) duh I need to learn to read better
-
@Gertjan Thanks for that, but there were no restarts in the log. I'm going to monitor. the log for the next few days to see if it changes or there are any restarts.
-
Really the only number you need to look at is the total
unbound-control -c /var/unbound/unbound.conf stats_noreset | grep total.num
total.num.queries=17506
total.num.queries_ip_ratelimited=0
total.num.cachehits=15330
total.num.cachemiss=2176
total.num.prefetch=2951
total.num.expired=2387
total.num.recursivereplies=2176
How many queries total?? So from above you can see 15330/17506 = 87.5% hit rate..
Your hit rate is really going to depend on what is being queried for, and how they are queried, and what the ttls are..
if you have a box just grabbing ads from all over the place - then your hit rate is going to go down for sure.. Because your looking up a bunch of random shit that you don't look up again.. Or maybe your looking up stuff with really low ttl, and with the frequency you are asking for it again, the ttl has expired.. so it has to be resolved again.. What can help with that is setting serve 0, and also doing prefetch.. This means if something asks for something at the ttl is almost over, it will look it up in the background - so next time client asks for it, it hopefully will still be in the cache, etc.
Post up your total.num there so we can take a look.. Also how long your unbound has been up.. Can be useful. easier then looking int the log is to just ask the process directly.
[2.4.5-RELEASE][admin@sg4860.local.lan]/: unbound-control -c /var/unbound/unbound.conf status
version: 1.10.1
verbosity: 1
threads: 4
modules: 2 [ validator iterator ]
uptime: 80983 seconds
options: control(ssl)
unbound (pid 53055) is running...
Been up for 80983 seconds or roughly 22.5 hours.. And I have 17k some queries..
-
@johnpoz said in Unbound cache hit rate is anaemic:
unbound-control -c /var/unbound/unbound.conf stats_noreset | grep total.num
Looks like around the same at 34%, but something caused Unbound to restart about six hours ago.. I have Pfblocker active so I hope thats blocking a lot of the random ads you mentioned. Does Suricata have an effect on Unbound? I've set up DoT on Unbound also.
grep 'info: start of service' /var/log/resolver.logDoesn't show any restarts.
[2.4.5-RELEASE][admin@pfSense.localdomain]/root: unbound-control -c /var/unbound/unbound.conf stats_noreset | grep total.num
total.num.queries=7463
total.num.queries_ip_ratelimited=0
total.num.cachehits=2541
total.num.cachemiss=4922
total.num.prefetch=0
total.num.expired=0
total.num.recursivereplies=4922
[2.4.5-RELEASE][admin@pfSense.localdomain]/root: unbound-control -c /var/unbound/unbound.conf status version: 1.10.1 verbosity: 2 threads: 4 modules: 1 [ iterator ] uptime: 23151 seconds options: control(ssl) unbound (pid 77104) is running... -
pfblocker would still be a query be it hit or miss - pfblocker uses are just entries in unbound..
Your client wants to lookup somethingblocked.com - that is still a query to unbound, what unbound sends you back is what pfblocker does..
To Suricata was blocking outbound queries unbound was trying to lookup up.. Then something could never get cached, so if client kept asking for that - then those would always be misses.
Lets see what your number is once you hit closer to 20k total queries.
-
@stevogas said in Unbound cache hit rate is anaemic:
Looks like around the same at 34%, but something caused Unbound to restart about six hours ago.. I have Pfblocker active so I hope thats blocking a lot of the random ads you mentioned. Does Suricata have an effect on Unbound? I've set up DoT on Unbound also.
Suricata has zero interaction with
unbound. Neither Suricata nor Snort do anything with DNS except usecurlto download rules updates at the interval chosen on the UPDATES tab in those packages - so typically twice per day a lookup of the Snort or Suricata rules update URL would happen. That's the only communications those packages have withunbound. The IDS packages will not stop, start nor restartunbound.pfBlockerNG-devel with DNSBL enabled, on the other hand, will restart
unboundevery time the IP lists are updated. -
True..
But if say a client wanted to look up say something.tld, where the tld was blocked by a ips rule.. Have seen that happening around here in a few threads.
Wouldn't it depend on were the IPS is looking at the traffic and if the filter is inbound or outbound. So if client talks to unbound and says hey please lookup the A record for host.something.tld
Then unbound did the query and IPS stopped it from going outbound, unbound would just not get an answer, so could not cache anything.. Then client asks again and again.. Always being blocked when unbound asks for it. This would increase the misses on the cache - would it not?
-
@johnpoz said in Unbound cache hit rate is anaemic:
True..
But if say a client wanted to look up say something.tld, where the tld was blocked by a ips rule.. Have seen that happening around here in a few threads.
Wouldn't it depend on were the IPS is looking at the traffic and if the filter is inbound or outbound. So if client talks to unbound and says hey please lookup the A record for host.something.tld
Then unbound did the query and IPS stopped it from going outbound, unbound would just not get an answer, so could not cache anything.. Then client asks again and again.. Always being blocked when unbound asks for it. This would increase the misses on the cache - would it not?
Yeah, I didn't address those handful of DNS rules for IDS that trigger on lookups for certain TLDs. But hopefully, from the alert message, the admin could figure out what was happening.
I made the statement about "zero interaction" based on the way I interpreted the OP's question if Suricata could be responsible for
unboundrestarting. Maybe I misunderstood what was being said there. -
@bmeeks said in Unbound cache hit rate is anaemic:
But hopefully, from the alert message, the admin could figure out what was happening.
Exactly! If your hit/miss is not what you expect it to be.. You need to figure out what is being asked that would push the numbers one way or the other. And why they are either hits or misses.
All those numbers show you is something asked unbound for X, and that X was either in the cache or it was not.. It could just be you keep asking for something that has a low ttl, and it falls out of the cache before you ask for it again.
When trying to figure out what is pushing the hit rate one way or the other.. Prob best to log your queries for a bit, and then analyze what is getting asked for the most, and how often its being asked for..
You can have things skew the numbers in the hit rate direction with just some client that doesn't have local cache that keeps asking for host.xyz.com every 30 seconds, and its always in the cache.. So your hit rate spikes up.. Many a iot device could be doing that for example, and it would go the other direction if it keeps asking for something that is not in the cache, and can not be cached or is for short amount of time.. If client asks for something every 2 minutes, and ttl on the entry is only 1 minute.. Your cache hit rate is going to be in the dirt..
Now multiple those numbers as you add more and more devices that do not have local cache, and keep trying to phone home every so often.. It seems to be a trend on many of these dns services to set really low ttls.. I see 60 second ttls, 5 minute ttls - these are just not really sane if you have 1000's and or even million of devices that try and resolve whatever that is - unless your goal is to increase the number of queries seen, so you can charge the person using your dns service more ;)
example.. Look at this shit
gsp85-ssl.ls2-apple.com.akadns.net. 60 IN A     17.167.192.94
gsp85-ssl.ls2-apple.com.akadns.net. 60 IN A     17.167.194.47
;; Received 95 bytes from 184.26.160.131#53(a12-131.akagtm.org) in 31 ms
That is going to cause a lot of queries, even if cached.. When your client keeps asking for it..
Maybe my iot devices a skewing my number high on the hit rate.. But you want a high hit rate!! Because otherwise your doing external queries..
See how often my thermostat is asking for that..
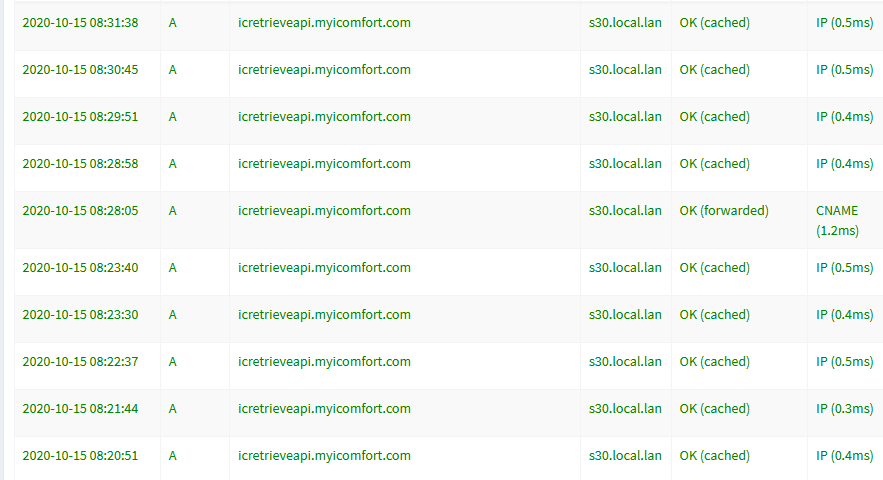
Most of those are cache hits.. If they were not, that would for sure skew your numbers down...
But my unbound is upstream of pihole, so unbound only sees queries from my pihole, and from some devices that don't use pihole, etc. So my unbound will never see queries for stuff pihole answers from cache.. So this would lower the total number of queries unbound actually gets.. And was still in the 17k range for less than 24 hours.
-
Something is causing Unbound to restart, I got up to 9 hours before it just reset. The log preceding
service stopped was preceded by hundreds of error sending query then a stats_noreset, e.g.Oct 15 12:18:45 pfSense unbound: [38494:0] info: error sending query to auth server 1.1.1.1 port 853 Oct 15 12:18:45 pfSense unbound: [38494:0] info: error sending query to auth server 1.1.1.1 port 853 Oct 15 12:18:45 pfSense unbound: [38494:0] info: error sending query to auth server 1.1.1.1 port 853 Oct 15 12:18:45 pfSense unbound: [38494:0] info: error sending query to auth server 1.1.1.1 port 853 Oct 15 12:18:45 pfSense unbound: [38494:0] info: error sending query to auth server 1.1.1.1 port 853 Oct 15 12:18:46 pfSense unbound: [38494:0] info: control cmd: stats_noreset Oct 15 12:18:47 pfSense unbound: [38494:0] info: service stopped (unbound 1.10.1).It then prints the stats and restarts.
Oct 15 12:18:55 pfSense unbound: [89061:0] notice: init module 0: iterator
Oct 15 12:18:55 pfSense unbound: [89061:0] info: start of service (unbound 1.10.1).
Oct 15 12:18:55 pfSense unbound: [89061:2] info: resolving 0.client-channel.google.com. A IN
My Pfblocker update schedule is probably not the issue, it's set to live update unbound every 3 hours. IDK if this matters but the errors started with attempts to resolve icloud and itunes addresses, and I think one Apple device is ramming through DoH queries, this seems to be where the errors ramped up.
Oct 15 12:18:41 pfSense unbound: [38494:3] info: resolving gateway.icloud.com. TYPE65 IN
Oct 15 12:18:41 pfSense unbound: [38494:3] info: resolving gateway.icloud.com. TYPE65 IN
Oct 15 12:18:41 pfSense unbound: [38494:0] info: error sending query to auth server 185.228.169.9 port 853
Oct 15 12:18:41 pfSense unbound: [38494:0] info: error sending query to auth server 1.0.0.1 port 853
Oct 15 12:18:41 pfSense unbound: [38494:3] info: resolving gateway.icloud.com. A IN
Oct 15 12:18:41 pfSense unbound: [38494:3] info: resolving gateway.icloud.com. A IN
How would I track down the cause of the restart further?
-
@stevogas said in Unbound cache hit rate is anaemic:
Something is causing Unbound to restart,
pfBlocker could do so.
As new DHCP leases (not the static ones, as they are static) but you took care of that.
Other reasons exists : like (uplink) interfaces going bad. dpinger notices this and restarts all packages that are 'interface' related.
unbound is one of them.
See the main system log for restart of packages messages / reasons.@stevogas said in Unbound cache hit rate is anaemic:
Oct 15 12:18:46 pfSense unbound: [38494:0] info: control cmd: stats_noreset
This command is thrown at unbound to collect stats.
It means (see manual) : "collect the stats and don't reset them to zero".@stevogas said in Unbound cache hit rate is anaemic:
update unbound every 3 hours
Even for files that have new versions ones a week ?
Take note that 'liveupdate' works under special conditions : if they are not met, a classic restart is executed. -
Thanks for the suggestions. After 45 hours with no service stopped, about a 38% hit rate.
uptime: 164536 secondstotal.num.queries=53491 total.num.queries_ip_ratelimited=0 total.num.cachehits=20382 total.num.cachemiss=33109 total.num.prefetch=0 total.num.expired=0 total.num.recursivereplies=33109I'll have to follow some of @johnpoz clues to track down what's diluting my hit rates. I am going to add prefetching to see what effect that will have, and may consider a pihole setup.
-
@stevogas said in Unbound cache hit rate is anaemic:
I am going to add prefetching
edit: Turned on prefetch, qname minimization (not strict), and cache-min-ttl to 1200. msg cache size to 20m. See how this does for a while.
-
@stevogas said in Unbound cache hit rate is anaemic:
qname minimization (not strict)
not strict might be ok, but can tell you for sure that strict will cause stuff not to resolve.. While it great idea in theory... Problem is so many domains are pretty messed up to be honest.. cname to cname to cname to cname, etc..
Cache size is going to do nothing, your not hitting the default, so what is making it bigger going to do.. Only time you would even need to update that is if your seeing evictions from the chace.
You could bump the min ttl to 3600.. Been running that for long time have never had any issues - I hate the trend of moving to 60, and 5 minute ttls - its just asinine!!!
I would suggest you enable 0 ttl answering.. if what your wanting to do is answer stuff locally vs resolving it.. Happens then is last item is returned, and then record is looked up.
Never had any issues with that either.
-
Unbound has been up over 45 hours.
uptime: 164767 secondsMy cache rate has been hovering around mid 40%, looks like its settled in. That may just be the prefetch effect after my last tweeks. Still, a disappointing baseline.
total.num.queries=43409
total.num.queries_ip_ratelimited=0
total.num.cachehits=19764
total.num.cachemiss=23645
total.num.prefetch=462
total.num.expired=0
total.num.recursivereplies=23645
Most of the optimizations on Nlnet Labs have to do with speed, but I'm also interested in privacy and trying to keep resolving local as much as possible.
-
Well your really going to need to look to what is being looked up, and you might want to adjust your min TTL, as stated before many a ttl this days is just so freaking low - for no reason I can see other than trying to up their query count.
The only sane reason you would have a 5 minute or 60 second ttl, if you were in the middle of migration.. A round robin of 1 hour or 8 hours works just the same as a round robin with 5 minutes.. Your still spreading the load across those IPs.. And with many things pointing to a CDN which is behind load balancing anyway..
The only reason I can see for such low ttls, is wanting to inflate the number of queries so you can charge more ;)
-
-
Up over 69 hrs. which is an accomplishment in itself.
uptime: 216706 secondsAnd 60.9% hitrate. It achieved that level after only a few hours and has been steady.
total.num.queries=58241
total.num.queries_ip_ratelimited=0
total.num.cachehits=35473
total.num.cachemiss=22768
total.num.prefetch=933
total.num.expired=0
total.num.recursivereplies=22768
Thanks @johnpoz for the suggestions! We may be at the upper limit for this config.