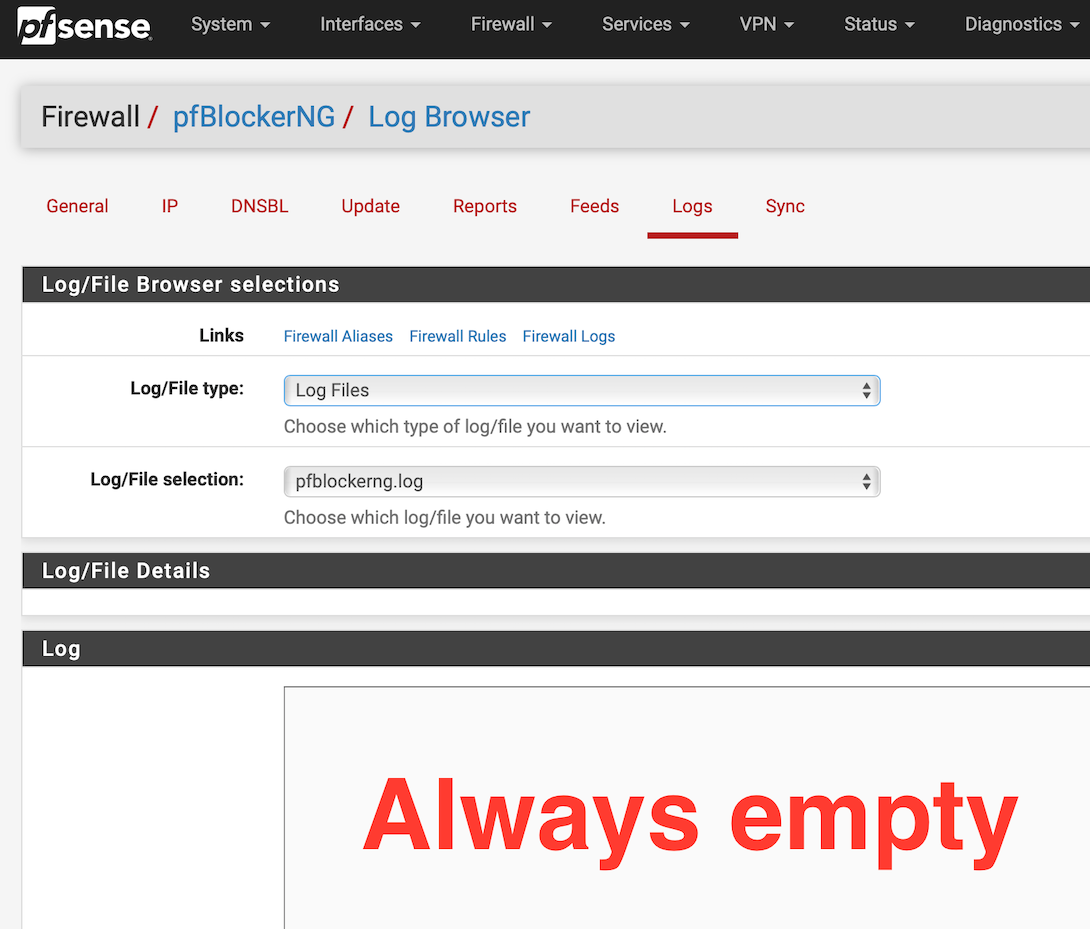
Log Browser always empty
-
@johnpoz
Thanks for you're response.
As per my initial post, whatever I pick, it's empty.I went ahead and replicated your screenshot - it was empty.
Although I did notice that your "Log/FIle Details" section populates with the path to the file that is being loaded, which I have never seen before.
Is it possible that log file creation/reading is not set up properly on my system?
-
@sebm what specific parts of pfblocker have you setup? Is it running? You have it enabled?
For example - I am only using it for aliases, etc.. So some sections are not there in the logs
-
@johnpoz
I confirm: pfBlockerNG is enabled and running.- DNSBL is enabled and running, with the appropriate groups I need
- IP section is configured, and MaxMind GeoIP set up
- Feeds are enabled
The Reports section populates with data for DNSBL and IP, and I've been successfully whitelisting domains for a while. In addition the dashboard widget displays ongoing activity as expected.
Please note:
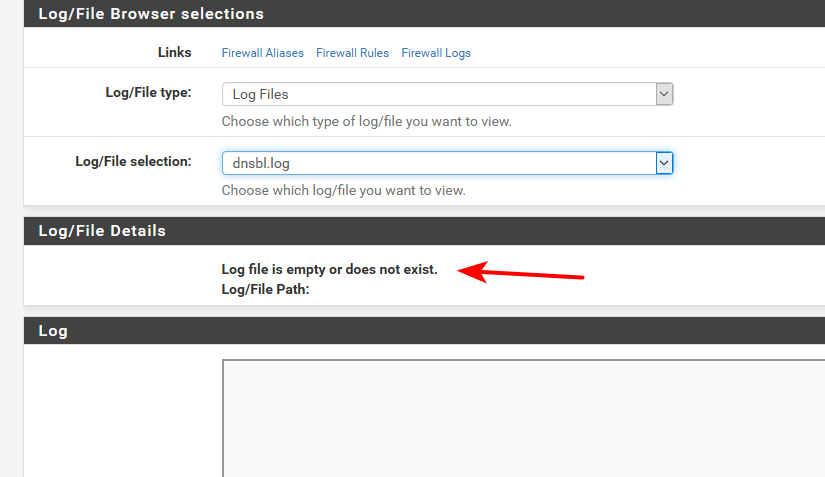
I noticed that on your last screenshot, it tells you when the log file is empty or does not exit - as per my initial screenshot, no matter what I select, the section "Log/File Details" also remain empty.
-
@sebm I have exactly the same problem as sebm. The files always appear empty and the section of the page for log file/details is always empty. I believe that it used to work for me at some point in the past but hasn’t recently. I’m on the 3.0 series - may not be quite up to date and on current pfSense.
-
@sebm Go to the shell or Diagnostics / Command prompt :
ls -al /var/log/pfblockerng

total 41989
drwxr-xr-x  2 unbound  unbound        13 Dec 15 17:15 .
drwxr-xr-x  7 root     wheel          30 Oct  2 19:39 ..
-rw-------  1 unbound  unbound  56569458 Dec 15 18:22 dns_reply.log
-rw-------  1 unbound  unbound  12481370 Dec 15 18:19 dnsbl.log
-rw-------  1 unbound  unbound   3320732 Mar 29  2019 dnsbl.log_old
-rw-------  1 root     wheel    15909775 Dec 15 17:15 dnsbl_parsed_error.log
-rw-------  1 root     wheel      626075 Dec 15 17:15 error.log
-rw-------  1 root     wheel      180038 Dec 15 17:15 extras.log
-rw-------  1 root     wheel    20548660 Dec 15 18:21 ip_block.log
-rw-------  1 root     wheel      330794 Dec 15 17:15 ip_permit.log
-rw-r--r--  1 root     wheel         120 Dec 10 04:00 maxmind_ver
-rw-------  1 root     wheel    10299841 Dec 15 17:15 pfblockerng.log
-rw-r--r--  1 unbound  unbound         0 Oct  2 18:53 py_error.log
2.4.5-RELEASE-p1 (amd64)
Intel Core2 Quad CPU Q8400 @ 2.66GHz 8GB
Backup 0.5_5, Bandwidthd 0.7.4_4, Cron 0.3.7_5, pfBlockerNG-devel 3.0.0_16, Status_Traffic_Totals 2.3.1_1, System_Patches 1.2_5 -
^ Exactly.. good check!
-
@ronpfs Thanks for your comment.
This is the output I get for that command:total 13696 drwxr-xr-x 2 root wheel 512 Dec 15 15:10 . drwxr-xr-x 7 root wheel 1024 Jun 2 2020 .. -rw------- 1 root wheel 2382734 Dec 15 15:24 dnsbl.log -rw------- 1 root wheel 16336 Dec 15 15:01 dnsbl_parsed_error.log -rw------- 1 root wheel 664071 Dec 15 15:10 error.log -rw------- 1 root wheel 3331 Dec 15 15:01 extras.log -rw------- 1 root wheel 3011054 Dec 15 15:01 ip_block.log -rw-r--r-- 1 root wheel 120 Dec 13 15:01 maxmind_ver -rw------- 1 root wheel 730595 Dec 15 15:01 pfblockerng.log -
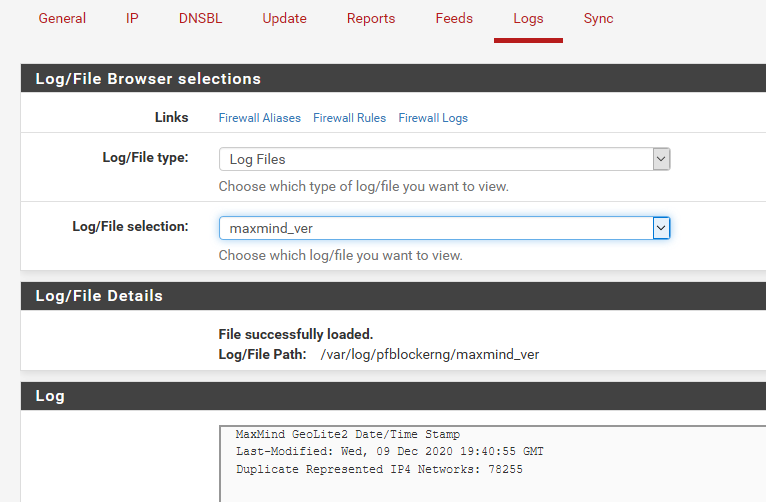
@sebm Well you should be able to view those.. call up say the maxmind ver
Your not logged in as some other account other than admin into the webgui are you?
An intelligent man is sometimes forced to be drunk to spend time with his fools
If you get confused: Listen to the Music Play
Please don't Chat/PM me for help, unless mod related
SG-4860 25.07.1 | Lab VMs 2.8.1, 25.07.1 -
tail /var/log/pfblockerng/pfblockerng.log

[ SCANR_Shodan_v4 ]		 exists.
[ SCANR_ISC_Onyphe_v4 ]		 exists.
[ DNSBLIP_v4 ]			 exists.

===[  Aliastables / Rules  ]==========================================

No changes to Firewall rules, skipping Filter Reload
No Changes to Aliases, Skipping pfctl Update

 UPDATE PROCESS ENDED
Then check System log, Console to see if any errors are displayed.
No Crash report in the Dashboard ?2.4.5-RELEASE-p1 (amd64)
Intel Core2 Quad CPU Q8400 @ 2.66GHz 8GB
Backup 0.5_5, Bandwidthd 0.7.4_4, Cron 0.3.7_5, pfBlockerNG-devel 3.0.0_16, Status_Traffic_Totals 2.3.1_1, System_Patches 1.2_5 -
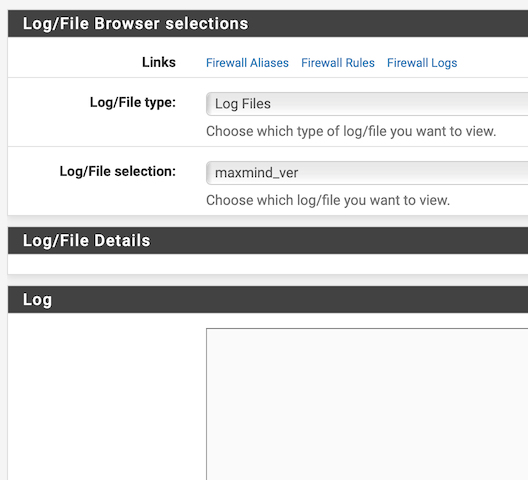
@johnpoz I confirm being logged in as admin, and do not even have other users created.
I tried to open that very file after having enabled MaxMind the other day, before posting here.
Here's the sad screenshot of what I see:
-
Can you try it with a different browser? Are you using any sort of addons in your browser that could block stuff?
An intelligent man is sometimes forced to be drunk to spend time with his fools
If you get confused: Listen to the Music Play
Please don't Chat/PM me for help, unless mod related
SG-4860 25.07.1 | Lab VMs 2.8.1, 25.07.1 -
@ronpfs There you go my friend:
Shell Output - tail /var/log/pfblockerng/pfblockerng.log
Alias table IP Counts
-----------------------------
   22091 /var/db/aliastables/pfB_PRI1_v4.txt

pfSense Table Stats
-------------------
table-entries hard limit   400000
Table Usage Count         140261

 UPDATE PROCESS ENDED [ 12/15/20 15:01:40 ]
I don't see any errors in Status / System Logs / System / General
No crash report in Dashboard that I can see.
-
@sebm Try F5 or CTRL-F5 to refresh the code.
Maybe something went wrong last time you upgraded. Disable pfBlockerNG, reinstall pfBlockerNG, enable pfBlockerNG.
2.4.5-RELEASE-p1 (amd64)
Intel Core2 Quad CPU Q8400 @ 2.66GHz 8GB
Backup 0.5_5, Bandwidthd 0.7.4_4, Cron 0.3.7_5, pfBlockerNG-devel 3.0.0_16, Status_Traffic_Totals 2.3.1_1, System_Patches 1.2_5 -
@johnpoz I use Safari and have no Extensions enabled.
Just tried the same with a clean Firefox, same problem.
Nothing in the Log/File Details or Log sections...Should I try a reboot?

-
@ronpfs said in Log Browser always empty:
Maybe something went wrong last time you upgraded. Disable pfBlockerNG, reinstall pfBlockerNG, enable pfBlockerNG.
As suggested:
- disabled
- uninstalled
- re-installed
- re-enabled
Same problem...
-
@sebm You can view files with Diagnostics / Edit File tab.
You can also download File with the Diagnostics / Command Prompt tab.2.4.5-RELEASE-p1 (amd64)
Intel Core2 Quad CPU Q8400 @ 2.66GHz 8GB
Backup 0.5_5, Bandwidthd 0.7.4_4, Cron 0.3.7_5, pfBlockerNG-devel 3.0.0_16, Status_Traffic_Totals 2.3.1_1, System_Patches 1.2_5 -
@sebm said in Log Browser always empty:
Should I try a reboot?
FYI,
I did the unimaginable after a 120 days uptime: rebooted.
Same problem persists... -
@ronpfs said in Log Browser always empty:
@sebm You can view files with Diagnostics / Edit File tab.
You can also download File with the Diagnostics / Command Prompt tab.That's right my friend: I confirm I was able to open or download any files from the /var/log/pfblockerng/ folder using these two methods.
Is that your subtle way to say "forget about it", use a workaround?

-
@sebm What version of pfsense ? No disk full ?
-
@sebm said in Log Browser always empty:
Is that your subtle way to say "forget about it", use a workaround?
It's a way for you to inspect
 log files until @BBcan177 find time
  to read your post.