Grafana Dashboard using Telegraf with additional plugins
-
This dashboard is absolutely fantastic! it works very well.
It looks like it would have taken a lot of hard work, time and effort.
Thanks for doing this! -
Any idea how to install Telegraf on SG-3100? pFsense version 2.4.5-RELEASE-p1 (arm).
-
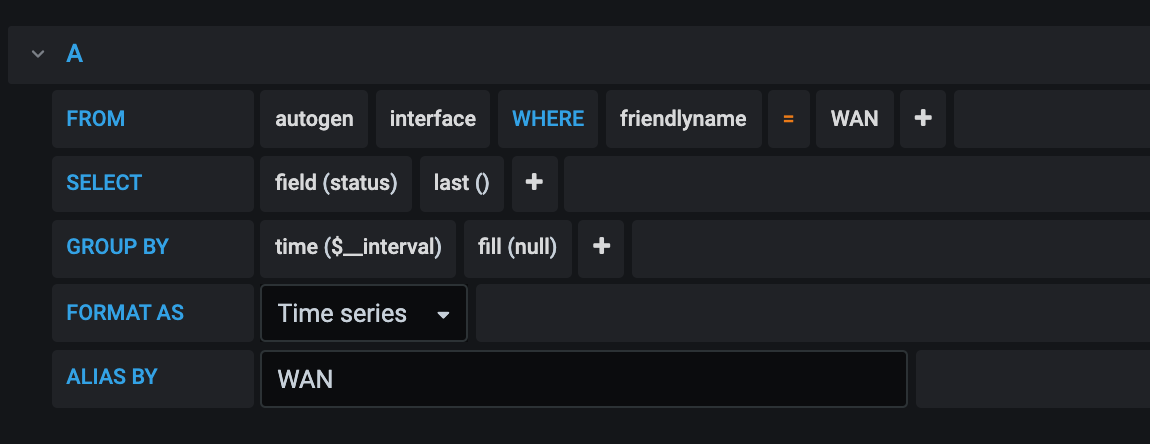
To calculate the monthly WAN download/upload, use the following query format
SELECT non_negative_difference(last("bytes_recv")) FROM "net" WHERE ("host" =~ /^$Host$/ AND "interface" =~ /^$WAN$/) AND $timeFilter GROUP BY time($__interval) fill(null)
Set Query Options / Relative Time to - 'now/M'. Leave Everything else as is in Query Options.
For Visualization use 'Stat'. Then under 'Display' select Calculations > Total
Then Goto Field from the TAB above / Units > bytes(SI)
-
@ab5g said in Grafana Dashboard using Telegraf with additional plugins:
To calculate the monthly WAN download/upload, use the following query format
SELECT non_negative_difference(last("bytes_recv")) FROM "net" WHERE ("host" =~ /^$Host$/ AND "interface" =~ /^$WAN$/) AND $timeFilter GROUP BY time($__interval) fill(null)
Set Query Options / Relative Time to - 'now/M'. Leave Everything else as is in Query Options.
For Visualization use 'Stat'. Then under 'Display' select Calculations > Total
Then Goto Field from the TAB above / Units > bytes(SI)
Bamm! thank you, this works now for me!!! Can someone maybe upload a fully working dashboard so we can use import in grafana? With a corected Mb/s etc..
-
Getting Mbps on the graph is easy.
Select the WAN Panel > Edit > Panel Settings > Axis / Left Y - Change this to bits/sec
Also change the query to add *8So your query will look like this
SELECT derivative(mean("bytes_recv"), 1s) *8 FROM "net" WHERE ("host" =~ /^$Host$/ AND "interface" =~ /^$WAN$/) AND $timeFilter GROUP BY time($__interval) fill(null)
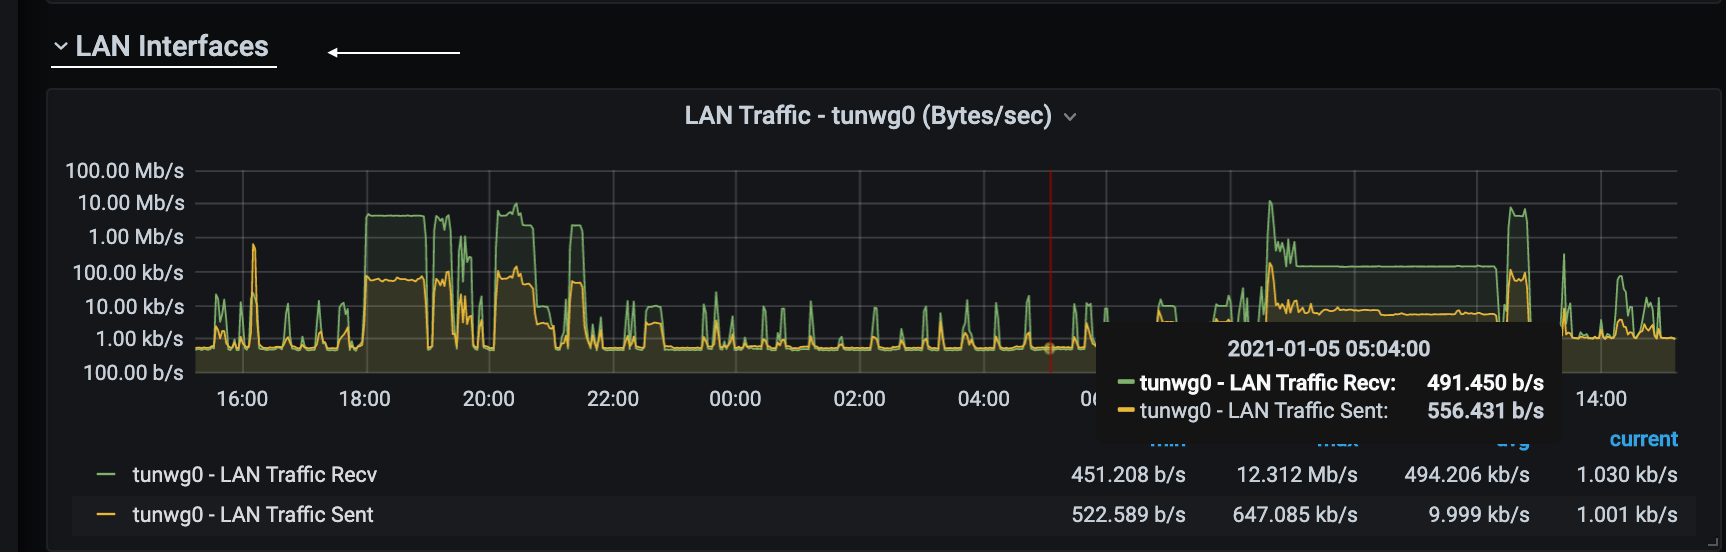
Do the same for the LAN Panel (the first one). Then click 'LAN Interfaces' (the master container for all LAN panels - see pic) . Click Settings > Repeat for Datasouce and this Mbps setting applies to all LAN panels.
-
@ab5g said in Grafana Dashboard using Telegraf with additional plugins:
Getting Mbps on the graph is easy.
Select the WAN Panel > Edit > Panel Settings > Axis / Left Y - Change this to bits/sec
Also change the query to add *8So your query will look like this
SELECT derivative(mean("bytes_recv"), 1s) *8 FROM "net" WHERE ("host" =~ /^$Host$/ AND "interface" =~ /^$WAN$/) AND $timeFilter GROUP BY time($__interval) fill(null)
Do the same for the LAN Panel (the first one). Then click 'LAN Interfaces' (the master container for all LAN panels - see pic) . Click Settings > Repeat for Datasouce and this Mbps setting applies to all LAN panels.
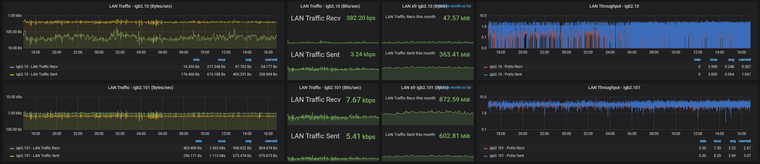
Thank you, for th WAN it is now correct just i am seeing there Mb/s - Megabit per second.
But for the LAN i need to see MB/s = Megabyte per second. I mean i need to see the exact value such as when you copy a file from your NAS, you see there the rate MB/s. -
This post is deleted! -
I noticed recently that the systems row is no longer tracking the time range that is selected up at the top right.
Is this something that should be defined in the query or did something break with an upgrade somewhere along the way?
Can someone else confirm if they are able to see changes in the systems row statistics whenever the change the time frame in the upper right hand corner of the dashboard?
I did go ahead and pull down the latest json from github just to be sure that wasn't the problem.
-
@bigjohns97 Seems to be working for me.
-
@ab5g I did recently upgrade pretty much everything (pfsense 12, pfblockerng 3.007 grafana. Etc)
Just a heads up. I haven't had a chance to dig into the data to see if the dates aren't being kept or what really has changed.
-
@bigjohns97 I am on 11.3 with pfBlockerng at 3.0.0_7. If you recently updated to 12, make sure that the Telegraf additional configs are in place and your scripts are still in usr/local/bin with the correct permissions.
-
@ab5g yep that is all confirmed working and I was sure it was working after the upgrade to 12.x and 3.x so I am leaning towards new version of grafana or possibly a combination of the two.
-
Well I kinda found out what happened, I believe something went haywire during one of the many upgrades and ended up putting some log entries without time or dates into my dnsbl.log which in turn was put into my influxdb.
I ended up having to delete the dnsbl.log and let pfblockerng automatically create it and then I deleted the database from within influx and everything was working again.
There was nothing wrong with grafana.
-
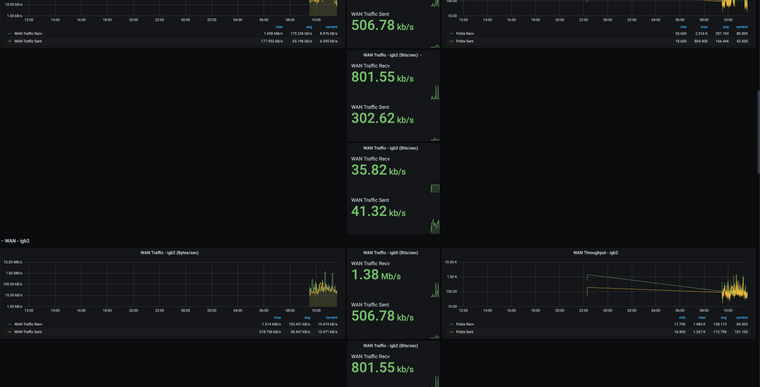
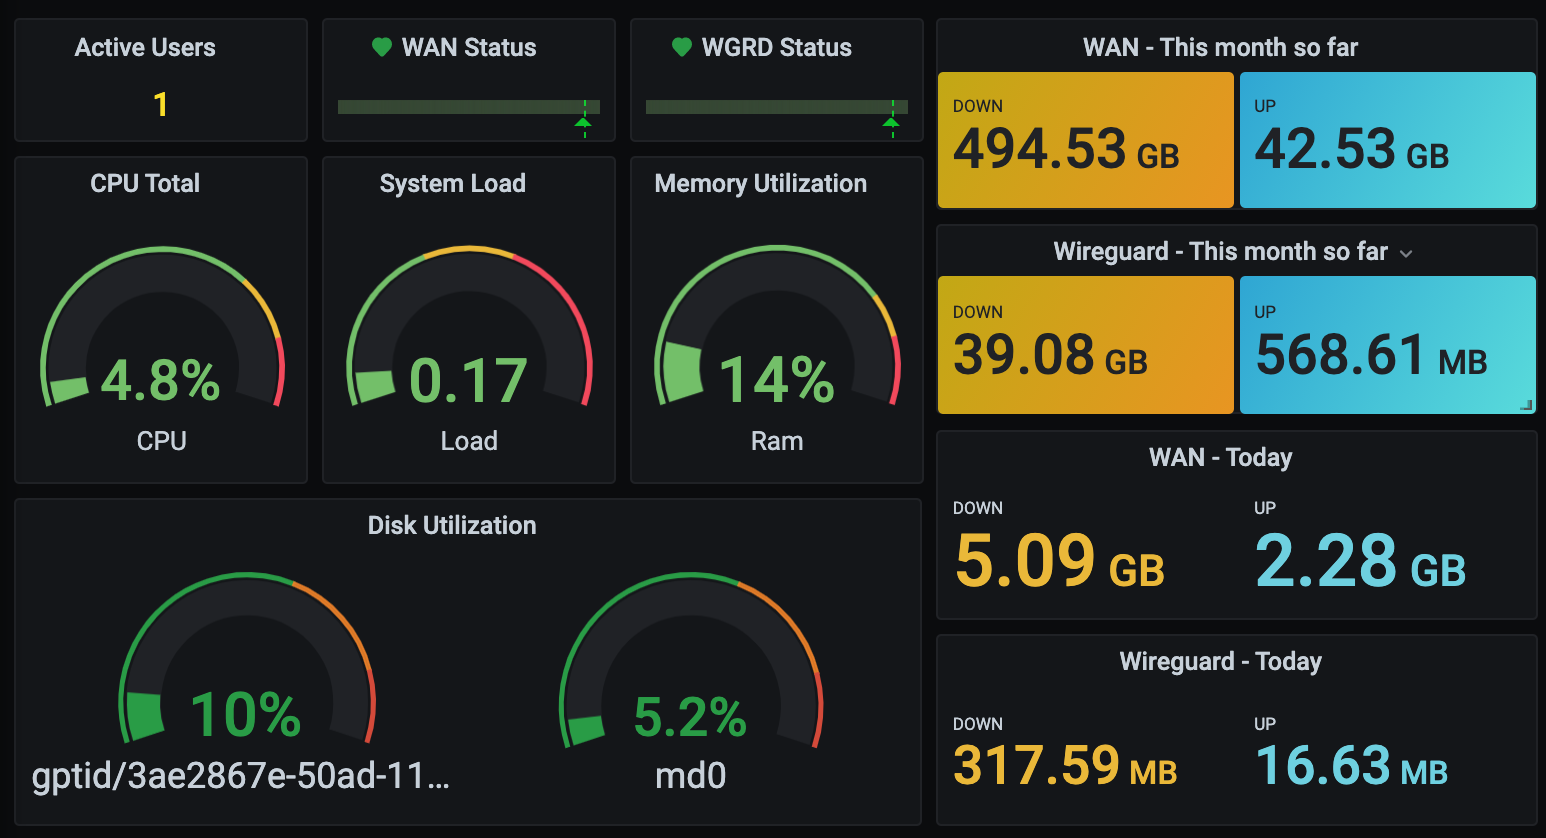
I'm seeing multiple widgets for each of my WAN items:
I also had to manually add the additional code via the command line to the telelgraf.conf file manually as when I add it via the browser it adds the ^M characters. I'm on a Mac so that shouldn't happen, anyone else see this?
-
-
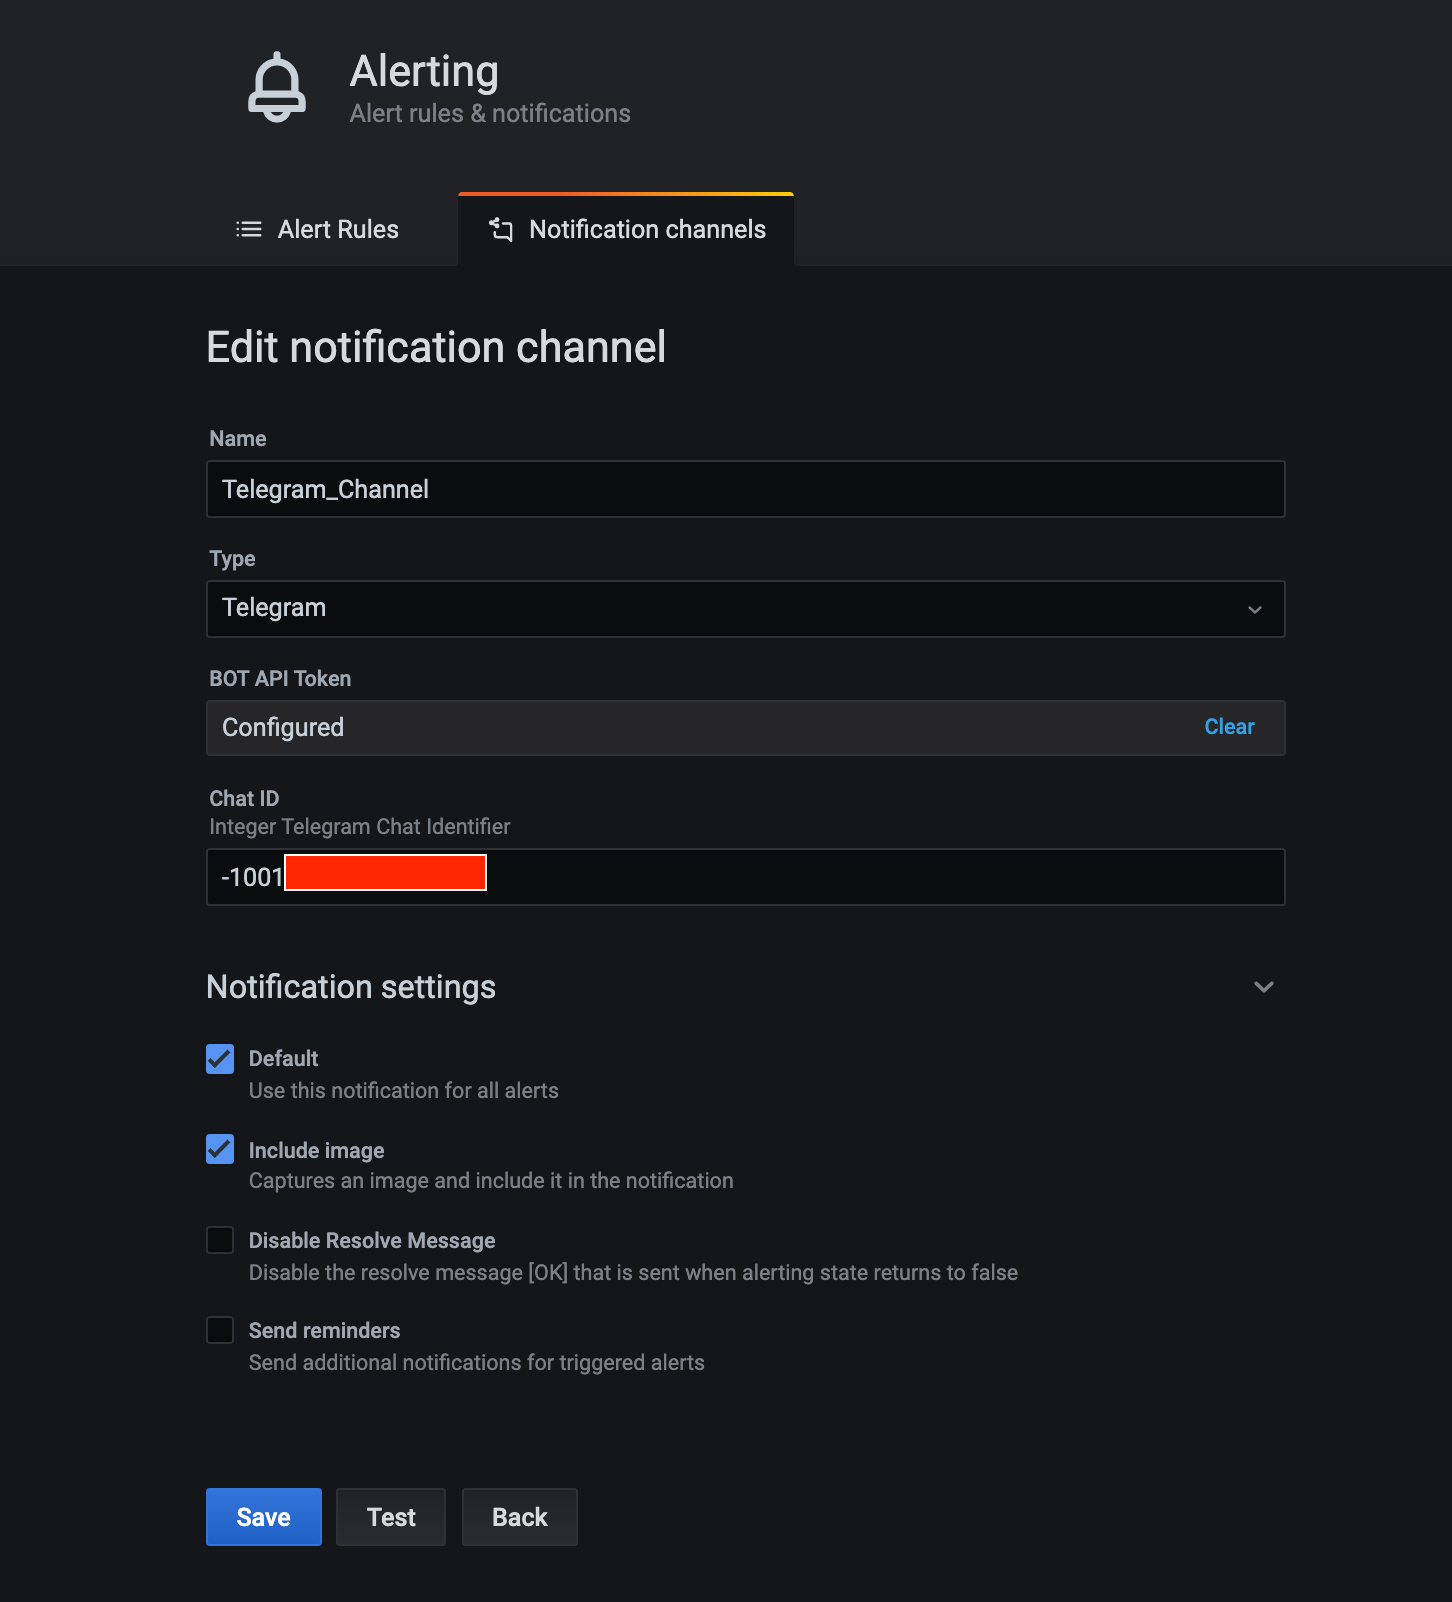
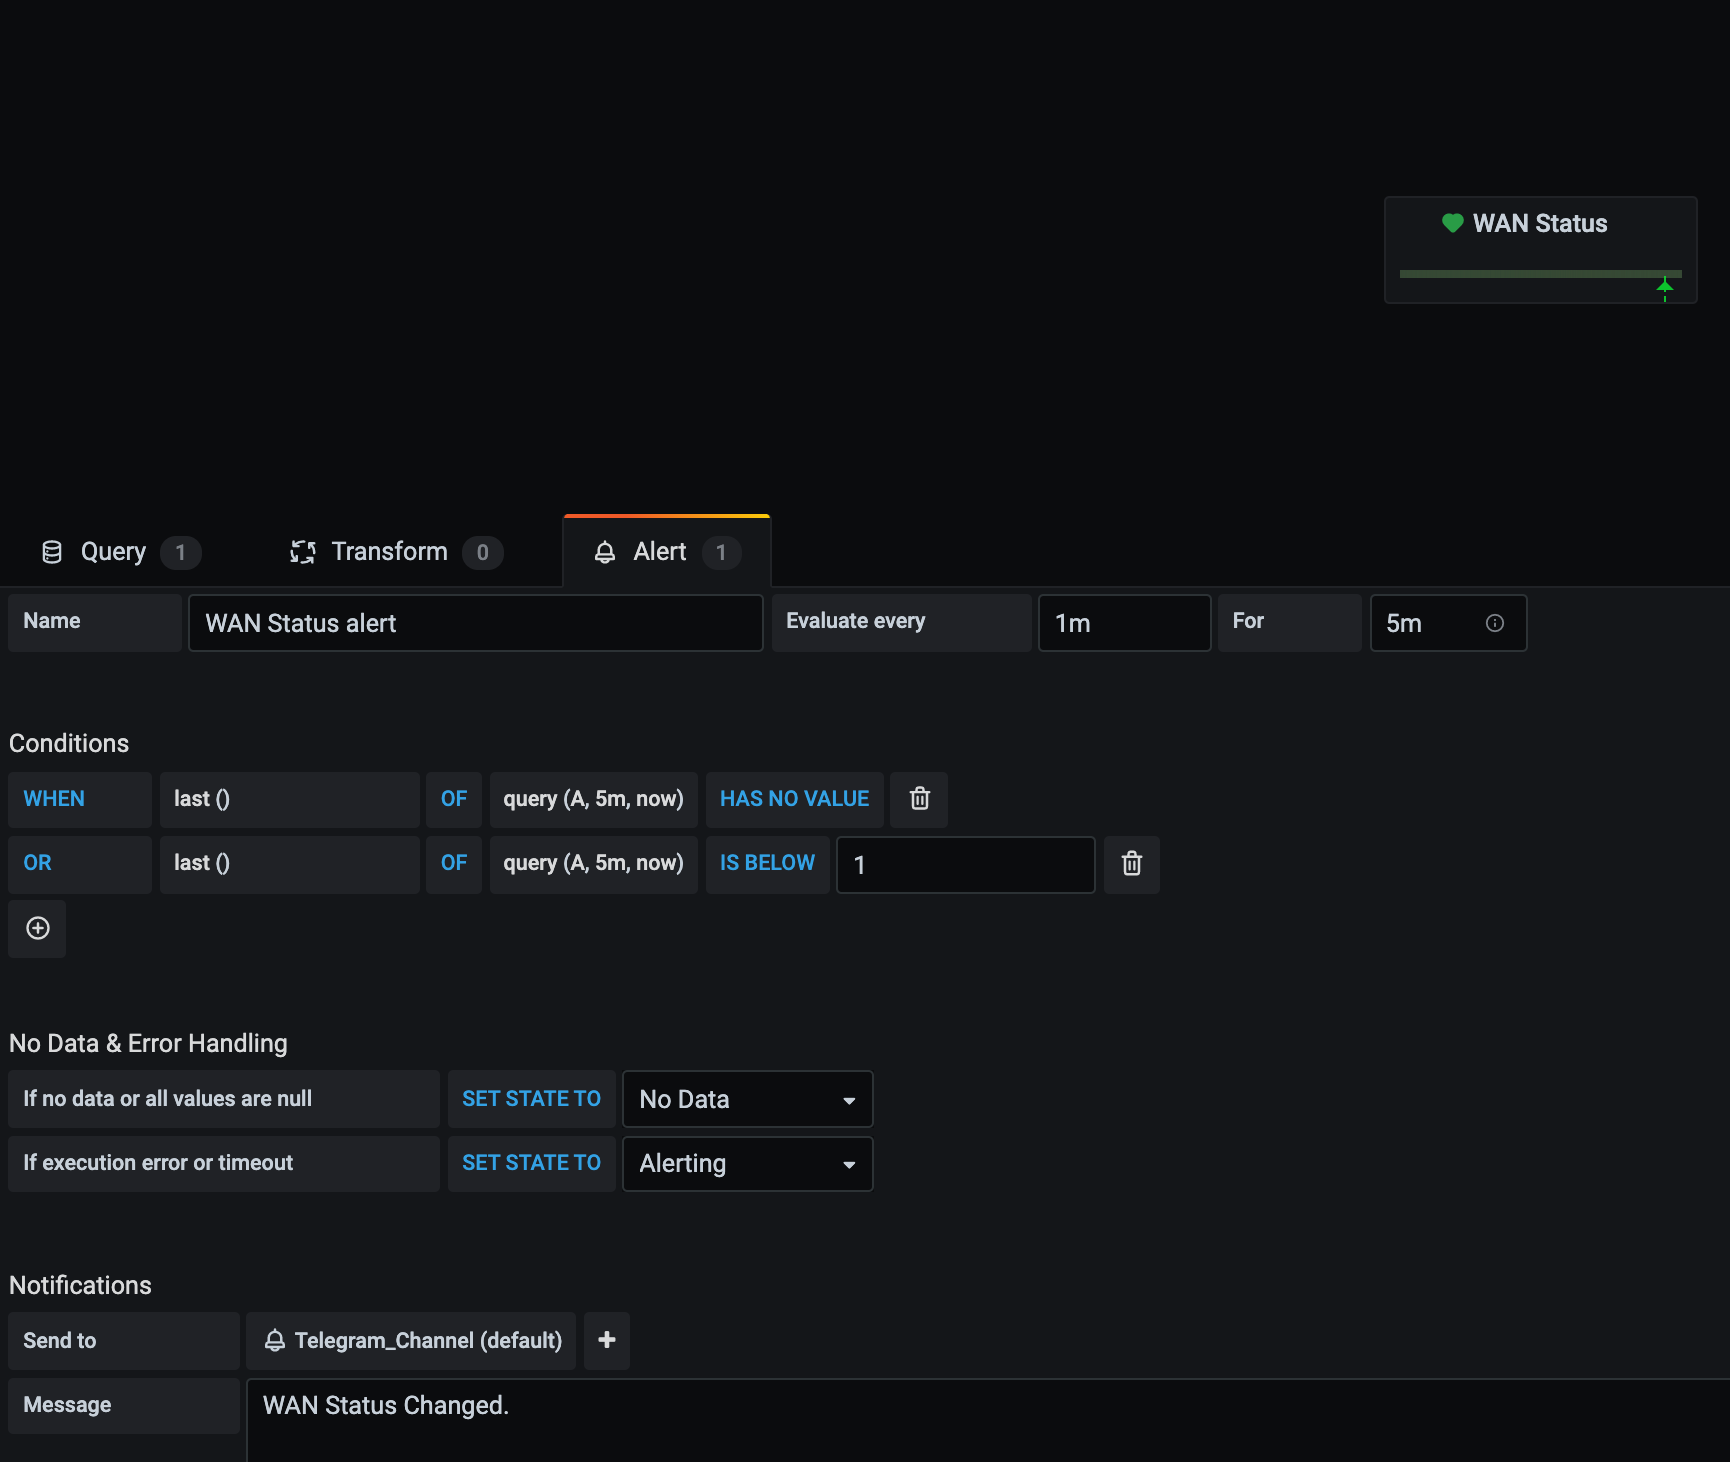
I also have telegram integration with Grafana setup as per here - https://gist.github.com/ilap/cb6d512694c3e4f2427f85e4caec8ad7
I use this to receive notifications if my WAN and Wireguard tunnels go down.
-
@pfsencue ok i just grabbed the one from the grafana website you created @VictorRobellini and it works great from there... looking forward to that update above!
-
I was playing with the telegraph_unbound script and noticed it wasn't working and ended up replacing the command in the script with the following
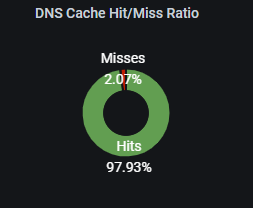
unbound-control -c /var/unbound/unbound.conf stats_noreset | grep total.numThis provides a cache hit stats output and was wondering if anyone had any skills with grafana to provide a nice panel addition to this already great dashboard. Was looking for something like this.
I found this thread from reddit where they were discussing how to optimize cache hits and couldn't figure out how to get the following panel to show.
If anyone has the knowledge on how to create this panel I would greatly appreciate it!
(I tried to post the original thread from reddit but it kept flagging this post as spam)
-
@bigjohns97 said in Grafana Dashboard using Telegraf with additional plugins:
I was playing with the telegraph_unbound script and noticed it wasn't working and ended up replacing the command in the script with the following
unbound-control -c /var/unbound/unbound.conf stats_noreset | grep total.numThis provides a cache hit stats output and was wondering if anyone had any skills with grafana to provide a nice panel addition to this already great dashboard. Was looking for something like this.
I found this thread from reddit where they were discussing how to optimize cache hits and couldn't figure out how to get the following panel to show.
If anyone has the knowledge on how to create this panel I would greatly appreciate it!
(I tried to post the original thread from reddit but it kept flagging this post as spam)
Was able to reach out to the originator of this post from reddit and get a working version of this
SELECT "total_num_cachehits" FROM "unbound" WHERE ("host" = 'pfSense.localdomain') AND $timeFilterSELECT "total_num_cachemiss" FROM "unbound" WHERE ("host" = 'pfSense.localdomain') AND $timeFilter{ "aliasColors": { "Hits": "#629e51", "Misses": "#bf1b00" }, "breakPoint": "50%", "cacheTimeout": null, "combine": { "label": "Others", "threshold": 0 }, "datasource": "$dataSource", "decimals": null, "fieldConfig": { "defaults": { "custom": {} }, "overrides": [] }, "fontSize": "100%", "format": "short", "gridPos": { "h": 6, "w": 3, "x": 13, "y": 7 }, "hideTimeOverride": false, "id": 23763571993, "interval": null, "legend": { "header": "", "percentage": true, "percentageDecimals": 0, "show": true, "sortDesc": true, "values": false }, "legendType": "On graph", "links": [], "maxDataPoints": 3, "nullPointMode": "connected", "pieType": "donut", "pluginVersion": "6.3.3", "strokeWidth": "2", "targets": [ { "alias": "Hits", "groupBy": [], "measurement": "unbound", "orderByTime": "ASC", "policy": "default", "refId": "A", "resultFormat": "time_series", "select": [ [ { "params": [ "total_num_cachehits" ], "type": "field" } ] ], "tags": [ { "key": "host", "operator": "=~", "value": "/^$Host$/" } ] }, { "alias": "Misses", "groupBy": [], "measurement": "unbound", "orderByTime": "ASC", "policy": "default", "refId": "B", "resultFormat": "time_series", "select": [ [ { "params": [ "total_num_cachemiss" ], "type": "field" } ] ], "tags": [ { "key": "host", "operator": "=~", "value": "/^$Host$/" } ] } ], "thresholds": [], "timeFrom": null, "timeShift": null, "title": "DNS Cache Hit/Miss Ratio", "type": "grafana-piechart-panel", "valueName": "current" }Here is my current stats (I set min ttl to 3600 in unbound)
EDIT : I forgot to mention you have to use this command in the telegraf_unbound.sh and make sure you uncomment it from the telegraf config in the install instructions
unbound-control -c /var/unbound/unbound.conf stats_noreset | grep total.num -
I'm not sure where do I install these plugins and telegraf config. On my pfsense or on my Linux box where I have telegraf and influxdb installed?