High latency when viewing Status Dashboard
-
Ive noticed that when viewing the Status dashboard my routers processor is heavily loaded to the point that traffic throughout is affected significantly. Has anyone seen issues like this before?
Processor is Xeon-D 2100 8core, 16GB RAM, SSD ZFS install.
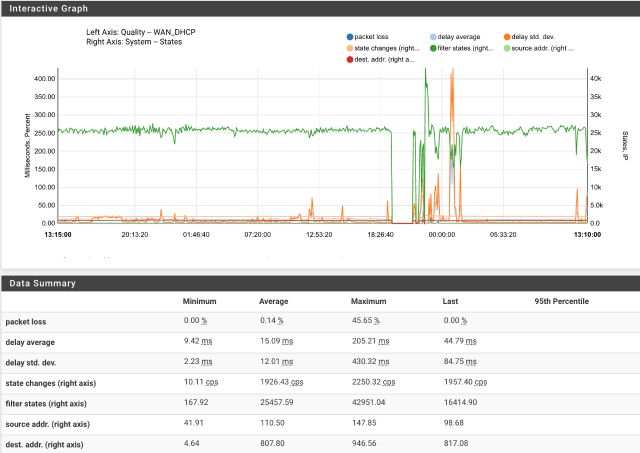
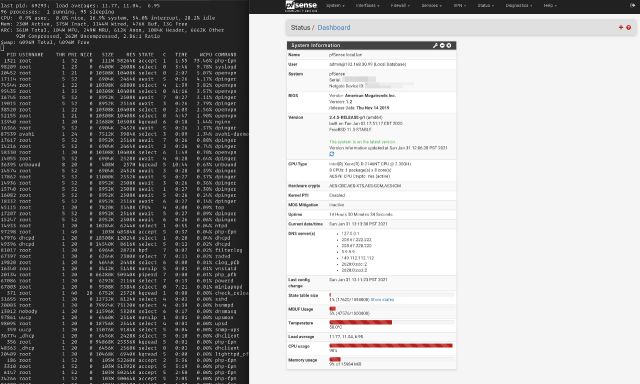
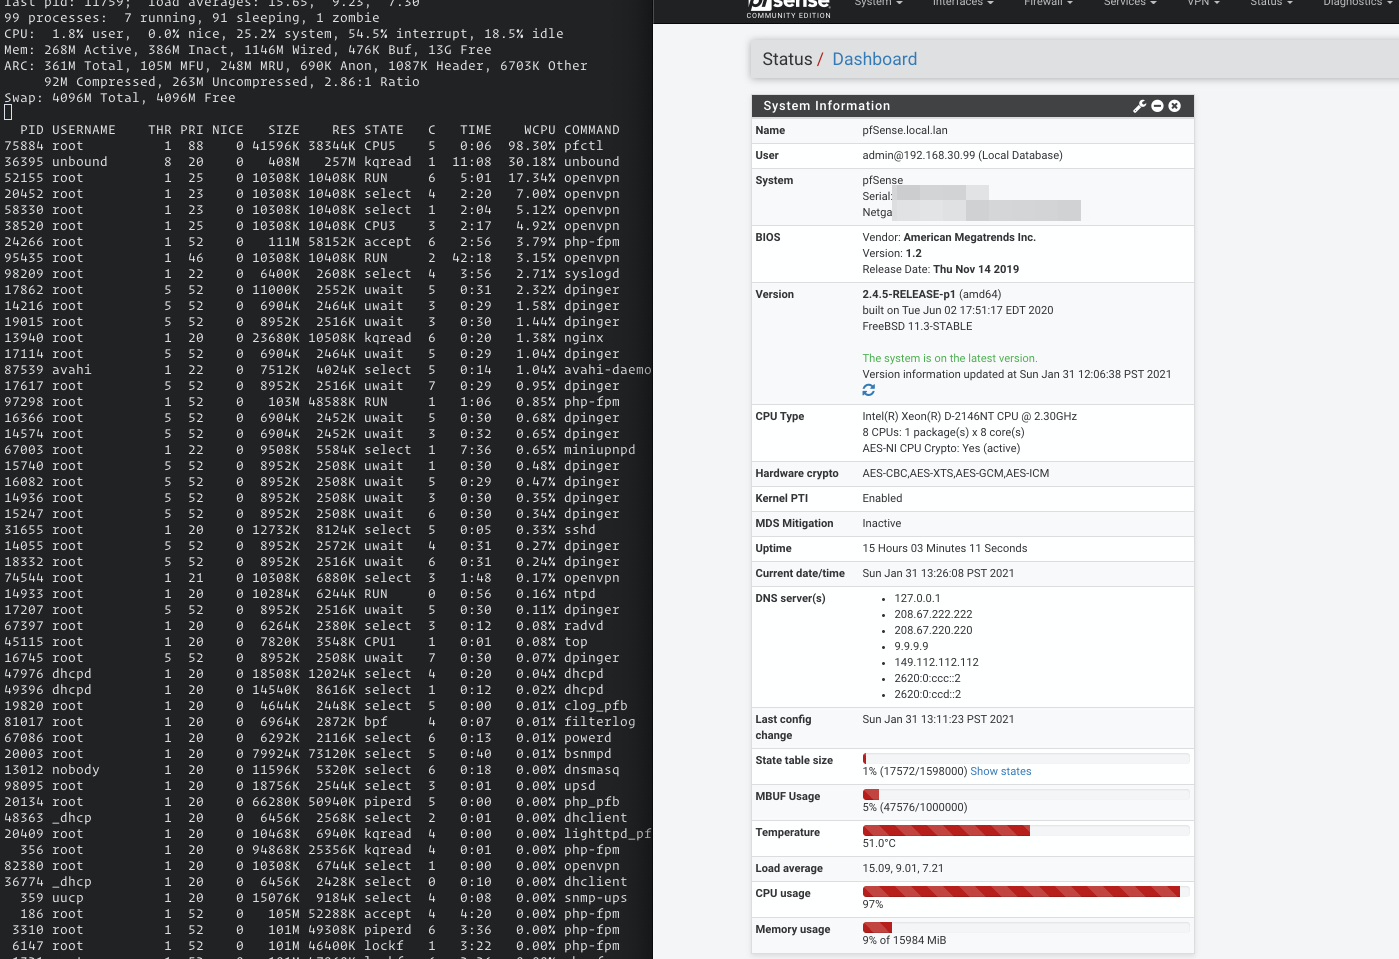
Status page has all widgets disabled other than the System Information panel.Note load average in CPU usage is 10+
The high latency issue is visible on the monitoring tool and coincides with viewing the monitoring or status dashboard page. If I view other pages, like firewall rules, the load eventually dissipates.Ive tried a clean install on new SSDs with a restored backup. No difference.
any ideas greatly appreciated, thanks
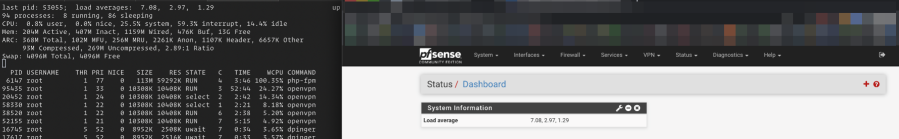
better screen grab, sorry...
-
Hmm, pfctl at 98%....
That looks like the bug we saw in 2.4.5: https://redmine.pfsense.org/issues/10414
But that's fixed in p1. Have you been seeing this for some time?
How large is your ruleset? (/tmp/rules.debug)
Steve
-
@stephenw10 said in High latency when viewing Status Dashboard:
/tmp/rules.debug
Yeah, Ive seen this for a while now, I also had line latency issues caused by the WFH situation too which made clear identification trickier back at the time of the 2.4.5 issues being reported.
 ls -l /tmp/rules.debug
-rw-r--r--  1 root  wheel  126385 Jan 31 13:28 /tmp/rules.debug
Do you know what the fixes were so i can review? any commit links or tips to search?
-
@q54e3w said in High latency when viewing Status Dashboard:
126385
That pretty big.
Something between 10 and 20 Kbytes is what I have. -
@gertjan Thanks for that, its useful context.
I'll review but the lists but at first glance they look sensible given this box is running edge duties for dual WAN connections (1gig + 4G failover), 6 OpenVPN connections, 1 inbound VPN, ~15 VLANs across IPv4 and V6.
pfBlocker is used to handle a number of policy routing aliases via IP.How does this compare to your setup given the discrepancy in size?
I could likely optimize some, maybe 20% but would that help? What exactly is php doing on a limited status page to cause such a heavy load on such an over-spec'd processor - mining BTC!? :)EDIT: For context, when not viewing the pfSense status page, this is the CPU loading with this ruleset etc.
CPU: 0.4% user, 0.0% nice, 1.2% system, 0.8% interrupt, 97.6% idle -
You only have the system information widget on the dashboard?
I could only imagine reading the state table usage using pfctl there. But that looks to be shown correctly anyway.
Try going to Status > Filter Reload and manually reloading the ruleset. Does that also trigger it?
You might try running:
ps auxwwd
That might show you what actual pfctl command is running.Steve
-
@stephenw10 literally only the System Information. I even turned off the CPU and state parts to see if that helped...
Reseting states doesnt cause the CPU spike. CPU load trundles along at 0.5-0.7.
ps auxwwd shows this under normal conditions
USER      PID  %CPU %MEM    VSZ    RSS TT  STAT STARTED       TIME COMMAND
root        0   0.0  0.0      0   6672  -  DLs  22:23     14:17.62 [kernel]
root       11 798.1  0.0      0    128  -  RNL  22:23   9047:03.97 - [idle]
root       12   2.2  0.0      0   1840  -  WL   22:23    426:34.59 - [intr]
root        1   0.0  0.0   5012    804  -  ILs  22:23      0:00.16 - /sbin/init --
root    95435   3.2  0.1  10308  10408  -  Ss   23:39     53:23.51 |-- /usr/local/sbin/openvpn --config /var/etc/openvpn/client3.conf
unbound 74816   0.1  1.5 405684 253108  -  Ss   16:24      2:14.87 |-- /usr/local/sbin/unbound -c /var/unbound/unbound.conf
root      356   0.0  0.2  94868  25356  -  Ss   22:23      0:01.51 |-- php-fpm: master process (/usr/local/lib/php-fpm.conf) (php-fpm)
root     1321   0.0  0.3 107996  52148  -  I    01:10      3:04.51 | |-- php-fpm: pool nginx (php-fpm)
root     6147   0.0  0.3 105948  50644  -  I    01:03      4:04.02 | |-- php-fpm: pool nginx (php-fpm)
root    24266   0.0  0.3 103900  47836  -  I    01:36      3:31.99 | |-- php-fpm: pool nginx (php-fpm)
root    40788   0.0  0.3 103448  44292  -  I    18:50      0:01.71 | |-- php-fpm: pool nginx (php-fpm)
root    41511   0.0  0.5 140700  84748  -  I    13:23      1:45.45 | |-- php-fpm: pool nginx (php-fpm)
root    91299   0.0  0.3 107996  52156  -  I    12:07      1:48.93 | |-- php-fpm: pool nginx (php-fpm)
root    97298   0.0  0.3 103900  46628  -  I    13:03      1:31.73 | `-- php-fpm: pool nginx (php-fpm)
uucp      359   0.0  0.1  15076   9184  -  Ss   12:31      0:12.18 |-- /usr/local/libexec/nut/snmp-ups -a UPS
everything below this is 0.0% CPU... let me know if you like a more comprehensive dump, I can upload to pastebin or something.
and this is when looking at the super minimal dashboard
USER PID %CPU %MEM VSZ RSS TT STAT STARTED TIME COMMAND root 0 0.0 0.0 0 6672 - DLs 22:23 14:18.41 [kernel] root 11 398.7 0.0 0 128 - RNL 22:23 9057:52.01 - [idle] root 12 248.5 0.0 0 1840 - WL 22:23 427:47.18 - [intr] root 25 9.2 0.0 0 16 - DL 22:23 7:32.90 - [pf purge] root 1 0.0 0.0 5012 804 - ILs 22:23 0:00.16 - /sbin/init -- root 95435 18.4 0.1 10308 10408 - Ls 23:39 53:30.70 |-- /usr/local/sbin/openvpn --config /var/etc/openvpn/client3.conf root 74544 7.7 0.0 10308 6888 - Rs 23:39 2:12.27 |-- /usr/local/sbin/openvpn --config /var/etc/openvpn/client7.conf root 20452 6.9 0.1 10308 10408 - Rs 23:39 2:54.82 |-- /usr/local/sbin/openvpn --config /var/etc/openvpn/client1.conf root 58330 5.3 0.1 10308 10408 - Ls 23:39 2:31.27 |-- /usr/local/sbin/openvpn --config /var/etc/openvpn/client2.conf root 38520 3.7 0.1 10308 10408 - Ss 23:39 2:47.45 |-- /usr/local/sbin/openvpn --config /var/etc/openvpn/client5.conf root 52155 3.4 0.1 10308 10408 - Ss 22:23 5:23.02 |-- /usr/local/sbin/openvpn --config /var/etc/openvpn/client6.conf avahi 87539 2.5 0.0 7512 4076 - S 12:31 0:32.54 |-- avahi-daemon: running [pfSense.local] (avahi-daemon) root 98209 2.0 0.0 6400 2608 - Ss 22:25 4:11.13 |-- /usr/sbin/syslogd -s -c -c -l /var/dhcpd/var/run/log -P /var/run/syslog.pid -f /etc/syslog.conf -b 192.168.10.1 root 87740 0.0 0.0 6976 2584 - Is 22:25 0:00.00 | `-- /bin/sh /usr/local/sbin/sshguard -i /var/run/sshguard.pid root 87967 0.0 0.0 6196 2000 - I 22:25 0:00.00 | |-- /bin/cat root 88223 0.0 0.0 12016 5184 - IC 22:25 0:00.00 | |-- /usr/local/libexec/sshg-parser root 88362 0.0 0.0 6532 2492 - IC 22:25 0:00.04 | |-- /usr/local/libexec/sshg-blocker root 88449 0.0 0.0 6976 2584 - I 22:25 0:00.00 | `-- /bin/sh /usr/local/sbin/sshguard -i /var/run/sshguard.pid root 88460 0.0 0.0 6976 2564 - I 22:25 0:00.00 | `-- /bin/sh /usr/local/libexec/sshg-fw-pf -
Hmmm.
You have 7 OpenVPN clients on there? All to different servers? Different gateways?Not that that should make any difference to how the dash is displayed unless you had the gateways widget up.
Steve
-
@stephenw10 yes, 6 out, 1 in. Different servers, different gateways.
-
@q54e3w Found the issue, adding details here for anyone else who stumbles into this.
Uninstalling all packages highlighted the issue was only present with pfBlocker installed, and only when displaying the dashboard regardless of the widget was displayed or not.
Worked with @BBcan177 who identified one function call used to determine the amount of rule matches
pfSense_get_pf_rules()was responsible for the increased CPU utilization.This is the same function used when loading the firewall rules but due to the combination of the number of rules I have and the frequency of the pfBlocker calls, the CPU was becoming heavily loaded over a prolonged period of time causing increased latency with regards packet processing.
@BBcan177 now has some backlog items to hopefully incorporate in a future version of pfBlocker that will enable the refresh timing to be adjusted for edge cases like this.
I'll be working on optimizing my tables too.
thanks to everyone for your support in identifying root cause and possible solutions.
-
Nice catch. Thanks for digging.