• Categories
  • Recent
  • Tags
  • Popular
  • Users
  • Search
  • Register
  • Login
Netgate Discussion Forum
  • Categories
  • Recent
  • Tags
  • Popular
  • Users
  • Search
  • Register
  • Login

SOLVED: RRD Summary no data

pfSense Packages
3
17
1.9k
Loading More Posts
  • Oldest to Newest
  • Newest to Oldest
  • Most Votes
Reply
  • Reply as topic
Log in to reply
This topic has been deleted. Only users with topic management privileges can see it.
  • R
    revengineer
    last edited by revengineer Feb 22, 2021, 12:01 PM Feb 19, 2021, 12:50 PM

    Yesterday, I had to to reinstall pfsense 2.4.5p1 after a misconfigured package gobbled up my RAM and swap and denied me command line access to the firewall. The reinstall was smooth and I restored a recent config without rrd data. I now notice that the RRD Summary package does not show any data after 24 hours. The data are being collected in /var/db/rrd and Status->Monitoring works just fine. Any suggestion on debugging this are appreciated.

    P 1 Reply Last reply Feb 19, 2021, 1:08 PM Reply Quote 0
    • P
      provels @revengineer
      last edited by provels Feb 19, 2021, 1:16 PM Feb 19, 2021, 1:08 PM

      @revengineer
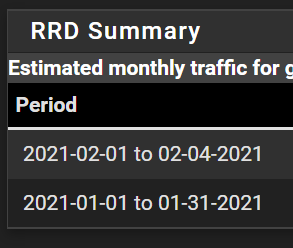
      Though I have upgraded to 2.5, mine appears similar. Last data available is from Feb 4, 2021, long before the upgrade.
      login-to-view

      Peder

      MAIN - pfSense+ 24.11-RELEASE - Adlink MXE-5401, i7, 16 GB RAM, 64 GB SSD. 500 GB HDD for SyslogNG
      BACKUP - pfSense+ 23.01-RELEASE - Hyper-V Virtual Machine, Gen 1, 2 v-CPUs, 3 GB RAM, 8GB VHDX (Dynamic)

      M 1 Reply Last reply Feb 19, 2021, 1:11 PM Reply Quote 0
      • M
        mcury @provels
        last edited by Feb 19, 2021, 1:11 PM

        hm, me too..

        login-to-view

        dead on arrival, nowhere to be found.

        R 1 Reply Last reply Feb 19, 2021, 1:15 PM Reply Quote 0
        • R
          revengineer @mcury
          last edited by Feb 19, 2021, 1:15 PM

          @mcury Different issue. As I stated, Status -> Monitoring works fine for me. Also RRD Summary worked fine for years until I reinstalled pfSense. I wonder if there is a longer delay for showing these data.

          M 1 Reply Last reply Feb 19, 2021, 1:17 PM Reply Quote 0
          • M
            mcury @revengineer
            last edited by Feb 19, 2021, 1:17 PM

            Hm, ok, so yours is working. Thought that this could be related.
            Somehow I didn't read your last sentence.. 😪

            dead on arrival, nowhere to be found.

            1 Reply Last reply Reply Quote 0
            • P
              provels
              last edited by Feb 19, 2021, 1:29 PM

              It wasn't that long ago that I logged in one morning and found many package updates. It was mentioned in the forum that they were all changes to the copyright date (to 2021). Maybe a bit got flipped in one of the files by accident.

              Peder

              MAIN - pfSense+ 24.11-RELEASE - Adlink MXE-5401, i7, 16 GB RAM, 64 GB SSD. 500 GB HDD for SyslogNG
              BACKUP - pfSense+ 23.01-RELEASE - Hyper-V Virtual Machine, Gen 1, 2 v-CPUs, 3 GB RAM, 8GB VHDX (Dynamic)

              1 Reply Last reply Reply Quote 0
              • R
                revengineer
                last edited by Feb 19, 2021, 8:09 PM

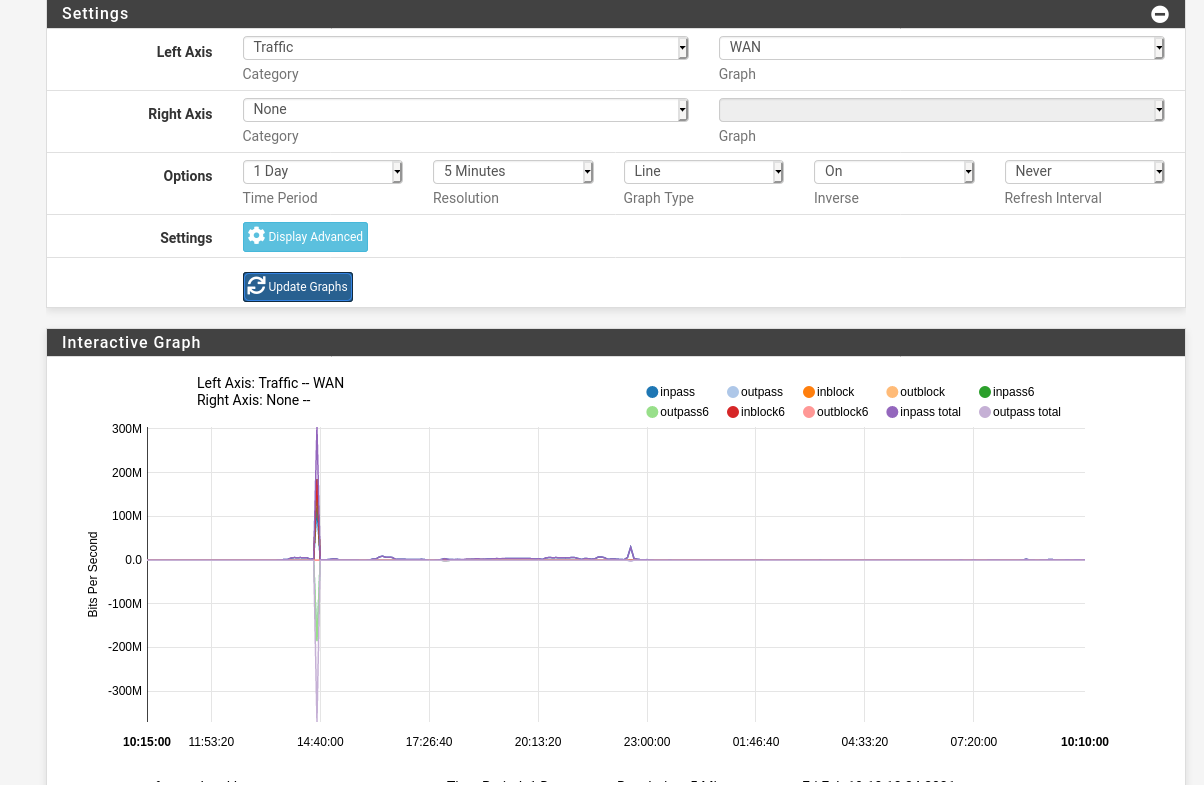
                It looks like internally the package calls the following command:

                /usr/local/www: /usr/local/bin/rrdtool fetch /var/db/rrd/wan-traffic.rrd AVERAGE -r 86400 -s "-10y" -e "now"
                

                When I try this, rrdtool returns only NaN values. This is probably the reason why no data volume is computed, but I do not know why. Can anyone help please?

                1 Reply Last reply Reply Quote 1
                • R
                  revengineer
                  last edited by Feb 19, 2021, 10:40 PM

                  In the hope that more information gets me help more easily, I executed

                  /usr/local/bin/rrdtool fetch /var/db/rrd/wan-traffic.rrd AVERAGE
                  

                  and received output for which I quote the last lines

                  1613772600: 1.3646379099e+05 5.7481135709e+04 5.7216924221e+00 0.0000000000e+00 1.5730765902e+02 9.7310434200e+01 0.0000000000e+00 0.0000000000e+00
                  1613772900: 1.5116187882e+05 6.8574966610e+04 3.8839421687e+00 0.0000000000e+00 1.5501688318e+02 9.8565552669e+01 0.0000000000e+00 0.0000000000e+00
                  1613773200: 1.5405152539e+05 7.5725091376e+04 4.0019769258e+00 0.0000000000e+00 1.5607176509e+02 1.0358066293e+02 0.0000000000e+00 0.0000000000e+00
                  1613773500: 1.5547710473e+05 6.9155025249e+04 4.2005742927e+00 0.0000000000e+00 1.5849807109e+02 9.9167189375e+01 0.0000000000e+00 0.0000000000e+00
                  1613773800: 1.4151034408e+05 7.4455662832e+04 3.2474559102e+00 0.0000000000e+00 1.5705651832e+02 9.6890492152e+01 0.0000000000e+00 0.0000000000e+00
                  1613774100: 1.1448716869e+05 4.6787000653e+04 4.6060697416e+00 0.0000000000e+00 1.5694534762e+02 9.7079563816e+01 0.0000000000e+00 0.0000000000e+00
                  1613774400: nan nan nan nan nan nan nan nan
                  

                  The first value is advancing and seems to be the time. I find that the entries with the most recent time tag are always NaN, and this seems to cause the issue. The values get filled in with the next time step, so this seems to be a synchronization issue. Any advice?

                  P 1 Reply Last reply Feb 20, 2021, 9:14 AM Reply Quote 0
                  • P
                    provels @revengineer
                    last edited by Feb 20, 2021, 9:14 AM

                    @revengineer
                    I guess this is magic? I have no idea what I did.

                    login-to-view

                    Peder

                    MAIN - pfSense+ 24.11-RELEASE - Adlink MXE-5401, i7, 16 GB RAM, 64 GB SSD. 500 GB HDD for SyslogNG
                    BACKUP - pfSense+ 23.01-RELEASE - Hyper-V Virtual Machine, Gen 1, 2 v-CPUs, 3 GB RAM, 8GB VHDX (Dynamic)

                    R 1 Reply Last reply Feb 20, 2021, 1:06 PM Reply Quote 0
                    • R
                      revengineer @provels
                      last edited by Feb 20, 2021, 1:06 PM

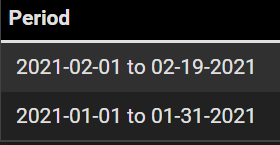
                      @provels Lucky duck! I am glad it's working for you.

                      I am wondering if I do not have enough data yet. The NaN's rrdtool is returning for me indicate unknown data when averaged at the day level. I am inclined to just let it sit for a few days or even a month. rrdtool is clearly working and so was the package prior to reinstall.

                      P 1 Reply Last reply Feb 20, 2021, 2:52 PM Reply Quote 0
                      • P
                        provels @revengineer
                        last edited by provels Feb 20, 2021, 3:47 PM Feb 20, 2021, 2:52 PM

                        @revengineer
                        I did reinstall the RRD package yesterday (no uninstall). Maybe that did it. But I'm sure the data had been missing for some time. I messed with the command line you posted yesterday (-1y, -1d, -1h, etc.) but I didn't understand the data returned. The 86400 is the number of minutes in 2 days, but I don't know the significance in the CL. Where did you find the command? Going to read up some here: man rrdtool
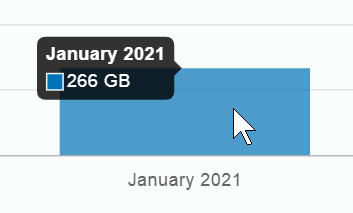
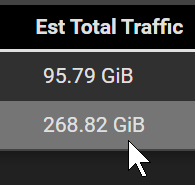
                        Have to admit, when it's working it's quite accurate. Stats from Comcast and pfSense below.
                        login-to-view

                        login-to-view

                        Peder

                        MAIN - pfSense+ 24.11-RELEASE - Adlink MXE-5401, i7, 16 GB RAM, 64 GB SSD. 500 GB HDD for SyslogNG
                        BACKUP - pfSense+ 23.01-RELEASE - Hyper-V Virtual Machine, Gen 1, 2 v-CPUs, 3 GB RAM, 8GB VHDX (Dynamic)

                        1 Reply Last reply Reply Quote 0
                        • R
                          revengineer
                          last edited by Feb 20, 2021, 7:31 PM

                          I tried re-installing yesterday as well as deleting the RRD data, neither helped. I really think I just need to give it more time to accumulate data.

                          The rrdtool call is in the php code for the web page. This is stored in /usr/local/www/status_rrd_summary.php. There are multiple calls because rrd tool is finicky about the phasing of the resolution wrt the start and end time. The command I listed is the first call which seems to just get an inventory of the data. The 86400 is the number of seconds in a day, so it is requesting daily averages. The are subsequent computations to set the boundaries correctly for the computation.

                          I too found that the calculations of the RRD Summary package match the numbers predicted by my internet provider within a few percent.

                          P 2 Replies Last reply Feb 20, 2021, 7:38 PM Reply Quote 1
                          • P
                            provels @revengineer
                            last edited by Feb 20, 2021, 7:38 PM

                            @revengineer
                            Only other thing I can think of is making sure you're on the right upgrade repository, but I don't think the package has been modified for years so probably doesn't matter.

                            Peder

                            MAIN - pfSense+ 24.11-RELEASE - Adlink MXE-5401, i7, 16 GB RAM, 64 GB SSD. 500 GB HDD for SyslogNG
                            BACKUP - pfSense+ 23.01-RELEASE - Hyper-V Virtual Machine, Gen 1, 2 v-CPUs, 3 GB RAM, 8GB VHDX (Dynamic)

                            1 Reply Last reply Reply Quote 0
                            • P
                              provels @revengineer
                              last edited by Feb 20, 2021, 9:09 PM

                              @revengineer
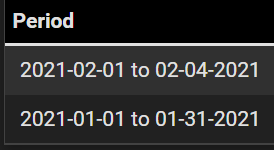
                              PS - I guess even though it's started recording data again, all the data between when in broke on 2/4 and started again yesterday was not logged. I only show 95 GB for this month where my provider shows 440 GB. Post back again if you start getting data.

                              Peder

                              MAIN - pfSense+ 24.11-RELEASE - Adlink MXE-5401, i7, 16 GB RAM, 64 GB SSD. 500 GB HDD for SyslogNG
                              BACKUP - pfSense+ 23.01-RELEASE - Hyper-V Virtual Machine, Gen 1, 2 v-CPUs, 3 GB RAM, 8GB VHDX (Dynamic)

                              1 Reply Last reply Reply Quote 0
                              • R
                                revengineer
                                last edited by Feb 22, 2021, 12:00 PM

                                As suspected, 3 days later, the first data have shown up now. So it really just needed more data to start working. Nothing broken here.

                                P 1 Reply Last reply Feb 25, 2021, 9:09 AM Reply Quote 1
                                • P
                                  provels @revengineer
                                  last edited by provels Feb 25, 2021, 9:11 AM Feb 25, 2021, 9:09 AM

                                  @revengineer
                                  Oddly, my RRD has reverted to the data ending 2/4 as before. Reinstalled, un/reinstalled, no better. Go figure. Probably should start another thread.
                                  login-to-view
                                  login-to-view

                                  Peder

                                  MAIN - pfSense+ 24.11-RELEASE - Adlink MXE-5401, i7, 16 GB RAM, 64 GB SSD. 500 GB HDD for SyslogNG
                                  BACKUP - pfSense+ 23.01-RELEASE - Hyper-V Virtual Machine, Gen 1, 2 v-CPUs, 3 GB RAM, 8GB VHDX (Dynamic)

                                  R 1 Reply Last reply Feb 25, 2021, 12:15 PM Reply Quote 0
                                  • R
                                    revengineer @provels
                                    last edited by revengineer Feb 25, 2021, 12:16 PM Feb 25, 2021, 12:15 PM

                                    @provels New thread may be appropriate as I marked this one as solved.

                                    Check if your Status -> Monitoring is working and showing current data. This runs off the same dataset.

                                    Other than that you can use the rrdtool command above to check that the database is filling. There is a task associated with filling the database; make sure this is running. During debugging you can turn unix time into date/time format using "date -r" function.

                                    If nothing works you can try deleting the database and start over. Maybe it is corrupted.

                                    Good luck.

                                    1 Reply Last reply Reply Quote 1
                                    8 out of 17
                                    • First post
                                      8/17
                                      Last post
                                    Copyright 2025 Rubicon Communications LLC (Netgate). All rights reserved.