Grafana Dashboard using Telegraf with additional plugins
-
Should that be ok so?
#!/bin/sh /usr/local/sbin/unbound-control -c /var/unbound/unbound.conf $* | grep -vE 'thread[0-9]+' unbound-control -c /var/unbound/unbound.conf stats_noreset | grep total.num -
@erbalo That server ip and port should be fine.
-
@erbalo said in Grafana Dashboard using Telegraf with additional plugins:
Should that be ok so?
#!/bin/sh
/usr/local/sbin/unbound-control -c /var/unbound/unbound.conf $* | grep -vE 'thread[0-9]+'
unbound-control -c /var/unbound/unbound.conf stats_noreset | grep total.num
When I tried running that command that was originally in there (your top line) it didn't work.
-
@bigjohns97 said in Grafana Dashboard using Telegraf with additional plugins:
@erbalo said in Grafana Dashboard using Telegraf with additional plugins:
Should that be ok so?
#!/bin/sh
/usr/local/sbin/unbound-control -c /var/unbound/unbound.conf $* | grep -vE 'thread[0-9]+'
unbound-control -c /var/unbound/unbound.conf stats_noreset | grep total.num
When I tried running that command that was originally in there (your top line) it didn't work.
Just it should be:
#!/bin/sh
unbound-control -c /var/unbound/unbound.conf stats_noreset | grep total.num
?
-
@erbalo said in Grafana Dashboard using Telegraf with additional plugins:
@bigjohns97 said in Grafana Dashboard using Telegraf with additional plugins:
@erbalo said in Grafana Dashboard using Telegraf with additional plugins:
Should that be ok so?
#!/bin/sh
/usr/local/sbin/unbound-control -c /var/unbound/unbound.conf $* | grep -vE 'thread[0-9]+'
unbound-control -c /var/unbound/unbound.conf stats_noreset | grep total.num
When I tried running that command that was originally in there (your top line) it didn't work.
Just it should be:
#!/bin/sh
unbound-control -c /var/unbound/unbound.conf stats_noreset | grep total.num
?
That is what I am running, correct, and it didn't affect any other metrics.
-
@bigjohns97 said in Grafana Dashboard using Telegraf with additional plugins:
@erbalo said in Grafana Dashboard using Telegraf with additional plugins:
@bigjohns97 said in Grafana Dashboard using Telegraf with additional plugins:
@erbalo said in Grafana Dashboard using Telegraf with additional plugins:
Should that be ok so?
#!/bin/sh
/usr/local/sbin/unbound-control -c /var/unbound/unbound.conf $* | grep -vE 'thread[0-9]+'
unbound-control -c /var/unbound/unbound.conf stats_noreset | grep total.num
When I tried running that command that was originally in there (your top line) it didn't work.
Just it should be:
#!/bin/sh
unbound-control -c /var/unbound/unbound.conf stats_noreset | grep total.num
?
That is what I am running, correct, and it didn't affect any other metrics.
I don't receive any data to grafana, what can be wrong?
-
@erbalo said in Grafana Dashboard using Telegraf with additional plugins:
@bigjohns97 said in Grafana Dashboard using Telegraf with additional plugins:
@erbalo said in Grafana Dashboard using Telegraf with additional plugins:
@bigjohns97 said in Grafana Dashboard using Telegraf with additional plugins:
@erbalo said in Grafana Dashboard using Telegraf with additional plugins:
Should that be ok so?
#!/bin/sh
/usr/local/sbin/unbound-control -c /var/unbound/unbound.conf $* | grep -vE 'thread[0-9]+'
unbound-control -c /var/unbound/unbound.conf stats_noreset | grep total.num
When I tried running that command that was originally in there (your top line) it didn't work.
Just it should be:
#!/bin/sh
unbound-control -c /var/unbound/unbound.conf stats_noreset | grep total.num
?
That is what I am running, correct, and it didn't affect any other metrics.
I don't receive any data to grafana, what can be wrong?
Make sure the data source and table is the same on your side as what I posted.
@erbalo copy the JSON from above again I replaced some of my entries with variables so be more plug and play.
-
@bigjohns97 got it running. But still missing CPU, memory and system load data. What am I missing?
-
@von-papst This is just a single panel, add it to the dashboard being developed in this thread.
-
This post is deleted! -
I think I am late to the party but I am trying to figure some things out. I am running pfsense in a vm on esxi 6.7. I was able to figure out enough to get most of the panels working but I think the scripts arent working. I am not super familiar with FreeBSD so I am finding it difficult to determine how to test run the scripts so that I can remediate. I am pretty sure the scripts arent running because all of the panels aren't populated with data and when I do a show measurements on the DB I get only the entries listed below. Any advice would be appreciated.
cpu
disk
diskio
mem
net
pf
processes
swap
system -
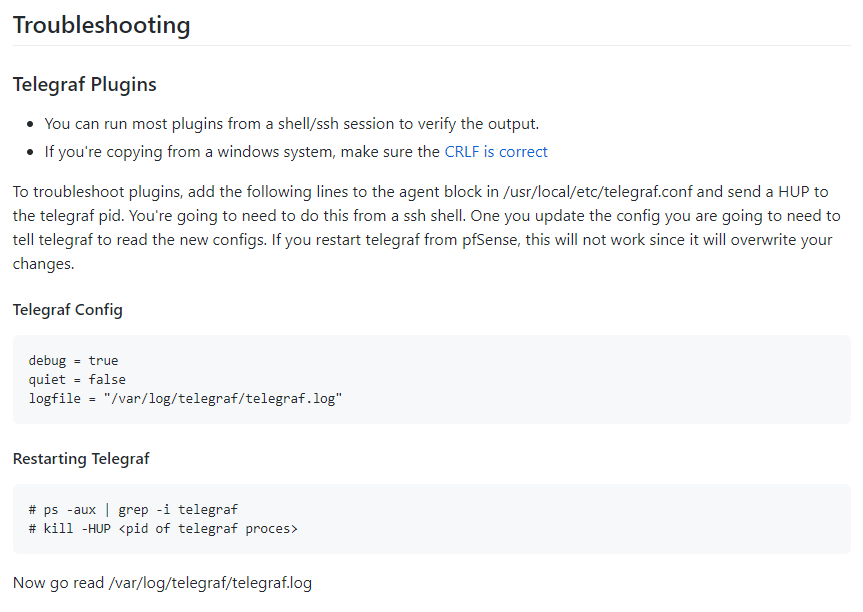
@jpcapone This is the best way to troubleshoot the plugins
Taken from https://github.com/VictorRobellini/pfSense-Dashboard
-
This post is deleted! -
@bigjohns97
Thanks for that. I was able to figure out the issues with the plugins. Now I am just left with what I have pasted below. Can you please advise?2021-02-23T19:01:58Z I! Loaded inputs: cpu disk diskio exec kernel logparser (2x) mem net pf processes swap system
2021-02-23T19:01:58Z I! Loaded aggregators:
2021-02-23T19:01:58Z I! Loaded processors:
2021-02-23T19:01:58Z I! Loaded outputs: influxdb
2021-02-23T19:01:58Z I! Tags enabled: host=xxxxpfSense.xxxxolutions.co
2021-02-23T19:01:58Z I! [agent] Config: Interval:10s, Quiet:false, Hostname:"xxxxpfSense.xxxxolutions.co", Flush Interval:10s
2021-02-23T19:01:58Z D! [agent] Initializing plugins
2021-02-23T19:01:58Z W! [inputs.logparser] The logparser plugin is deprecated; please use the 'tail' input with the 'grok' data_format
2021-02-23T19:01:58Z W! [inputs.logparser] The logparser plugin is deprecated; please use the 'tail' input with the 'grok' data_format
2021-02-23T19:01:58Z D! [agent] Connecting outputs
2021-02-23T19:01:58Z D! [agent] Attempting connection to [outputs.influxdb]
2021-02-23T19:01:58Z D! [agent] Successfully connected to outputs.influxdb
2021-02-23T19:01:58Z D! [agent] Starting service inputs
2021-02-23T19:01:58Z E! [inputs.logparser] Error in plugin: open /var/log/pfblockerng/dnsbl.log: no such file or directory
2021-02-23T19:01:58Z E! [inputs.logparser] Error in plugin: open /var/log/pfblockerng/ip_block.log: no such file or directory
2021-02-23T19:02:00Z E! [inputs.logparser] Error in plugin: open /var/log/pfblockerng/dnsbl.log: no such file or directory
2021-02-23T19:02:00Z E! [inputs.logparser] Error in plugin: open /var/log/pfblockerng/ip_block.log: no such file or directory -
@jpcapone said in Grafana Dashboard using Telegraf with additional plugins:
@bigjohns97
Thanks for that. I was able to figure out the issues with the plugins. Now I am just left with what I have pasted below. Can you please advise?2021-02-23T19:01:58Z I! Loaded inputs: cpu disk diskio exec kernel logparser (2x) mem net pf processes swap system
2021-02-23T19:01:58Z I! Loaded aggregators:
2021-02-23T19:01:58Z I! Loaded processors:
2021-02-23T19:01:58Z I! Loaded outputs: influxdb
2021-02-23T19:01:58Z I! Tags enabled: host=xxxxpfSense.xxxxolutions.co
2021-02-23T19:01:58Z I! [agent] Config: Interval:10s, Quiet:false, Hostname:"xxxxpfSense.xxxxolutions.co", Flush Interval:10s
2021-02-23T19:01:58Z D! [agent] Initializing plugins
2021-02-23T19:01:58Z W! [inputs.logparser] The logparser plugin is deprecated; please use the 'tail' input with the 'grok' data_format
2021-02-23T19:01:58Z W! [inputs.logparser] The logparser plugin is deprecated; please use the 'tail' input with the 'grok' data_format
2021-02-23T19:01:58Z D! [agent] Connecting outputs
2021-02-23T19:01:58Z D! [agent] Attempting connection to [outputs.influxdb]
2021-02-23T19:01:58Z D! [agent] Successfully connected to outputs.influxdb
2021-02-23T19:01:58Z D! [agent] Starting service inputs
2021-02-23T19:01:58Z E! [inputs.logparser] Error in plugin: open /var/log/pfblockerng/dnsbl.log: no such file or directory
2021-02-23T19:01:58Z E! [inputs.logparser] Error in plugin: open /var/log/pfblockerng/ip_block.log: no such file or directory
2021-02-23T19:02:00Z E! [inputs.logparser] Error in plugin: open /var/log/pfblockerng/dnsbl.log: no such file or directory
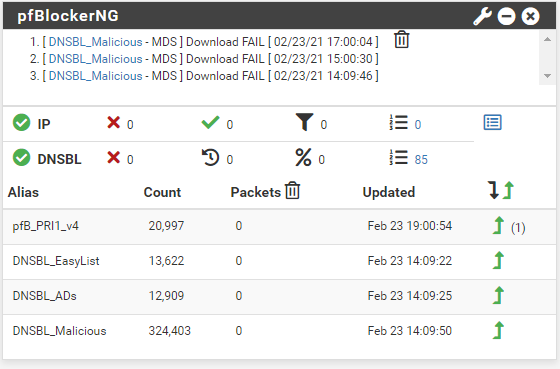
2021-02-23T19:02:00Z E! [inputs.logparser] Error in plugin: open /var/log/pfblockerng/ip_block.log: no such file or directoryLooks like you aren't using pfblockerng is that the case?
Are you now getting data on the influxdb side and in turn on your dashboard?
-
@bigjohns97
yup, I am getting data but I am still not seeing the same measurements in my DB that you see in the in the troubleshooting section. Also, I had to turn on pfblockerng and now but I am still not getting any data from it in grafana. Any suggestions?
-
@bigjohns97 I think I got it. No data was being generated because I wasn't surfing after I set up pfblockerng. I am very new to this as you can tell. Thanks for your help!!!!
-
I've made some updates to the dashboard. I would love feedback.
https://github.com/VictorRobellini/pfSense-Dashboard/commit/520eea4f49b5107cb79e887ec94951c015d52a6e
-
@victorrobellini said in Grafana Dashboard using Telegraf with additional plugins:
I've made some updates to the dashboard. I would love feedback.
https://github.com/VictorRobellini/pfSense-Dashboard/commit/520eea4f49b5107cb79e887ec94951c015d52a6e
You didn't like my unbound cache hit panel above?
-
More updates and bugfixes
telegraf config update required! Please read this in the Readme or things won't work
I updated the parser for the pfBlocker logs. It now uses the non-deprecated tails plugin and also fixes parsing errors that prevented data from being inserted into the influxdb.