Traffic Graph direction labling
-
What is the convention pfSense uses to defining in and out on the interfaces? There seams to be at least an inconsistency between the convention chosen for the graphs and the text display.
-
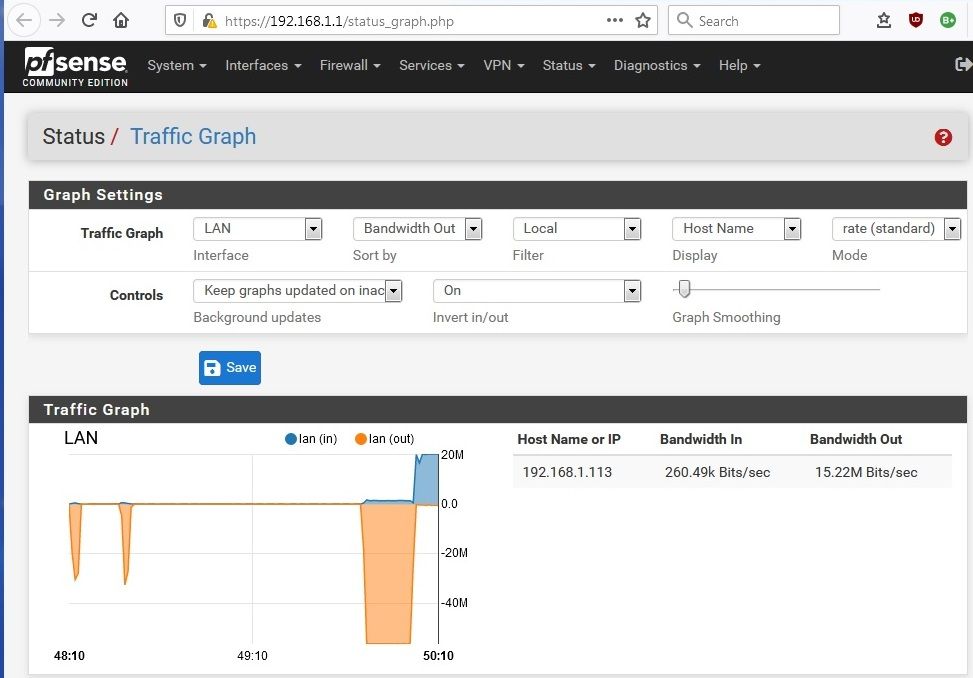
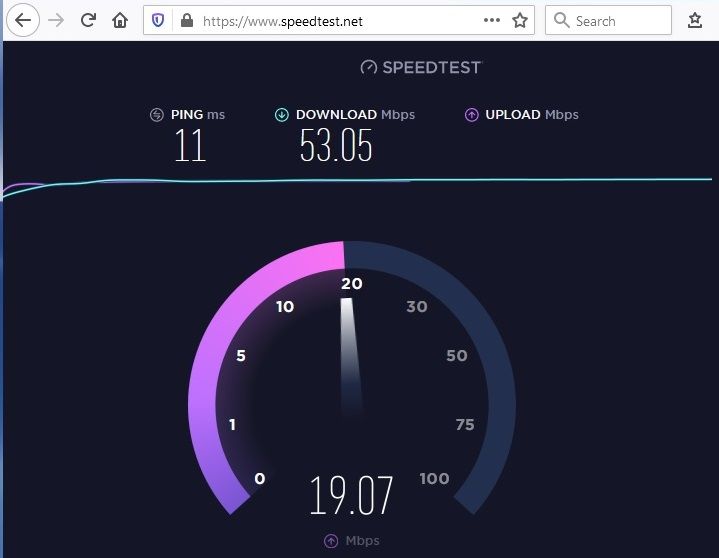
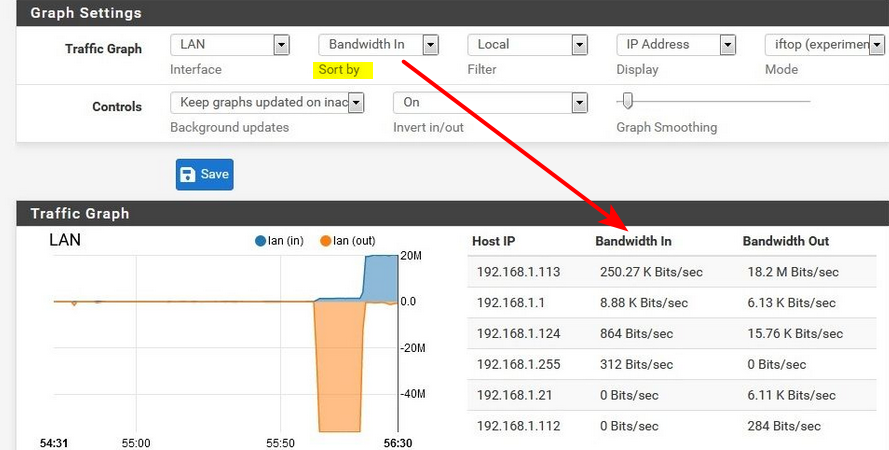
Full screen shot take during upload part of Ookla speed test, then Window for pfSense and Ookla speed test shown separately.
-
pfSense Traffic Graph shows a graph a little under 20M in blue labeled "lan (in)" in the legend. Subsequently moving the mouse over this part of the graph showed about 19.5 M Bits/sec. Mouse over the section of pfSense traffic graph when Ookla was running the download test showed about 53 M Bits/s. Both of these numbers in agreement by that reported by Ookla speedtest.
-
Tabulated devices shows 15.22 M Bits/sec in the "Bandwidth Out" column. The value consistently lower that that shown on the pfSense Traffic Graph and reported by Ookla. A similar ratio occurred during the Ookla speedtest download section of the test.
Is this actually how it is suppose to be? The issues I have trouble understanding are
-
A different convention appears to have been used to define "In" and "Out" in the graphic vs tabulated connections sections of Traffic graph display.
-
The readings displayed in the tabulated connections appear to be a little low.
-
The tabulated values would be easier to read if the update rate on the table was slower in my opinion.
-
-
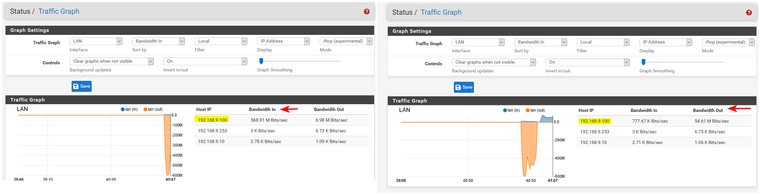
Update
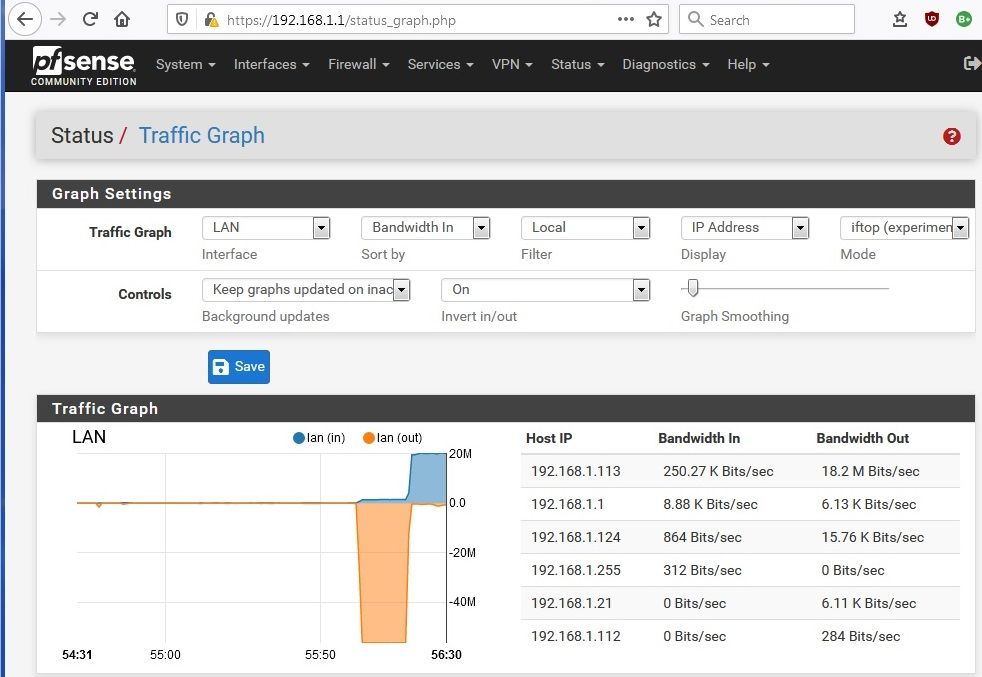
Setting Mode: iftop (experimental)- Results in a very significant improvement for me. Tabulated speeds values seam OK, and display update rate works well for me.
- The only residual issue is understanding how "In" and "Out" are suppose to be defined and labeled. The tabulated connections and the sort order specification, appears to have the opposite definition to that shown on the legend of the graphs.
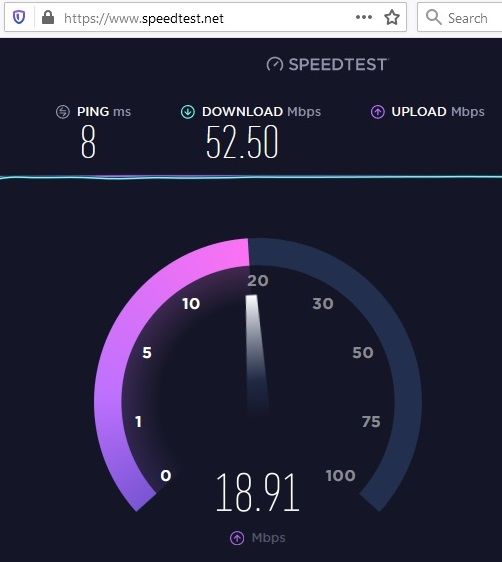
During Ookla download During Ookla upload pfSense Graph mouse over 56.4 20.1 PfSense connection table 52 18.2 Ookla reported average 52.5 18.9 Again Full screen shot take during upload part of Ookla speed test, then Window for pfSense and Ookla speed test shown separately.
-
Your looking on the lan interface - if you want to show it IN to pfsense then look on the WAN..
Your a client, your downloading something - so for pfsense to send you that data it goes "out" the LAN to get to you on the LAN.. Traffic you send TO the internet would be IN to the LAN, out the WAN..
-
-
I agree it is reasonable to use a convention where the definition of traffic "In" and "Out" changes depending on if the traffic is shown at the Wan or Lan interface.
-
What I was questioning is having a screen in pfSense displaying Lan traffic where a different convention / definition is used for the graph vs the table.
Specifically in the above screen during the upload part of the speed test,
-
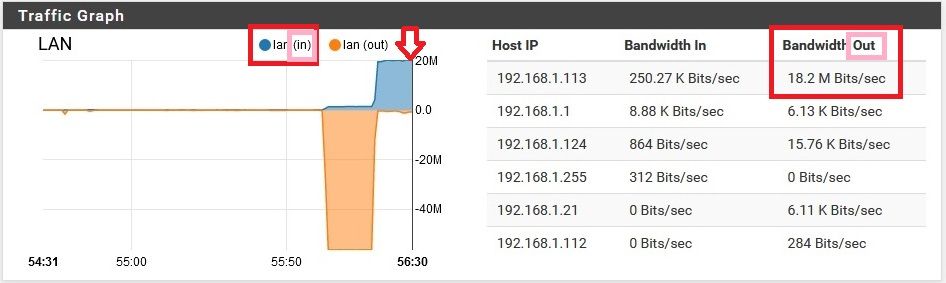
the legend for the graphed data shows a blue dot for "lan (in)".
-
But the host connections show a table has a column labeled "Bandwidth Out" for the same lan traffic.
-
There is also a setting to sort by Bandwidth In or Out. With the current labeling is not obvious to me which direction of lan traffic it would sort by, the graph or tables definition of traffic direction.
Perhaps it is all obvious to everyone else but to me one of the labels must be wrong.
-
-
That has nothing to do with the graph - that has to do with how to sort the IPs in the table.. See how your IP that has the highest bandwidth IN is currently at the top of the list.
See the blue and orange dots on the actual graph.. That is the telling you what is the graph..
Might have been more apparent if on your first pic, you had more than 1 host listed.
How would you sort a graph, you can sort a table ;)
Maybe this show it better
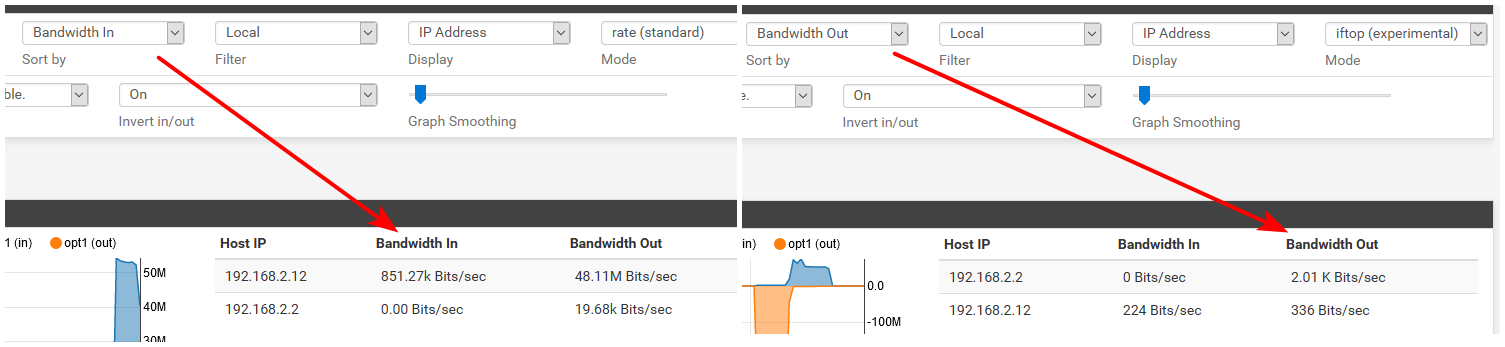
See where table sorted by table with bandwidth in they are in descending order, while your out is not your 0 there is above 6.11 Kbits, etc.. And your 6.13 is above your 15.76 out.. Because the table is sorted by bandwidth in.
-
We continue to agree the sort order is consistent with the definition of in / out used by the table of hosts.
@johnpoz said in Traffic Graph direction labling:
Your a client, your downloading something - so for pfsense to send you that data it goes "out" the LAN to get to you on the LAN.
No problem. That is excellent to know.
I'm very new to pfSense so didn't want to try and dictate which convention was correct / consistent with other parts of pfSense. And I had actually assumed the programmer who wrote the connection table code was different to the programmer who wrote the code for the graph.
But given the convention clearly articulated then:
-
The label of the graph is correct. The Orange graph is maximal during the initial client download part the speed test. Data is going out from pfSense lan port to the client
-
During the second half of the speed test data is flowing in the oposite direct, out from the client in to the pfSense lan port. The blue graph shows this correctly labeled "Lan (in)". However the table of host connects uses a different convention for Lan in / out and labels it "Bandwidth Out", which is inconsistent with the stated convention.
I really don't care from which perspective In / Out is defined. I'm just saying I find it inconsistent to use two different conventions on one screen.
-
-
No that table showing what that client (192.168.1.113) is sending OUT.. That has nothing to do with the interfaces in/out graphic representation..
Your graph is showing pfsense view of the interface - what it sends in and out..
The table is showing what the Client, ie 192.168.1.113 in your pic is getting into it, or out from it..
When your uploading from the client on the lan - that is OUT from the client, IN to pfsense lan interface.
When your downloading from the client, to the client that traffic is IN, and to pfsense it is OUT of its lan interface.
See in my pic, 192.168.1.100 downloading is bw into "that" client.. and out is from that client.
Maybe this helps..
That traffic is the table is from the clients perspective.. What is IN to the client, or OUT from the client.
Here does this help
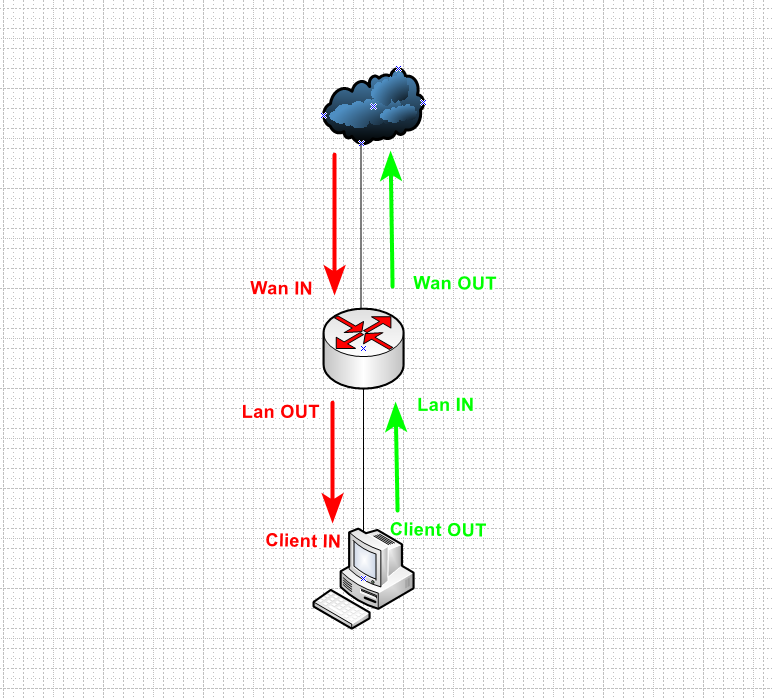
Red is client downloading something from the internet, green is client uploading something to the internet.
If the table listed the clients IP and called that bandwidth in while the client was uploading, and bandwidth out while is was downloading.. That would be confusing as shit.. And wrong.. The graph and that table are showing the bandwidth from 2 different points of view.
If you want the graph and the table to match in direction, then look at the pfsense wan.. Now in/out will be the same as the client in the table.
-
In my opinion the pfSense Traffic graph labeling would be clearer if when displaying the lan traffic it was consistently from the perspective of the firewall or consistently from the perspective of the client. Either convention is defensible, however I'm not convinced using both perspectives for different parts of the page enhances clarity.
-
And how do you do that? Since they are two different things..
Look forward to your PR ;)
Maybe if they changed the label from bandwidth in out, to "to" "from" in the table? Would that clear it up for you? That would be from the perspective of pfsense.