Grafana Dashboard using Telegraf with additional plugins
-
@bigjohns97
yup, I am getting data but I am still not seeing the same measurements in my DB that you see in the in the troubleshooting section. Also, I had to turn on pfblockerng and now but I am still not getting any data from it in grafana. Any suggestions?
-
@bigjohns97 I think I got it. No data was being generated because I wasn't surfing after I set up pfblockerng. I am very new to this as you can tell. Thanks for your help!!!!
-
I've made some updates to the dashboard. I would love feedback.
https://github.com/VictorRobellini/pfSense-Dashboard/commit/520eea4f49b5107cb79e887ec94951c015d52a6e
-
@victorrobellini said in Grafana Dashboard using Telegraf with additional plugins:
I've made some updates to the dashboard. I would love feedback.
https://github.com/VictorRobellini/pfSense-Dashboard/commit/520eea4f49b5107cb79e887ec94951c015d52a6e
You didn't like my unbound cache hit panel above?
-
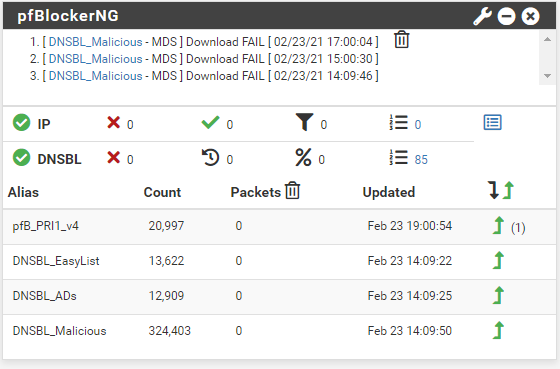
More updates and bugfixes
telegraf config update required! Please read this in the Readme or things won't work
I updated the parser for the pfBlocker logs. It now uses the non-deprecated tails plugin and also fixes parsing errors that prevented data from being inserted into the influxdb.
-
@bigjohns97 said in Grafana Dashboard using Telegraf with additional plugins:
The extra panels are great, but it's not something I use and since I don't know how to properly partition and rollup influx data, I haven't implemented the unbound data. If influx had an automatic rollup like RRD, I would absolutely include it. I'm just being mindful of database growth.
-
I went back to poke around the unbound plugin, it seems to be working fine without the wrapper. I read through the plugin docs to find a use case for collecting the data and showing metrics, but there's just soo much data and I can't think of a use that would justify the additional collection and overhead. Here's your panel in template format and additional telegraf config:
Telegraf config
[[inputs.unbound]]
    server = "127.0.0.1:953"
    binary = "/usr/local/sbin/unbound-control"
    config_file = "/var/unbound/unbound.conf"
    timeout = "1s"
    thread_as_tag = true
Grafana 7 graph
{ "aliasColors": { "Hits": "#629e51", "Misses": "#bf1b00" }, "breakPoint": "50%", "cacheTimeout": null, "combine": { "label": "Others", "threshold": 0 }, "decimals": null, "fieldConfig": { "defaults": { "custom": {} }, "overrides": [] }, "fontSize": "100%", "format": "short", "gridPos": { "h": 5, "w": 5, "x": 0, "y": 1 }, "hideTimeOverride": false, "id": 23763571993, "interval": null, "legend": { "header": "", "percentage": true, "percentageDecimals": 0, "show": true, "sortDesc": true, "values": false }, "legendType": "On graph", "links": [], "maxDataPoints": 3, "nullPointMode": "connected", "pieType": "donut", "pluginVersion": "6.3.3", "strokeWidth": "2", "targets": [ { "alias": "Hits", "groupBy": [], "measurement": "unbound", "orderByTime": "ASC", "policy": "default", "refId": "A", "resultFormat": "time_series", "select": [ [ { "params": [ "total_num_cachehits" ], "type": "field" } ] ], "tags": [ { "key": "host", "operator": "=~", "value": "/^$Host$/" } ] }, { "alias": "Misses", "groupBy": [], "measurement": "unbound", "orderByTime": "ASC", "policy": "default", "refId": "B", "resultFormat": "time_series", "select": [ [ { "params": [ "total_num_cachemiss" ], "type": "field" } ] ], "tags": [ { "key": "host", "operator": "=~", "value": "/^$Host$/" } ] } ], "thresholds": [], "timeFrom": null, "timeShift": null, "title": "DNS Cache Hit/Miss Ratio", "type": "grafana-piechart-panel", "valueName": "current", "datasource": null } -
Here's a plugin - telegraf_unbound_lite.sh - that pulls in just the metrics associated with your graph. It uses the same structure as the unbound plugin but the names use "." rather than "_", other than that, it's a drop-in replacement.
Just add it to the telegraf config under the telegraf_temperature.sh entry.
-
This post is deleted! -
@victorrobellini Any idea why I still have this error when trying to execute the gateways script from the telegraf conf file?
[inputs.exec] Error in plugin: exec: fork/exec /usr/local/bin/gateways.py: no such file or directory for command '/usr/local/bin/gateways.py':
I have checked the permissions on the script file and it's set to 0555, no weird characters in the script and when I run the file from CLI I get proper behavior.
[2.4.5-RELEASE][admin@******]/root: /usr/local/bin/python3.7 /usr/local/bin/gateways.py
gateways,gateway_name=WAN_DHCP rtt=769.0,rttsd=562.0,loss=0i
I'm on pfsense 2.4.5 and latest telegraf, rest of settings in telegraf working fine.
-
@doboy So turns out I had to use the full path + script in telegraf conf file
commands = [ "/usr/local/bin/python3.7 /usr/local/bin/gateways.py" ] -
Thank you, you have created a great addition to pfsense and grafana.
I am trying to create an alert using your dashboard but I cannot find any way to edit a WAN2 panel. Is there a way to copy a panel so I can modify it to add an alert? The specific alert is to notify me if WAN_LTE throughput exceeds some threshold. The other grafana panels (WAN) have an edit and duplicate options but I can't find the option on the second WAN option. Weird right?
Thank you,
Devan
-
@ddbnj said in Grafana Dashboard using Telegraf with additional plugins:
The other grafana panels (WAN) have an edit and duplicate options
My guess is that you are going to have to disable duplicate for the WAN panel. Then make a copy of it and hard code it to "WAN2". An easier option may be to copy it to a new custom dashboard that has only the alerting metrics, otherwise you are going to have to update things in the future if/when I make more changes.
-
@VictorRobellini great dashboard. I have it running with the new influx db.
2 small things. The outbound blocked ip list shows the source ip when perhaps both source and dest ips are relevant?
Do you know how to create a view of inbound blocked traffic grouped by port?
Thanks
-
@wrightsonm said in Grafana Dashboard using Telegraf with additional plugins:
The outbound blocked ip list shows the source ip
On the dashboard, I show I show top 10 blocked IN and Out. For Blocked Out, I show the source because I want to highlight any internal hosts that are making calls to blocked IP addresses.
Do you know how to create a view of inbound blocked traffic grouped by port?
I like the idea. I'll need to make sure dest port is a tag so it's going to require an updated telegraf config and dashboard query. It should be pretty easy.
-
Ah i see tags are imported via grok using the :tag term.
I haven't quite understood when to use a tag or use a field yet.
The sorts of questions that i'd like to be able to answer from a dashboard with regards to blocking are:
- which internal hosts are accessing a blocked resource (already available)
- what is the blocked resource ip and on which port?
- am i seeing a large number of blocks on a particular port i.e. SSH
- are there any trends in the blocked data? common ports, common ips
Questions that I will be looking into answering in the future that will require further data sources are:
- high traffic from a particular ip that is not blocked. i.e. an unblocked ip is making a large number of requests to port 443, or has attempted many login attempts to port 22
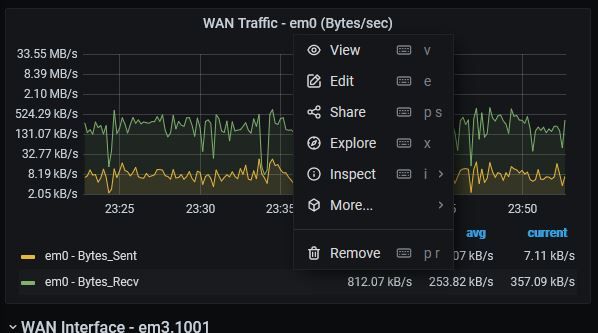
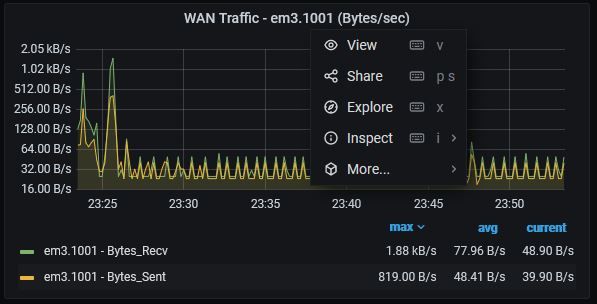
I noticed on my outbound WAN network traffic chart that there was a periodic (1min) burst of traffic. It would have been interesting to be able to see stats on what that traffic was. - i guess I ought to investiage netflow/sflow for this. I later found out that my Google Mini speaker is the root cause of the periodic traffic. I haven't wiresharked the traffic yet to see what it is actually doing. Something for another day...
-
Here are a couple of changes that i've done.
- IP-Top 10 Blocked - OUT
Added the Dest IP to the table
SELECT TOP("count","src_ip",10),dest_ip FROM (SELECT count("action") FROM "autogen"."tail_ip_block_log" WHERE ("host" =~ /^$Host$/ AND "action" = 'block' AND "direction" = 'out') AND $timeFilter GROUP BY "src_ip","dest_ip")
- Changed src_port and dest_port in conf to tags. Copied IP - Top 10 Blocked IN chart and changed the query to:
SELECT TOP("count","dest_port",10) FROM (SELECT count("action") FROM "autogen"."tail_ip_block_log" WHERE ("host" =~ /^$Host$/ AND "action" = 'block' AND "direction" = 'in') AND $timeFilter GROUP BY "dest_port")
Historic data will appear with a null port in this view. new data will show the correct dest port.
-
@wrightsonm
I think ntop or softflowd would probably be a good approach. There are telegraf plugins to capture flow data but building all the graphs and managing the huge volume of data that would fill the influxDB make ntop a much better solution. -
I've spent some time today trying out ntopng. Next week i'll look into integrating it into grafana. Whilst there is an ntopng plugin for grafana, the recommended route appears to use Influxdb.
i.e. https://www.ntop.org/ntop/ntopng-influxdb-and-grafana-a-step-by-step-guide-to-create-dashboards/Another small change i've made to the dashboard is to add data links on urls.
On the IP - Top 10 Blocked - IN view, in the table overrides section, I have added this data link:
Title: Show in GreyNoise
URL: https://viz.greynoise.io/query/?gnql=${__value.raw}
Open In New tab: yes
The result is a link to a page like this:
https://viz.greynoise.io/query/?gnql=125.88.169.233
Summary: Location China, Classification Malicious, Top Tags: SSH Worm. -
I'm running on 1.6.0 and most features of the dashboard work, but strangely, 'Physical address' doesn't pull correctly. On physical interfaces, it just shows 'DOWN'. However, if I explore the InfluxDB in Chronograf, under pfsense.autogen|mac_address I see the correct mac addresses for both of my physical interfaces.
edit
Even directly on the dashboard, if I select 'Interface Summary' | 'Explore' it shows the physical addresses correctly on the table there.