Internet routing stability problems
-
Hi,
For at least the current (v2.5.1-RELEASE amd64) and the previous version (v2.5.0-RELEASE amd64), my pfSense box is occasionally showing stability problems.
Hardware
My pfSense box is a Supermicro SYS-5018A-FTN4 1U Barebone, with an 8-core Intel Atom CPU C2758, 16MiB of RAM and Intel SSD D3-S4610 SSD.
igb0: WAN (connected to cable modem in bridge mode. receives IP via DHCP)
igb1: LAN (connected to main switch, static IP configuration)
igb2: Not used
igb3: Not usedSoftware
pfBlockNG
Couple of ports forwared
Nothing special, I thinkSymptom
Every so-many weeks, no traffic to WAN is routed. Trying to ping 8.8.8.8 on my linux workstation results in 'no route to host'.
Loging into my pfSense box' website still works, but feels 'sluggish'. A tell-tale symptom of this issue is all 8 core thermal sensors indicating around 50.0 °C, while ther are normally around 40.0 °C. No traffic is indicated on the traffic graphs.Work-around
I used to reboot my whole pfSense box, often with a power cycle of the cable modem. I have now reduced this to just releasing and renewing the WAN's DHCP lease. So far, this has restored internet access without exception, and started cooling down the CPU cores.Done so far
I have backed-up my pfSense configuration, replaced both the mainboard with a new identical one, and the SSD with new larger one, performed a clean install and restored the configuration. Unfortunately, this didn't help, though I didn't expect it to.Question
I know this isn't much to go on, so my question is: Next time this occurs, what do I need to check and post here to direct me into the direction of the cause of this problem?Thank you very much in advance for thinking along with me.
-
If you set your pfsense right, you don't need to reboot your pfsense box for years. You could check your system activity, Diagnostics > System activity.
-
@akegec Yeah, I know; I've been running pfSense for almost 5 years now and is has been nothing short of rock-solid. Me rebooting it at the sign of troubles was just born out of laziness.
Thanks for the tip; I've checked out System Activity and it looks like top ouput, so given the symptoms, I guess it is the first place to look first, next time the connection drops.
-
@zak-mckracken Mine was doing the same. Mine was bzip running on the log files, cpus were at 90 some percent and system was very sluggish. I think what I found out in the end was I had made a cron job to run every 5 mins. It was failing and making huge log files.
I fixed the job and think I also turned off a few of the other things it was logging. Then I pressed the reset the log files button.
I have not seen the problem since.So like the others said check the activity and you should see whats going on.
-
@mee114 Did this bzip process start at 3:00 am? I would expect this to hog one core, but I could be wrong here.
When checking Status -> Monitoring, it seems that the system load on my box start at 3:00:
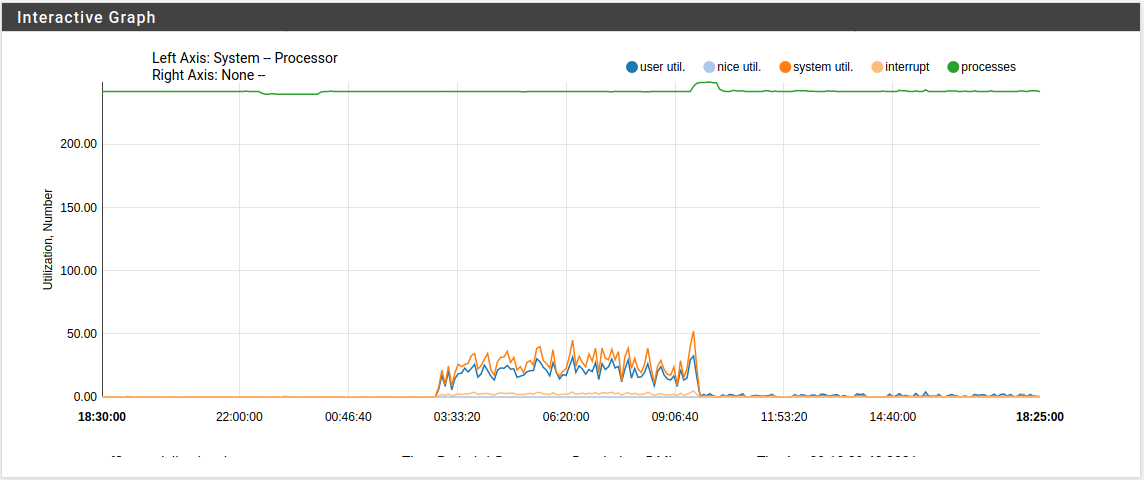
And it ended at 9:50, when I released and renewed my WAN DHCP lease. Come to think of it; All previous times we lost internet in the morning too. The Sonos' chiming instead of playing music in the morning is usually the bad omen.I wonder though why cycling the DHCP lease 'cures' the problem.
-
@zak-mckracken Not sure on the timing. Mine was using all 4 cores. It should be set to use the nice command so it doesn't bring the firewall to a crawl.
-
@akegec It happened again; No internet this morning. CPU load on the main dashboard was moving between 40 and >60%. So it looked up your advice here and checked Diagnostics > System activity. This showed an unusually high CPU load for all 7 unbound processes. So I think I can conclude it's not some kind of mystery log zipping process.
Last time this happened was 16 days ago. This time it didn't start at 3:00am, but at 2:20am. The times are remarkably similar, but too imprecise to be chronically job. Perhaps the trigger of the event occurs a 2:00am, and it takes a variable length of time before it runs out of control.
This time the problem was really stubborn:
- Pulling the antenna cable from the cable modem didn't help. It never did before, but I was just trying to be thorough.
- Releasing the WAN IP address didn't help either. Perhaps it didn't either before, but I never noticed, because:
- Renewing the WAN IP address did help. CPU utilisation dropped, as it did before.
- What was different this time, is that CPU utilisation creeped up again within minutes.
- Even after a couple of release/renew-cycles, the problem kept on coming back.
- Even a reboot didn't help: Within minutes the problem came back. Fortunately, after another release/renew-cycle, CPU utilisation remained low, allowing me to report here.
I'm starting to think it's a matter of chance. November last year, I had a very similar problem, but no matter how often I rebooted it, reverted it back to defaults settings, or even reinstalled PfSense, it never stopped acting up, so I ended up replacing the mainboard (and the SSD, which died during the replacement process). Though this might be an entirely different case.
Below the System Activity before I did anything to the system:
246 threads: 13 running, 207 sleeping, 26 waiting CPU: 0.9% user, 0.0% nice, 1.1% system, 0.1% interrupt, 97.8% idle Mem: 30M Active, 119M Inact, 1055M Wired, 644M Buf, 14G Free Swap: 3656M Total, 3656M Free PID USERNAME PRI NICE SIZE RES STATE C TIME WCPU COMMAND 11 root 155 ki31 0B 128K CPU0 0 694.2H 67.97% [idle{idle: cpu0}] 11 root 155 ki31 0B 128K CPU4 4 697.6H 67.38% [idle{idle: cpu4}] 11 root 155 ki31 0B 128K RUN 5 697.4H 67.09% [idle{idle: cpu5}] 11 root 155 ki31 0B 128K CPU7 7 697.0H 65.87% [idle{idle: cpu7}] 11 root 155 ki31 0B 128K RUN 3 697.6H 65.28% [idle{idle: cpu3}] 11 root 155 ki31 0B 128K CPU2 2 697.7H 64.06% [idle{idle: cpu2}] 11 root 155 ki31 0B 128K RUN 1 696.6H 62.26% [idle{idle: cpu1}] 11 root 155 ki31 0B 128K RUN 6 697.4H 61.87% [idle{idle: cpu6}] 23603 root 52 0 79M 25M select 5 433:55 46.88% /usr/local/libexec/ipsec/charon --use-syslog{charon} 96442 unbound 44 0 112M 55M CPU3 3 176:30 34.18% /usr/local/sbin/unbound -c /var/unbound/unbound.conf{unbound} 96442 unbound 42 0 112M 55M kqread 0 177:47 31.59% /usr/local/sbin/unbound -c /var/unbound/unbound.conf{unbound} 96442 unbound 39 0 112M 55M kqread 5 174:52 27.59% /usr/local/sbin/unbound -c /var/unbound/unbound.conf{unbound} 96442 unbound 36 0 112M 55M kqread 7 175:14 24.27% /usr/local/sbin/unbound -c /var/unbound/unbound.conf{unbound} 96442 unbound 35 0 112M 55M kqread 4 174:18 23.88% /usr/local/sbin/unbound -c /var/unbound/unbound.conf{unbound} 68414 root 34 0 18M 7216K CPU0 0 301:52 21.68% /usr/local/sbin/ntpd -g -c /var/etc/ntpd.conf -p /var/run/ntpd.pid{ntpd} 12 root -72 - 0B 432K CPU4 4 202:33 16.89% [intr{swi1: netisr 6}] 96442 unbound 30 0 112M 55M CPU6 6 172:34 15.97% /usr/local/sbin/unbound -c /var/unbound/unbound.conf{unbound} 40342 _dhcp 27 0 11M 2764K select 2 90:29 14.36% dhclient: igb0 (dhclient) 96442 unbound 25 0 112M 55M kqread 6 169:06 8.89% /usr/local/sbin/unbound -c /var/unbound/unbound.conf{unbound} 23603 root 21 0 79M 25M uwait 1 27:08 2.59% /usr/local/libexec/ipsec/charon --use-syslog{charon} 23603 root 21 0 79M 25M uwait 0 27:10 2.49% /usr/local/libexec/ipsec/charon --use-syslog{charon} 23603 root 21 0 79M 25M uwait 1 27:08 2.49% /usr/local/libexec/ipsec/charon --use-syslog{charon} 23603 root 21 0 79M 25M uwait 7 27:13 2.39% /usr/local/libexec/ipsec/charon --use-syslog{charon} 23603 root 21 0 79M 25M uwait 6 27:17 2.29% /usr/local/libexec/ipsec/charon --use-syslog{charon} 23603 root 21 0 79M 25M uwait 2 27:14 2.29% /usr/local/libexec/ipsec/charon --use-syslog{charon} 23603 root 21 0 79M 25M uwait 7 27:12 2.29% /usr/local/libexec/ipsec/charon --use-syslog{charon} 23603 root 21 0 79M 25M uwait 4 27:05 2.29% /usr/local/libexec/ipsec/charon --use-syslog{charon} 23603 root 21 0 79M 25M uwait 5 27:14 2.20% /usr/local/libexec/ipsec/charon --use-syslog{charon} 23603 root 21 0 79M 25M uwait 6 27:09 2.20% /usr/local/libexec/ipsec/charon --use-syslog{charon} 23603 root 21 0 79M 25M uwait 4 27:09 2.10% /usr/local/libexec/ipsec/charon --use-syslog{charon} 96442 unbound 21 0 112M 55M kqread 0 163:25 1.66% /usr/local/sbin/unbound -c /var/unbound/unbound.conf{unbound} 31622 root 22 0 102M 40M piperd 6 0:20 0.10% php-fpm: pool nginx (php-fpm) 12 root -60 - 0B 432K WAIT 0 271:22 0.00% [intr{swi4: clock (0)+}] 25 root -16 - 0B 16K - 7 66:59 0.00% [rand_harvestq] 8469 root 20 0 17M 3400K nanslp 7 54:00 0.00% /usr/local/sbin/pcscd{pcscd} 0 root -76 - 0B 896K - 7 53:26 0.00% [kernel{if_io_tqg_7}] 0 root -76 - 0B 896K - 0 49:37 0.00% [kernel{if_io_tqg_0}] 0 root -76 - 0B 896K - 5 34:00 0.00% [kernel{if_io_tqg_5}] 65156 root 20 0 29M 9592K kqread 1 32:57 0.00% nginx: worker process (nginx) 0 root -76 - 0B 896K - 6 32:32 0.00% [kernel{if_io_tqg_6}] 0 root -76 - 0B 896K - 1 31:38 0.00% [kernel{if_io_tqg_1}] 24 root -16 - 0B 16K pftm 1 31:38 0.00% [pf purge] 0 root -76 - 0B 896K - 4 29:11 0.00% [kernel{if_io_tqg_4}] 0 root -76 - 0B 896K - 3 25:28 0.00% [kernel{if_io_tqg_3}] 0 root -76 - 0B 896K - 2 25:16 0.00% [kernel{if_io_tqg_2}] 28329 root 20 0 11M 2328K select 4 18:23 0.00% /usr/sbin/powerd -b hadp -a hadp -n hadp 0 root -76 - 0B 896K - 1 18:17 0.00% [kernel{if_config_tqg_0}] 26026 root 52 20 11M 3084K wait 3 11:42 0.00% /bin/sh /var/db/rrd/updaterrd.sh 59398 uucp 20 0 21M 12M select 7 9:20 0.00% /usr/local/libexec/nut/snmp-ups -a AP9618 72848 root 20 0 16M 2852K nanslp 0 8:56 0.00% /usr/local/bin/dpinger -S -r 0 -i WAN_DHCP -B 31.151.179.91 -p /var/run/dpinger_WAN_DHCP~31.151.179.91~31.151.179.1.pid -u /var/run/dpinger_WAN_DHCP~31.151.179.91~31.151.179.1.sock -C /etc/rc.gateway_alarm -d 1 -s 500 -l 2000 -t 60000 -A 1000 -D 500 -L 20 31.151.179.1{dpinger} 72532 root 20 0 16M 2852K nanslp 0 8:46 0.00% /usr/local/bin/dpinger -S -r 0 -i GW_WAN -B 31.151.179.91 -p /var/run/dpinger_GW_WAN~31.151.179.91~10.0.0.1.pid -u /var/run/dpinger_GW_WAN~31.151.179.91~10.0.0.1.sock -C /etc/rc.gateway_alarm -d 1 -s 500 -l 2000 -t 60000 -A 1000 -D 500 -L 20 10.0.0.1{dpinger} 0 root -76 - 0B 896K - 1 7:31 0.00% [kernel{softirq_1}] 0 root -76 - 0B 896K - 5 7:30 0.00% [kernel{softirq_5}] 0 root -76 - 0B 896K - 6 7:28 0.00% [kernel{softirq_6}] 0 root -76 - 0B 896K - 7 7:27 0.00% [kernel{softirq_7}] 0 root -76 - 0B 896K - 2 7:25 0.00% [kernel{softirq_2}] 64956 root 20 0 29M 9576K kqread 1 7:25 0.00% nginx: worker process (nginx) 0 root -76 - 0B 896K - 4 7:25 0.00% [kernel{softirq_4}] 26 root -16 - 0B 48K psleep 6 7:23 0.00% [pagedaemon{dom0}] 0 root -76 - 0B 896K - 3 7:23 0.00% [kernel{softirq_3}] 0 root -76 - 0B 896K - 0 7:22 0.00% [kernel{softirq_0}] 30 root 16 - 0B 16K syncer 7 5:37 0.00% [syncer] 18 root -68 - 0B 160K - 0 4:21 0.00% [usb{usbus1}] 18 root -68 - 0B 160K - 4 3:55 0.00% [usb{usbus0}] 28 root -16 - 0B 144K qsleep 3 3:51 0.00% [bufdaemon{bufdaemon}] 48307 root 20 0 23M 2704K select 7 3:36 0.00% /usr/local/sbin/upsd -u root 536 root 20 0 101M 29M kqread 1 3:28 0.00% php-fpm: master process (/usr/local/lib/php-fpm.conf) (php-fpm) 63649 root 20 0 11M 2768K select 1 3:15 0.00% /usr/sbin/syslogd -s -c -c -l /var/dhcpd/var/run/log -P /var/run/syslog.pid -f /etc/syslog.conf 72532 root 20 0 16M 2852K sbwait 0 3:10 0.00% /usr/local/bin/dpinger -S -r 0 -i GW_WAN -B 31.151.179.91 -p /var/run/dpinger_GW_WAN~31.151.179.91~10.0.0.1.pid -u /var/run/dpinger_GW_WAN~31.151.179.91~10.0.0.1.sock -C /etc/rc.gateway_alarm -d 1 -s 500 -l 2000 -t 60000 -A 1000 -D 500 -L 20 10.0.0.1{dpinger} 16417 root 20 0 12M 3296K bpf 4 3:05 0.00% /usr/local/sbin/filterlog -i pflog0 -p /var/run/filterlog.pid 72848 root 20 0 16M 2852K sbwait 2 2:52 0.00% /usr/local/bin/dpinger -S -r 0 -i WAN_DHCP -B 31.151.179.91 -p /var/run/dpinger_WAN_DHCP~31.151.179.91~31.151.179.1.pid -u /var/run/dpinger_WAN_DHCP~31.151.179.91~31.151.179.1.sock -C /etc/rc.gateway_alarm -d 1 -s 500 -l 2000 -t 60000 -A 1000 -D 500 -L 20 31.151.179.1{dpinger} 44361 uucp 20 0 11M 2776K nanslp 0 2:06 0.00% /usr/local/sbin/upsmon 72532 root 20 0 16M 2852K nanslp 5 1:58 0.00% /usr/local/bin/dpinger -S -r 0 -i GW_WAN -B 31.151.179.91 -p /var/run/dpinger_GW_WAN~31.151.179.91~10.0.0.1.pid -u /var/run/dpinger_GW_WAN~31.151.179.91~10.0.0.1.sock -C /etc/rc.gateway_alarm -d 1 -s 500 -l 2000 -t 60000 -A 1000 -D 500 -L 20 10.0.0.1{dpinger} 8469 root 20 0 17M 3400K select 3 1:57 0.00% /usr/local/sbin/pcscd{pcscd} 72848 root 20 0 16M 2852K nanslp 2 1:54 0.00% /usr/local/bin/dpinger -S -r 0 -i WAN_DHCP -B 31.151.179.91 -p /var/run/dpinger_WAN_DHCP~31.151.179.91~31.151.179.1.pid -u /var/run/dpinger_WAN_DHCP~31.151.179.91~31.151.179.1.sock -C /etc/rc.gateway_alarm -d 1 -s 500 -l 2000 -t 60000 -A 1000 -D 500 -L 20 31.151.179.1{dpinger} 18 root -68 - 0B 160K - 5 1:33 0.00% [usb{usbus1}] 68414 root 20 0 18M 7216K usem 4 1:27 0.00% /usr/local/sbin/ntpd -g -c /var/etc/ntpd.conf -p /var/run/ntpd.pid{ntpd} 28 root 20 - 0B 144K sdflus 7 1:12 0.00% [bufdaemon{/ worker}] 85478 root 52 0 101M 40M accept 6 1:08 0.00% php-fpm: pool nginx (php-fpm) 0 root -16 - 0B 896K swapin 6 1:06 0.00% [kernel{swapper}] 12 root -60 - 0B 432K WAIT 0 0:50 0.00% [intr{swi4: clock (5)}] 12 root -60 - 0B 432K WAIT 4 0:50 0.00% [intr{swi4: clock (4)}] 12 root -60 - 0B 432K WAIT 7 0:50 0.00% [intr{swi4: clock (7)}] 12 root -60 - 0B 432K WAIT 2 0:50 0.00% [intr{swi4: clock (6)}] 12 root -60 - 0B 432K WAIT 6 0:49 0.00% [intr{swi4: clock (2)}] 12 root -60 - 0B 432K WAIT 3 0:49 0.00% [intr{swi4: clock (3)}] 12 root -88 - 0B 432K WAIT 0 0:46 0.00% [intr{irq23: ehci0}] 47891 root 52 0 103M 42M accept 6 0:46 0.00% php-fpm: pool nginx (php-fpm) 12 root -88 - 0B 432K WAIT 2 0:43 0.00% [intr{irq293: ahci0}] 54973 root 52 0 105M 41M accept 4 0:37 0.00% php-fpm: pool nginx (php-fpm){php-fpm} 12 root -60 - 0B 432K WAIT 1 0:37 0.00% [intr{swi4: clock (1)}] 57657 root 52 0 101M 40M accept 4 0:33 0.00% php-fpm: pool nginx (php-fpm) 66579 root 20 0 11M 2736K nanslp 0 0:30 0.00% /usr/sbin/cron -s 29 root -16 - 0B 16K vlruwt 3 0:27 0.00% [vnlru] 26 root -16 - 0B 48K umarcl 7 0:25 0.00% [pagedaemon{uma}] 36161 root 20 0 11M 2548K select 5 0:25 0.00% /usr/local/sbin/radvd -p /var/run/radvd.pid -C /var/etc/radvd.conf -m syslog 28 root -16 - 0B 144K - 7 0:25 0.00% [bufdaemon{bufspacedaemon-6}] 28 root -16 - 0B 144K - 1 0:25 0.00% [bufdaemon{bufspacedaemon-2}] 28 root -16 - 0B 144K - 4 0:25 0.00% [bufdaemon{bufspacedaemon-1}] 28 root -16 - 0B 144K - 5 0:25 0.00% [bufdaemon{bufspacedaemon-4}] 28 root -16 - 0B 144K - 6 0:24 0.00% [bufdaemon{bufspacedaemon-0}] 28 root -16 - 0B 144K - 0 0:24 0.00% [bufdaemon{bufspacedaemon-3}] 28 root -16 - 0B 144K - 4 0:24 0.00% [bufdaemon{bufspacedaemon-5}] 3083 dhcpd 20 0 23M 12M select 1 0:12 0.00% /usr/local/sbin/dhcpd -user dhcpd -group _dhcp -chroot /var/dhcpd -cf /etc/dhcpd.conf -pf /var/run/dhcpd.pid igb1 23603 root 20 0 79M 25M select 3 0:10 0.00% /usr/local/libexec/ipsec/charon --use-syslog{charon} 0 root 8 - 0B 896K - 1 0:07 0.00% [kernel{thread taskq}] 12 root -72 - 0B 432K WAIT 1 0:05 0.00% [intr{swi1: netisr 2}] 8469 root 20 0 17M 3400K select 5 0:04 0.00% /usr/local/sbin/pcscd{pcscd} 71 root -8 - 0B 16K mdwait 0 0:03 0.00% [md0] 72532 root 20 0 16M 2852K accept 0 0:02 0.00% /usr/local/bin/dpinger -S -r 0 -i GW_WAN -B 31.151.179.91 -p /var/run/dpinger_GW_WAN~31.151.179.91~10.0.0.1.pid -u /var/run/dpinger_GW_WAN~31.151.179.91~10.0.0.1.sock -C /etc/rc.gateway_alarm -d 1 -s 500 -l 2000 -t 60000 -A 1000 -D 500 -L 20 10.0.0.1{dpinger} 830 root 20 0 10M 2056K select 1 0:02 0.00% /sbin/devd -q -f /etc/pfSense-devd.conf 72848 root 20 0 16M 2852K accept 4 0:02 0.00% /usr/local/bin/dpinger -S -r 0 -i WAN_DHCP -B 31.151.179.91 -p /var/run/dpinger_WAN_DHCP~31.151.179.91~31.151.179.1.pid -u /var/run/dpinger_WAN_DHCP~31.151.179.91~31.151.179.1.sock -C /etc/rc.gateway_alarm -d 1 -s 500 -l 2000 -t 60000 -A 1000 -D 500 -L 20 31.151.179.1{dpinger} 64459 root 20 0 10M 2264K nanslp 6 0:02 0.00% minicron: helper /usr/local/bin/ping_hosts.sh (minicron) 12 root -72 - 0B 432K WAIT 1 0:02 0.00% [intr{swi1: netisr 4}] 12 root -72 - 0B 432K WAIT 3 0:02 0.00% [intr{swi1: netisr 3}] 12 root -72 - 0B 432K WAIT 5 0:02 0.00% [intr{swi1: netisr 7}] 12 root -72 - 0B 432K WAIT 6 0:02 0.00% [intr{swi1: netisr 0}] 12 root -72 - 0B 432K WAIT 0 0:02 0.00% [intr{swi1: netisr 5}] 12 root -72 - 0B 432K WAIT 6 0:02 0.00% [intr{swi1: netisr 1}] 0 root 8 - 0B 896K - 1 0:01 0.00% [kernel{in6m_free taskq}] 19 root -16 - 0B 16K - 5 0:01 0.00% [soaiod1] 21 root -16 - 0B 16K - 1 0:01 0.00% [soaiod3] 22 root -16 - 0B 16K - 5 0:01 0.00% [soaiod4] 20 root -16 - 0B 16K - 0 0:01 0.00% [soaiod2] 35810 root 4 0 11M 2652K select 2 0:00 0.00% dhclient: igb0 [priv] (dhclient) 12 root -84 - 0B 432K WAIT 4 0:00 0.00% [intr{irq1: atkbd0}] 64984 root 20 0 10M 2268K nanslp 5 0:00 0.00% minicron: helper /usr/local/sbin/fcgicli -f /etc/rc.expireaccounts (minicron) 23603 root 52 0 79M 25M sigwai 7 0:00 0.00% /usr/local/libexec/ipsec/charon --use-syslog{charon} 1 root 39 0 9548K 944K wait 2 0:00 0.00% [init] 0 root -52 - 0B 896K - 7 0:00 0.00% [kernel{mca taskq}] 575 root 40 20 11M 2920K kqread 4 0:00 0.00% /usr/local/sbin/check_reload_status 59786 root 52 0 11M 2952K wait 2 0:00 0.00% login [pam] (login) 14 root -8 - 0B 48K - 2 0:00 0.00% [geom{g_event}] 17 root -16 - 0B 48K - 5 0:00 0.00% [cam{scanner}] 83513 root 23 0 11M 3056K wait 6 0:00 0.00% /bin/sh /usr/local/sbin/sshguard -i /var/run/sshguard.pid 61421 root 52 0 12M 3200K wait 1 0:00 0.00% -sh (sh) 17 root -16 - 0B 48K - 1 0:00 0.00% [cam{doneq0}] 72848 root 52 0 16M 2852K uwait 4 0:00 0.00% /usr/local/bin/dpinger -S -r 0 -i WAN_DHCP -B 31.151.179.91 -p /var/run/dpinger_WAN_DHCP~31.151.179.91~31.151.179.1.pid -u /var/run/dpinger_WAN_DHCP~31.151.179.91~31.151.179.1.sock -C /etc/rc.gateway_alarm -d 1 -s 500 -l 2000 -t 60000 -A 1000 -D 500 -L 20 31.151.179.1{dpinger} 65346 root 20 0 10M 2268K nanslp 6 0:00 0.00% minicron: helper /usr/local/sbin/fcgicli -f /etc/rc.update_alias_url_data (minicron) 34309 root 22 0 13M 3588K CPU1 1 0:00 0.00% /usr/bin/top -baHS 999 18 root -68 - 0B 160K - 4 0:00 0.00% [usb{usbus1}] 14 root -8 - 0B 48K - 5 0:00 0.00% [geom{g_down}] 84276 root 22 0 12M 2752K piperd 4 0:00 0.00% /usr/local/libexec/sshg-blocker{sshg-blocker} 63083 root 52 0 11M 3032K ttyin 2 0:00 0.00% /bin/sh /etc/rc.initial 0 root 8 - 0B 896K - 1 0:00 0.00% [kernel{acpi_task_0}] 59950 root 52 0 11M 2364K ttyin 5 0:00 0.00% /usr/libexec/getty Pc ttyv1 59953 root 52 0 11M 2364K ttyin 0 0:00 0.00% /usr/libexec/getty Pc ttyv2 0 root 8 - 0B 896K - 5 0:00 0.00% [kernel{acpi_task_1}] 60469 root 52 0 11M 2364K ttyin 0 0:00 0.00% /usr/libexec/getty Pc ttyv4 60281 root 52 0 11M 2364K ttyin 3 0:00 0.00% /usr/libexec/getty Pc ttyv3 60944 root 52 0 11M 2364K ttyin 0 0:00 0.00% /usr/libexec/getty Pc ttyv7 60663 root 52 0 11M 2364K ttyin 4 0:00 0.00% /usr/libexec/getty Pc ttyv5 60701 root 52 0 11M 2364K ttyin 1 0:00 0.00% /usr/libexec/getty Pc ttyv6 0 root 8 - 0B 896K - 0 0:00 0.00% [kernel{acpi_task_2}] 84897 root 27 0 11M 3044K piperd 5 0:00 0.00% /bin/sh /usr/local/libexec/sshg-fw-pf 83938 root 20 0 16M 3860K piperd 2 0:00 0.00% /usr/local/libexec/sshg-parser 12 root -72 - 0B 432K WAIT 5 0:00 0.00% [intr{swi1: pf send}] 43889 root 52 0 11M 2764K piperd 3 0:00 0.00% /usr/local/sbin/upsmon 83596 root 20 0 10M 2220K piperd 7 0:00 0.00% /bin/cat 64430 root 52 0 28M 8328K pause 1 0:00 0.00% nginx: master process /usr/local/sbin/nginx -c /var/etc/nginx-webConfigurator.conf (nginx) 14 root -8 - 0B 48K - 0 0:00 0.00% [geom{g_up}] 72532 root 52 0 16M 2852K uwait 3 0:00 0.00% /usr/local/bin/dpinger -S -r 0 -i GW_WAN -B 31.151.179.91 -p /var/run/dpinger_GW_WAN~31.151.179.91~10.0.0.1.pid -u /var/run/dpinger_GW_WAN~31.151.179.91~10.0.0.1.sock -C /etc/rc.gateway_alarm -d 1 -s 500 -l 2000 -t 60000 -A 1000 -D 500 -L 20 10.0.0.1{dpinger} 84276 root 20 0 12M 2752K nanslp 7 0:00 0.00% /usr/local/libexec/sshg-blocker{sshg-blocker} 27760 root 52 20 10M 2204K nanslp 6 0:00 0.00% sleep 60 23603 root 20 0 79M 25M uwait 2 0:00 0.00% /usr/local/libexec/ipsec/charon --use-syslog{charon} 0 root -8 - 0B 896K - 3 0:00 0.00% [kernel{CAM taskq}] 23603 root 20 0 79M 25M uwait 3 0:00 0.00% /usr/local/libexec/ipsec/charon --use-syslog{charon} 64462 root 52 0 10M 2248K wait 4 0:00 0.00% /usr/local/bin/minicron 3600 /var/run/expire_accounts.pid /usr/local/sbin/fcgicli -f /etc/rc.expireaccounts 65054 root 52 0 10M 2248K wait 6 0:00 0.00% /usr/local/bin/minicron 86400 /var/run/update_alias_url_data.pid /usr/local/sbin/fcgicli -f /etc/rc.update_alias_url_data 64304 root 52 0 10M 2244K wait 2 0:00 0.00% /usr/local/bin/minicron 240 /var/run/ping_hosts.pid /usr/local/bin/ping_hosts.sh 23433 root 52 0 10M 2316K piperd 7 0:00 0.00% daemon: /usr/local/libexec/ipsec/charon[23603] (daemon) 23603 root 52 0 79M 25M uwait 1 0:00 0.00% /usr/local/libexec/ipsec/charon --use-syslog{pool-spawner} 577 root 52 20 11M 2748K kqread 6 0:00 0.00% check_reload_status: Monitoring daemon of check_reload_status (check_reload_status) 23603 root 52 0 79M 25M select 6 0:00 0.00% /usr/local/libexec/ipsec/charon --use-syslog{charon} 0 root 8 - 0B 896K - 7 0:00 0.00% [kernel{inm_free taskq}] 23603 root 52 0 79M 25M select 2 0:00 0.00% /usr/local/libexec/ipsec/charon --use-syslog{gmain} 8469 root 20 0 17M 3400K select 4 0:00 0.00% /usr/local/sbin/pcscd{pcscd} 84613 root 23 0 11M 3052K wait 5 0:00 0.00% /bin/sh /usr/local/sbin/sshguard -i /var/run/sshguard.pid 12 root -52 - 0B 432K WAIT 0 0:00 0.00% [intr{swi6: task queue}] 23 root -16 - 0B 16K waitin 5 0:00 0.00% [sctp_iterator] 18 root -76 - 0B 160K - 2 0:00 0.00% [usb{usbus1}] 12 root -52 - 0B 432K WAIT 5 0:00 0.00% [intr{swi6: Giant taskq}] 0 root -20 - 0B 896K - 5 0:00 0.00% [kernel{crypto_4}] 8469 root 52 0 17M 3400K piperd 3 0:00 0.00% /usr/local/sbin/pcscd{pcscd} 31 root -16 - 0B 16K aldslp 3 0:00 0.00% [ALQ Daemon] 0 root 8 - 0B 896K - 4 0:00 0.00% [kernel{firmware taskq}] 13 root -16 - 0B 128K sleep 7 0:00 0.00% [ng_queue{ng_queue0}] 13 root -16 - 0B 128K sleep 7 0:00 0.00% [ng_queue{ng_queue1}] 0 root 8 - 0B 896K - 1 0:00 0.00% [kernel{linuxkpi_short_wq_7}] 26 root -16 - 0B 48K launds 3 0:00 0.00% [pagedaemon{laundry: dom0}] 0 root -20 - 0B 896K - 3 0:00 0.00% [kernel{crypto_2}] 0 root -20 - 0B 896K - 0 0:00 0.00% [kernel{crypto_3}] 18 root -68 - 0B 160K - 1 0:00 0.00% [usb{usbus0}] 0 root 8 - 0B 896K - 5 0:00 0.00% [kernel{aiod_kick taskq}] 15 root -16 - 0B 16K seqsta 4 0:00 0.00% [sequencer 00] 18 root -68 - 0B 160K - 1 0:00 0.00% [usb{usbus0}] 0 root 8 - 0B 896K - 1 0:00 0.00% [kernel{linuxkpi_long_wq_8}] 0 root -20 - 0B 896K - 6 0:00 0.00% [kernel{crypto_5}] 0 root 8 - 0B 896K - 0 0:00 0.00% [kernel{mlx4}] 0 root 8 - 0B 896K - 4 0:00 0.00% [kernel{kqueue_ctx taskq}] 0 root 8 - 0B 896K - 1 0:00 0.00% [kernel{linuxkpi_short_wq_0}] 0 root 8 - 0B 896K - 1 0:00 0.00% [kernel{linuxkpi_long_wq_4}] 27 root -16 - 0B 16K psleep 5 0:00 0.00% [vmdaemon] 10 root -16 - 0B 16K audit_ 1 0:00 0.00% [audit] 0 root -20 - 0B 896K - 7 0:00 0.00% [kernel{crypto_6}] 0 root -20 - 0B 896K - 2 0:00 0.00% [kernel{crypto_7}] 0 root -20 - 0B 896K - 7 0:00 0.00% [kernel{crypto_1}] 0 root 8 - 0B 896K - 1 0:00 0.00% [kernel{linuxkpi_long_wq_1}] 0 root 8 - 0B 896K - 1 0:00 0.00% [kernel{linuxkpi_short_wq_3}] 2 root -16 - 0B 16K crypto 3 0:00 0.00% [crypto] 5 root -16 - 0B 16K crypto 5 0:00 0.00% [crypto returns 2] 0 root -20 - 0B 896K - 4 0:00 0.00% [kernel{crypto_0}] 18 root -72 - 0B 160K - 1 0:00 0.00% [usb{usbus1}] 0 root 8 - 0B 896K - 6 0:00 0.00% [kernel{linuxkpi_long_wq_6}] 0 root 8 - 0B 896K - 5 0:00 0.00% [kernel{linuxkpi_short_wq_1}] 0 root 8 - 0B 896K - 2 0:00 0.00% [kernel{linuxkpi_long_wq_5}] 0 root 8 - 0B 896K - 5 0:00 0.00% [kernel{linuxkpi_long_wq_7}] 0 root 8 - 0B 896K - 6 0:00 0.00% [kernel{linuxkpi_long_wq_2}] 0 root 8 - 0B 896K - 4 0:00 0.00% [kernel{linuxkpi_long_wq_0}] 0 root 8 - 0B 896K - 6 0:00 0.00% [kernel{linuxkpi_short_wq_6}] 13 root -16 - 0B 128K sleep 7 0:00 0.00% [ng_queue{ng_queue6}] 13 root -16 - 0B 128K sleep 7 0:00 0.00% [ng_queue{ng_queue7}] 13 root -16 - 0B 128K sleep 7 0:00 0.00% [ng_queue{ng_queue3}] 13 root -16 - 0B 128K sleep 7 0:00 0.00% [ng_queue{ng_queue4}] 13 root -16 - 0B 128K sleep 7 0:00 0.00% [ng_queue{ng_queue5}] 13 root -16 - 0B 128K sleep 7 0:00 0.00% [ng_queue{ng_queue2}] 17 root -16 - 0B 48K - 4 0:00 0.00% [cam{doneq1}] 3 root -16 - 0B 16K crypto 7 0:00 0.00% [crypto returns 0] 7 root -16 - 0B 16K crypto 4 0:00 0.00% [crypto returns 4] 6 root -16 - 0B 16K crypto 5 0:00 0.00% [crypto returns 3] 9 root -16 - 0B 16K crypto 6 0:00 0.00% [crypto returns 6] 4 root -16 - 0B 16K crypto 7 0:00 0.00% [crypto returns 1] 16 root -16 - 0B 16K crypto 6 0:00 0.00% [crypto returns 7] 8 root -16 - 0B 16K crypto 5 0:00 0.00% [crypto returns 5] 18 root -72 - 0B 160K - 1 0:00 0.00% [usb{usbus0}] 18 root -76 - 0B 160K - 1 0:00 0.00% [usb{usbus0}] 0 root 8 - 0B 896K - 4 0:00 0.00% [kernel{linuxkpi_short_wq_5}] 0 root 8 - 0B 896K - 4 0:00 0.00% [kernel{linuxkpi_short_wq_2}] 0 root 8 - 0B 896K - 5 0:00 0.00% [kernel{linuxkpi_long_wq_3}] 0 root 8 - 0B 896K - 5 0:00 0.00% [kernel{linuxkpi_short_wq_8}] 0 root 8 - 0B 896K - 5 0:00 0.00% [kernel{linuxkpi_short_wq_4}] 12 root -56 - 0B 432K WAIT -1 0:00 0.00% [intr{swi5: fast taskq}] 12 root -64 - 0B 432K WAIT -1 0:00 0.00% [intr{swi3: vm}] 12 root -72 - 0B 432K WAIT -1 0:00 0.00% [intr{swi1: pfsync}] 12 root -76 - 0B 432K WAIT -1 0:00 0.00% [intr{swi0: uart uart}] 12 root -88 - 0B 432K WAIT -1 0:00 0.00% [intr{irq256: xhci0}] -
Who is your ISP? Is it Carrier Grade NAT? I've seen and experienced the same issues with Carrier Grade NAT ISP providers.
-
@thatguy said in Internet routing stability problems:
Who is your ISP? Is it Carrier Grade NAT? I've seen and experienced the same issues with Carrier Grade NAT ISP providers.
It's a regular Dutch Consumer Grade cable modem provider, if that's what you mean.
It happened again two days ago. Disabling pfBlockerNG before cycling the WAN DHCP lease didn't make a difference, so I think I can rule that out as a cause. After cycling, CPU usage dropped, but quickly climbed again. Cycling it a couple of times more made it stay low, and the WAN connection remained.
-
@zak-mckracken said in Internet routing stability problems:
@thatguy said in Internet routing stability problems:
Who is your ISP? Is it Carrier Grade NAT? I've seen and experienced the same issues with Carrier Grade NAT ISP providers.
It's a regular Dutch Consumer Grade cable modem provider, if that's what you mean.
It happened again two days ago. Disabling pfBlockerNG before cycling the WAN DHCP lease didn't make a difference, so I think I can rule that out as a cause. After cycling, CPU usage dropped, but quickly climbed again. Cycling it a couple of times more made it stay low, and the WAN connection remained.
Hi man, sorry for the late reply I've been busy these weeks, crazy middle east war. Btw love DUtch people they are very social and kind, different with France or Belgian sorry gertJan
Ok let's do some test here, navigate to Diagnostics > Command Promt > type on Execute Shell Command:dmesg
<Execute>
What did you see after the line regents of the university of California??? -
Hi man, sorry for the late reply I've been busy these weeks, crazy middle east war. Btw love DUtch people they are very social and kind, different with France or Belgian sorry gertJan
Thank you for your kind words. We Dutch are usually regarded as rude, because we're speaking our minds, not beating around be bush.
Ok let's do some test here, navigate to Diagnostics > Command Promt > type on Execute Shell Command:
dmesg
<Execute>
What did you see after the line regents of the university of California???I think this is what you have asked, probably for for the Kernel version:
Copyright (c) 1979, 1980, 1983, 1986, 1988, 1989, 1991, 1992, 1993, 1994
	The Regents of the University of California. All rights reserved.
FreeBSD is a registered trademark of The FreeBSD Foundation.
FreeBSD 12.2-STABLE 1b709158e581(RELENG_2_5_0) pfSense amd64
FreeBSD clang version 10.0.1 (git@github.com:llvm/llvm-project.git llvmorg-10.0.1-0-gef32c611aa2)
Last time the problem occurred, I was able to get back online with rebooting, so they may still be evidence of what happened in the log...
-
In the State they love that kind mentality. Usually people who are talking around the bush are insincere people.
About the probs, do you still have pfsense 2.4.5? try to use it for a mount. Keep in mind that your isp could be a part of this prob. Cus one of our pfsense user has been terrorized by his isp's (rotten) partner.
-
@zak-mckracken forgot to ask you, do you know why in France they are welcoming, greeting and accepting you as their neighbor after 12 years mark? is that their tradition or culture?
-
@akegec said in Internet routing stability problems:
In the State they love that kind mentality. Usually people who are talking around the bush are insincere people.
Me too. I'm getting nervous when people are not giving it to me straight, but perhaps that's more of a geek-thing than a Dutch thing.
@zak-mckracken forgot to ask you, do you know why in France they are welcoming, greeting and accepting you as their neighbor after 12 years mark? is that their tradition or culture?
I don't know for sure. Even though driving to France is less than 200 miles for me, I haven't actually lived there to give you an answer on that. But in my perception, the French are more cordial than us. Or perhaps it's us Dutch that are dull/blunt. I know from a colleague working in Belgium that some time ago it was a custom to greet all your colleagues with a handshake when arriving at the office in the morning. Sounds nice, but I prefer not be distracted out of the zone 20 times in the morning.
The more you go south in Europe, the more people seem to enjoy live, taking it easier, enjoying better food, working to live, instead of living to work. Different work ethics, different payment ethics, but no judgement; Perhaps we are doing it wrong, not them.
I was raised with: Tell the truth, do the work, pay your bills. It's hard to understand other life styles.About the probs, do you still have pfsense 2.4.5? try to use it for a mount. Keep in mind that your isp could be a part of this prob. Cus one of our pfsense user has been terrorized by his isp's (rotten) partner.
According the the pfSense Home Screen, I'm running:
2.5.1-RELEASE (amd64)
built on Mon Apr 12 07:50:14 EDT 2021
FreeBSD 12.2-STABLE
I had the same problem with 2.5.0. It may be my ISP, but before the problems started, it has been working fine with this ISP for over 3 years. They have even put my cable modem into bridge-mode, per my request.
Two occurrences ago, I even unplugged to coax cable from the cable modem, leaving the WAN Ethernet link intact not to trigger the DHCP client, to see if it was an outside influence, but that didn't cure the problem. And it is not releasing my WAN DHCP lease that drops de CPU load; It's renewing it afterwards. Even if this produces the same IP address as I had before releasing it. -
That's why I love Dutch people they are open minded. Only one thing that I was really shocked when I visited Amsterdam, I think it was a Santa Claus's celebration but they painted their faces with black paint to imitate black people.
https://www.youtube.com/watch?v=LBLBxb29maw
I know it's a tradition, but we should keep a good tradition and trow away the bad. Like we had a tradition women only belong in the kitchen and stay home. Women can't be a leader. Or there was even worst tradition if a husband is dead, the wife needs to follow him in the after life.
Anyway just use 2.4.5 for now. But you can't use the packages e.g. pfblock, snort, etc
-
@akegec said in Internet routing stability problems:
That's why I love Dutch people they are open minded.
What I really liked when I worked in the US was how easy it was to have a casual conversation with a complete stranger. I couldn't go out shopping without having one, not even initiated by me. We don't do that here. We don't mind if someone does, but it just doesn't occur to us.
Only one thing that I was really shocked when I visited Amsterdam, I think it was a Santa Claus's celebration but they painted their faces with black paint to imitate black people.
https://www.youtube.com/watch?v=LBLBxb29maw
I know it's a tradition, but we should keep a good tradition and trow away the bad. Like we had a tradition women only belong in the kitchen and stay home. Women can't be a leader. Or there was even worst tradition if a husband is dead, the wife needs to follow him in the after life.
Well, that's a sensitive one nowadays, unfortunately. This celebration originated in the Middle Ages, and is the predecessor of your Santa Claus.
I did explain the black fellas here, but removed it to avoid this modern day mine field.Anyway just use 2.4.5 for now. But you can't use the packages e.g. pfblock, snort, etc
Well, I am running pfBlockNG. However, I don't think it's causing the problem, because I did disable it before my usual DHCP cycle fix, and CPU load increased again shortly after.
Any other ideas? -
Well the probs could be anything HW or SW or both. By just disabling pfblocker it doesn't mean anything. You need to uninstall pfblocker and the settings (e.g. update every hour) completely to know if pfblocker is not the culprit.
That's why I suggested you to use older pfsense version 2.4.5 for now without any packages, it could be the SW probs with your HW.
Have you even tried to run pfsense v 2.4.5 on ur device?Btw make some tea or coffee and look at this pfsense lesson on Youtube, @1:38:50 about pfblocker:
https://www.youtube.com/watch?v=wv1qTYR3faQHappy Sunday.
-
@akegec said in Internet routing stability problems:
Well the probs could be anything HW or SW or both.
It's probably not hardware: Everything - except for RAM - has been replaced 6 months ago, and RAM has been thoroughly tested. I replaced the mainboard (with soldered-on CPU) exactly because of this problem, or actually; attempts to fix it. After many power-cycles, it became sluggish and sluggisher, until it stopped booting at all. The SSD was replaced after an attempt to back it up. It probably broke down because of the USB adapter I used, not sure why, but it was an Intel enterprise SSD and it was still under warranty, so I got a replacement. I freshly installed pfSense and uploaded the configuration file I still had.
By just disabling pfblocker it doesn't mean anything. You need to uninstall pfblocker and the settings (e.g. update every hour) completely to know if pfblocker is not the culprit.
Hm, I didn't try to completely uninstall it. Perhaps I'll give that a go.
That's why I suggested you to use older pfsense version 2.4.5 for now without any packages, it could be the SW probs with your HW.
Unfortunately, a downgrade to 2.4.5 is not supported from the web interface. I'm afraid that operation would boil down to freshly install 2.4.5_1, uploading the configuration, and hoping for not too much fall-out.
Have you even tried to run pfsense v 2.4.5 on ur device?
Yes, I've been running PfSense on this hardware since 2016. Version 2.4.5 worked flawlessly.
The hardware is beyond suspicion; Besides being brand new, it is also top grade server hardware: It's a Supermicro SYS-5018A-FTN4 barebone, with 16MiB of memory off of the compatibility list and an Intel S4610 SSD.Btw make some tea or coffee and look at this pfsense lesson on Youtube, @1:38:50 about pfblocker:
https://www.youtube.com/watch?v=wv1qTYR3faQIt's queued up, and ready to go.
By the way; Does fpSense+ v21 also suffer from this problem? I have installed a Netgate appliance at my parent's house, and I'm hoping that will run a a little more stable.
And do you know if it is possible to purchase a fpSense+ v21 license for my own hardware?
-
pfBlockerNG removed about six weeks ago, but to no avail. Same problem last weekend, same problem today.
Any ideas on what I can check? -
I'm thinking it has something to do with your ISP. I have almost the exact same problem with a Carrier Grade NAT ISP in my area. Any client I manage that has a pfSense appliance and using the same ISP has the issue as well. There is one solution and one workaround.
Solution: Call your ISP and request a static IP. You will most likely have to pay more for it monthly.
Workaround: Make a script to periodically ping the Gateway. Once it fails the script will automatically disable and then re-enable your pfSense WAN. Here is the post on how to create that script.
However, I run it every minute instead of every five minutes through Cron.