Netgate Discussion Forum
    • Categories
    • Recent
    • Tags
    • Popular
    • Users
    • Search
    • Register
    • Login

    2.5.1-RELEASE - Dashboard's "Firewall logs" widget kills the CPU and effectively DoS's the GUI

    Scheduled Pinned Locked Moved General pfSense Questions
    33 Posts 6 Posters 2.8k Views
    Loading More Posts
    • Oldest to Newest
    • Newest to Oldest
    • Most Votes
    Reply
    • Reply as topic
    Log in to reply
    This topic has been deleted. Only users with topic management privileges can see it.
    • AKEGECA
      AKEGEC @e-1-1
      last edited by AKEGEC

      @e-1-1 that happen to me when pfsense 2.5.2 runs on hypervisor.

      Edit: Please note, because of security issues I run pfsense on physical hw and on vm for testing purpose only.

      E 1 Reply Last reply Reply Quote 0
      • E
        e-1-1 @AKEGEC
        last edited by

        @akegec For me it happens on physical boxes with SSDs, physical boxes with HDDs and VMs with HDD backed storage. All with ZFS, all reporting no errors after a manual scrub.
        Hardware reports no errors, so I'm left with a software fault.

        1 Reply Last reply Reply Quote 0
        • E
          e-1-1
          last edited by

          Writing as reply, 'cause after an hour I can't edit the initial post: on the slowest responding box, one that gets HTTP 504 errors frequently when logging in and going to system logs -> firewall, there are the following logs present:

          /var/log: ls -alh filter*
          -rw-------  1 root  wheel   287M Jun  6 13:57 filter.log
          -rw-------  1 root  wheel   150M Jun  2 18:16 filter.log.0.bz2
          -rw-------  1 root  wheel   152M May  3 13:43 filter.log.1.bz2
          

          On a Xeon fast box the following are present:

          /var/log: ls -alh filter*
          -rw-------  1 root  wheel    51M Jun  6 14:01 filter.log
          -rw-------  1 root  wheel   8.2M Jun  5 15:50 filter.log.0.bz2
          -rw-------  1 root  wheel   8.2M Jun  2 07:52 filter.log.1.bz2
          -rw-------  1 root  wheel   8.1M May 31 13:46 filter.log.2.bz2
          -rw-------  1 root  wheel   8.1M May 29 13:18 filter.log.3.bz2
          -rw-------  1 root  wheel   8.2M May 27 07:54 filter.log.4.bz2
          -rw-------  1 root  wheel   8.4M May 21 01:02 filter.log.5.bz2
          -rw-------  1 root  wheel   8.1M May 14 16:12 filter.log.6.bz2
          

          Status->System Logs->Firewall->Normal View is set to show the last 250 logs.
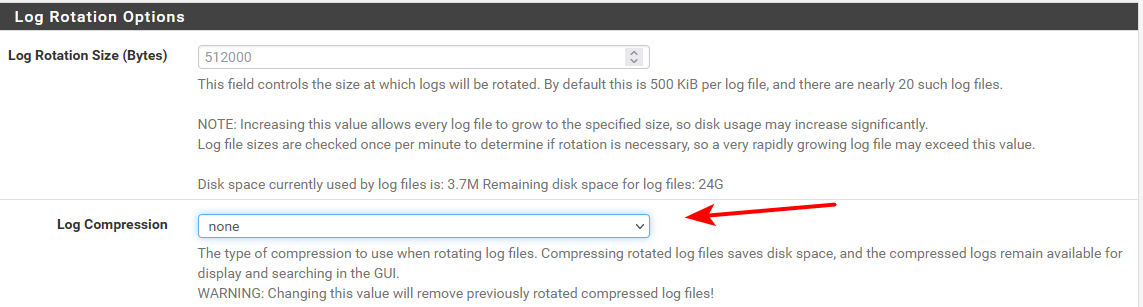
          Status->System Logs-> Settings "GUI Log Entries" is set to 50.

          "Log Rotation Size (Bytes)" is default at 512000.
          "Log Retention Count" is default at 7.

          johnpozJ 1 Reply Last reply Reply Quote 0
          • johnpozJ
            johnpoz LAYER 8 Global Moderator @e-1-1
            last edited by

            Do you still see this slow down if you turn off compression of the log files?

            compression.png

            An intelligent man is sometimes forced to be drunk to spend time with his fools
            If you get confused: Listen to the Music Play
            Please don't Chat/PM me for help, unless mod related
            SG-4860 24.11 | Lab VMs 2.8, 24.11

            E 1 Reply Last reply Reply Quote 0
            • stephenw10S
              stephenw10 Netgate Administrator
              last edited by

              Those files all seem huge. They should be rotating at 512K if the defaults are applied there.

              Are you able to test 2.5.2 beta on any of those systems?
              I'm unable to replicate that in 2.5.2 here on a number of systems.

              Steve

              johnpozJ E 2 Replies Last reply Reply Quote 0
              • johnpozJ
                johnpoz LAYER 8 Global Moderator @stephenw10
                last edited by

                @stephenw10 said in 2.5.1-RELEASE - Dashboard's "Firewall logs" widget kills the CPU and effectively DoS's the GUI:

                Those files all seem huge.

                Not sure I would use the word "seem" ;)

                -rw-------  1 root  wheel   287M Jun  6 13:57 filter.log
                

                287M?? For the current log that is less than 24 hours old ;)

                An intelligent man is sometimes forced to be drunk to spend time with his fools
                If you get confused: Listen to the Music Play
                Please don't Chat/PM me for help, unless mod related
                SG-4860 24.11 | Lab VMs 2.8, 24.11

                E 1 Reply Last reply Reply Quote 0
                • stephenw10S
                  stephenw10 Netgate Administrator
                  last edited by

                  Mmm, good point. That's huge however you look at it! Whether or not it's rotating correctly.

                  I wonder if displaying the widget is triggering the rotation. Or if simply trying to open that file to display the data is an issue. 🤔

                  johnpozJ E 2 Replies Last reply Reply Quote 0
                  • johnpozJ
                    johnpoz LAYER 8 Global Moderator @stephenw10
                    last edited by johnpoz

                    @e-1-1 what all are you logging? Is there a lot of spam in it? Are you logging all pass traffic with lots and lots of users?

                    What I mean by spam - like say multicast or broadcast traffic on your local side because it doesn't match up to your lan net filters? Or noise from the internet like loads and loads of udp p2p traffic?

                    278MBytes just seems like a lot of logging - that maybe could be trimmed down? If its filled with a lot of unwanted/needed sorts of traffic.

                    my logs might be smaller than normal since I don't log a lot of internet noise that I just don't care about. I only log common udp ports, and I only log syn hits on wan.

                    And I don't log any sort of noise from my lan side. Only stuff that is explicitly blocked, and not passed traffic going out.

                    [21.05-RELEASE][admin@sg4860.local.lan]/var/log: ls -ahl filter*
                    -rw-------  1 root  wheel   264K Jun  6 07:27 filter.log
                    -rw-------  1 root  wheel   500K Jun  6 02:14 filter.log.0
                    -rw-------  1 root  wheel   500K Jun  5 15:25 filter.log.1
                    -rw-------  1 root  wheel   499K Jun  5 07:25 filter.log.2
                    [21.05-RELEASE][admin@sg4860.local.lan]/var/log: 
                    

                    But 278MB for less than a day just seems like a lot.. Either you are pushing a hell of lot of traffic or maybe logging a lot of noise that may not need to be logged.

                    An intelligent man is sometimes forced to be drunk to spend time with his fools
                    If you get confused: Listen to the Music Play
                    Please don't Chat/PM me for help, unless mod related
                    SG-4860 24.11 | Lab VMs 2.8, 24.11

                    E 1 Reply Last reply Reply Quote 0
                    • E
                      e-1-1 @johnpoz
                      last edited by

                      @johnpoz Thanks, with "Log Compression" set to "none", the system logs firewall tab opens much faster, CPU isn't taxed as much:

                      21653 root       25   0  104M 22516 S  0.0  1.1  1:19.01    |  `- php-fpm: pool nginx
                      26182 root       26   0 11456  2336 S  0.0  0.1  0:00.00    |  |  `- sh -c /bin/cat '/var/log/filter.log' | /usr/bin/tail -r -n 350
                      26330 root       26   0 10628  1664 S  **7.4**  0.1  0:01.74    |  |     `- /bin/cat /var/log/filter.log
                      26532 root       74   0 10876  1844 R  **9.1**  0.1  0:02.21    |  |     `- /usr/bin/tail -r -n 350


                      Not sure if this is the way forward, without compression though.

                      1 Reply Last reply Reply Quote 0
                      • E
                        e-1-1 @stephenw10
                        last edited by

                        @stephenw10 Agree. Wonder if there is a button in the web GUI labeled "Rotate logs for {function X} now" that I can use.
                        Good thing that changing the log compression setting erased the older logs.
                        Well, good for me now, otherwise I'd be not happy for these deletions. Guess it would be too time consuming to program a routine that decompresses and recompresses the old logs in the new desired state, if at all (with setting "none").

                        Can test 2.5.2 on the slowest box, as it is the easiest to restore in case of bork. But didn't see anything seemingly related to this on the public Redmine issues for 2.5.2. Missing something?

                        1 Reply Last reply Reply Quote 0
                        • E
                          e-1-1 @johnpoz
                          last edited by

                          @johnpoz A box protecting a heavily attacked, publicly NAT-ed daemon, let's say. Details in the other reply.

                          1 Reply Last reply Reply Quote 0
                          • E
                            e-1-1 @stephenw10
                            last edited by

                            @stephenw10 My guess is that the code reading the logs is tightly coupled with the PHP web render thread, effectively crippling the GUI. If it weren't, I'd have no problem with logs loading slowly, but now in the best case it's a looong delay, in the worst case it's a HTTP 504 displayed.

                            1 Reply Last reply Reply Quote 0
                            • E
                              e-1-1 @johnpoz
                              last edited by

                              @johnpoz "Log firewall default blocks" is enabled. Wonder if it's there enabled by default, the UI doesn't tell. <-- point to improve the interface perhaps.

                              Only a few reject and deny rules tied to pfBlocker's Feodo abuse list are logged, however those caught in total less than 10 MB since last box reboot nine hours ago.
                              No pass rules traffic is logged. It would cripple the storage, terabytes a day pass through pf.

                              I guess your second definition of spam applies here, assisted by the snort2c table populated by Suricata.

                              Both the slowest and fastest box push 50 to 300 Mbps constantly, so that'd be the culprit for the logs' size.

                              However, my main concern is that coupling between log reading and webpage generation or loading, in both the dashboard widget and the system logs -> firewall page.

                              johnpozJ 1 Reply Last reply Reply Quote 0
                              • johnpozJ
                                johnpoz LAYER 8 Global Moderator @e-1-1
                                last edited by

                                @e-1-1 said in 2.5.1-RELEASE - Dashboard's "Firewall logs" widget kills the CPU and effectively DoS's the GUI:

                                Wonder if it's there enabled by default

                                Yeah logging default block is on by default.

                                An intelligent man is sometimes forced to be drunk to spend time with his fools
                                If you get confused: Listen to the Music Play
                                Please don't Chat/PM me for help, unless mod related
                                SG-4860 24.11 | Lab VMs 2.8, 24.11

                                GertjanG 1 Reply Last reply Reply Quote 0
                                • GertjanG
                                  Gertjan @johnpoz
                                  last edited by Gertjan

                                  @e-1-1 :

                                  Yeah logging default block is on by default.

                                  Being DOSsed means (to me) : instead of using the firewall widget, have the logs send to a 'remote' log server which is more capable of handling 'huge' quantities of log lines.

                                  The firewall widget is nice, but as soon as things heat up, it will slow down the access to the default login page of pfsense = the dashboard. Not good ...
                                  The widget is nice, for the days everything is calm and nothing is happening.

                                  And of course, uncheck the default block log :

                                  6031c34a-2988-454e-a0a7-c50ca0a25bfe-image.png

                                  as it will only learn you that IPv4 goes from 1.1.1.1 to 254.254.254.254 ;)

                                  No "help me" PM's please. Use the forum, the community will thank you.
                                  Edit : and where are the logs ??

                                  1 Reply Last reply Reply Quote 0
                                  • jimpJ
                                    jimp Rebel Alliance Developer Netgate
                                    last edited by jimp

                                    https://docs.netgate.com/pfsense/en/latest/monitoring/logs/settings.html#log-rotation-settings

                                    Read the notes, especially on the compression settings.

                                    Remember: Upvote with the 👍 button for any user/post you find to be helpful, informative, or deserving of recognition!

                                    Need help fast? Netgate Global Support!

                                    Do not Chat/PM for help!

                                    E 1 Reply Last reply Reply Quote 1
                                    • E
                                      e-1-1 @jimp
                                      last edited by

                                      @jimp Thanks for linking that.

                                      Looks like "none" is indeed the way forward to improve page load performance, current compress ratio is beautiful:

                                      [2.5.1-RELEASE][root@hostname]/var/log: zfs get compression,compressratio zroot/var
                                      NAME       PROPERTY       VALUE     SOURCE
                                      zroot/var  compression    lz4       inherited from zroot
                                      zroot/var  compressratio  8.32x     -


                                      Due to job "conditioning", let's say, that pushes me to get rid of root causes and find error avoidance methods, I gotta get the following paragraphs out of my mind and here, "on paper":

                                      I'd hereby push for a GUI hint towards this "hey, don't choose any compression, you are already using a ZFS dataset with compression enabled and it's x.y% efficient, no need for further CPU cycles to be wasted."

                                      As well, I'd push for this "Log Compression" setting to be disabled by default when an install is done on a ZFS filesystem/volume manager, if it's not already.

                                      And for a "best practice" guide (one can dream, something like Cisco's wireless best practice page in their wireless controllers' web interface) directly in the GUI, after an upgrade a message could pop-up saying "hey we noticed you use ZFS, but have log compression enabled. It's not ideal. Wanna change to none? warning - all previously logs will be deleted. Yes/No".

                                      To conclude, even with "none" set, neither the dashboard, nor the firewall log section load as fast as I'd like.
                                      Yes, @Gertjan, log shipping to a SIEM is nice, however due to resource constraints not every box/cluster that I manage benefits from this. Therefore the need to at least be able to view the system logs -> firewall tab, unfortunately with blocked entries for statistics. Now that I got to this, another thing comes to mind - if the dashboard widget and system logs are set to retrieve the last, say, 250 log lines, why is the webpage generating code trying to read all the logs, including the older ones? If it starts to read the current filter.log and it has reached the line limit, it should stop there and then imo. Ah, another one for the PHP logic.

                                      From the first post, my wish was a decoupling between the page load code and the log filter load code. Hope this is possible to do, sometime in a later release.

                                      johnpozJ 1 Reply Last reply Reply Quote 0
                                      • johnpozJ
                                        johnpoz LAYER 8 Global Moderator @e-1-1
                                        last edited by johnpoz

                                        @e-1-1 said in 2.5.1-RELEASE - Dashboard's "Firewall logs" widget kills the CPU and effectively DoS's the GUI:

                                        zfs get compression,compressratio zroot/var

                                        Your getting a better ratio than me.. I would assume that is because your logs are bigger? Lots more info that can be compressed for better overall ratio.

                                        [21.05-RELEASE][admin@sg4860.local.lan]/: zfs get compression,compressratio zroot/var
                                        NAME       PROPERTY       VALUE     SOURCE
                                        zroot/var  compression    lz4       inherited from zroot
                                        zroot/var  compressratio  3.45x     -
                                        [21.05-RELEASE][admin@sg4860.local.lan]/: 
                                        

                                        Or maybe you have other logs that compress better? I am not running any sort of ips, so there are none of those logs, etc.

                                        An intelligent man is sometimes forced to be drunk to spend time with his fools
                                        If you get confused: Listen to the Music Play
                                        Please don't Chat/PM me for help, unless mod related
                                        SG-4860 24.11 | Lab VMs 2.8, 24.11

                                        E 1 Reply Last reply Reply Quote 0
                                        • E
                                          e-1-1 @johnpoz
                                          last edited by e-1-1

                                          @johnpoz I guess that's the case, filter.log reached a bigger size today.

                                          /var/log: ls -alh filter*
                                          -rw-------  1 root  wheel   378M Jun  8 01:41 filter.log
                                          

                                          Not sure why it's not rotating though. Meh.. maybe after next reboot it sorts itself out.

                                          Edit - or maybe I know?!

                                          From one of my previous posts:

                                          "Log Rotation Size (Bytes)" is default at 512000.
                                          

                                          (can't find quote format button)

                                          Actually, that field has no value, value 512000 is faintly visible there as a grey, washed out text. Do you think setting something there will trigger a log rotation sometime in the future via a built-in cron job or something similar?

                                          GertjanG 1 Reply Last reply Reply Quote 0
                                          • GertjanG
                                            Gertjan @e-1-1
                                            last edited by

                                            The 'cron' package shows :

                                            1b44dd0b-7516-4dc8-9310-7027aa5f2c3d-image.png

                                            so every minute the command /usr/sbin/newsyslog is run.
                                            It reads its default config file /etc/newsyslog.conf in which its told to read /var/etc/newsyslog.conf.d/pfSense.conf
                                            In that file you can find :

                                            /var/log/userlog                root:wheel      600     3       1024    *       B
                                            /var/log/utx.log                root:wheel      644     3       1024    *       B
                                            /var/log/system.log             root:wheel      600     7       1024    *       JC
                                            /var/log/filter.log             root:wheel      600     7       1024    *       JC
                                            /var/log/dhcpd.log              root:wheel      600     7       1024    *       JC
                                            /var/log/vpn.log                root:wheel      600     7       1024    *       JC
                                            /var/log/poes.log               root:wheel      600     7       1024    *       JC
                                            /var/log/l2tps.log              root:wheel      600     7       1024    *       JC
                                            /var/log/openvpn.log            root:wheel      600     7       1024    *       JC
                                            /var/log/portalauth.log         root:wheel      600     7       1024    *       JC
                                            /var/log/ipsec.log              root:wheel      600     7       1024    *       JC
                                            /var/log/ppp.log                root:wheel      600     7       1024    *       JC
                                            /var/log/wireless.log           root:wheel      600     7       1024    *       JC
                                            /var/log/nginx.log              root:wheel      600     7       1024    *       JC
                                            /var/log/ntpd.log               root:wheel      600     7       1024    *       JC
                                            /var/log/gateways.log           root:wheel      600     7       1024    *       JC
                                            /var/log/resolver.log           root:wheel      600     7       1024    *       JC
                                            /var/log/routing.log            root:wheel      600     7       1024    *       JC
                                            /var/log/auth.log               root:wheel      600     7       1024    *       JC
                                            

                                            This corresponds with :

                                            1d90e3c1-2ea1-4b8c-8f78-551ac9d7da2d-image.png

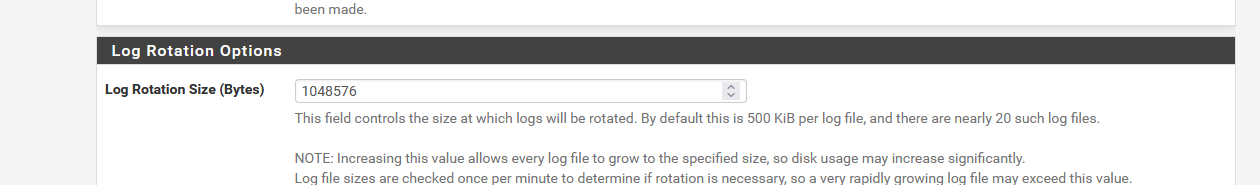
                                            where 1024 x 1024 (K) = 1 048 576, so each file will be approximatively 1 mega byte on my pfSense.
                                            The default is probably 512 Kbytes, as the help text states.

                                            No "help me" PM's please. Use the forum, the community will thank you.
                                            Edit : and where are the logs ??

                                            E 1 Reply Last reply Reply Quote 0
                                            • First post
                                              Last post
                                            Copyright 2025 Rubicon Communications LLC (Netgate). All rights reserved.