Netgate Discussion Forum
    • Categories
    • Recent
    • Tags
    • Popular
    • Users
    • Search
    • Register
    • Login

    pfBlocker not logging after 2.5.2 pfSense upgrade

    Scheduled Pinned Locked Moved pfBlockerNG
    53 Posts 17 Posters 10.9k Views
    Loading More Posts
    • Oldest to Newest
    • Newest to Oldest
    • Most Votes
    Reply
    • Reply as topic
    Log in to reply
    This topic has been deleted. Only users with topic management privileges can see it.
    • keyserK
      keyser Rebel Alliance @cefleet
      last edited by

      @cefleet Please monitor your disk usage as python mode on 21.05/2.5.2 has a an issue on some systems with slowly consuming all diskspace. The key issue is that no files/logfiles report a size / diskusage that accounts for the space usage - they remain sized like before. So you cannot locate the file/problem that fills the filesystem.

      This leads to a situation where the filesystem is full, and you need to stop/start pfBlockerNG completely or reboot pfSense to regain your filesystem space.

      Love the no fuss of using the official appliances :-)

      C 1 Reply Last reply Reply Quote 2
      • C
        cefleet @keyser
        last edited by

        @keyser Thanks for the heads up. I will keep an eye on the disk usage. So far everything looks good.

        1 Reply Last reply Reply Quote 1
        • D
          dotsch @cefleet
          last edited by dotsch

          @cefleet said in pfBlocker not logging after 2.5.2 pfSense upgrade:

          I changed from Unbound mode to Unbound Python mode and that has seemed to have fixed things. I thought I did this the other day and it did not work. In any case, it appears to be working now. Thanks for everyone's input.

          Thank you very much for the hint. I can confirm, that it is working for me with Unbound Python and enabling Python in pfBlocker DNBL.

          N 1 Reply Last reply Reply Quote 1
          • N
            NickD 0 @dotsch
            last edited by

            @dotsch Same here, no issues with the python module and logging.

            1 Reply Last reply Reply Quote 0
            • badprocessB
              badprocess
              last edited by

              Ok so i also enabled Python Unbound mode and actually the logs are working again. I'll monitor in the coming days the disk occupation

              1 Reply Last reply Reply Quote 0
              • S
                SillieWous
                last edited by SillieWous

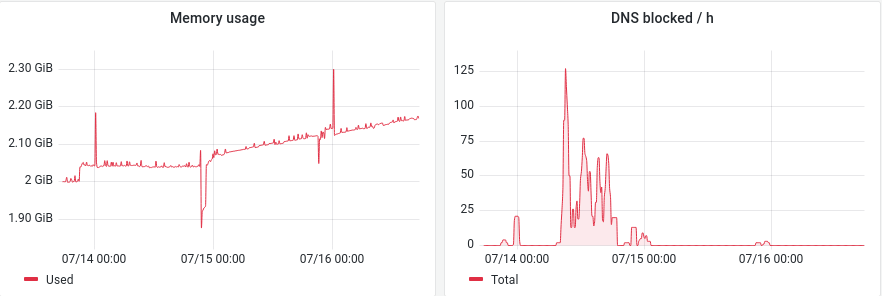
                Same story for me. Upgraded on the 15th (as clearly visible in the pictures below). Next to not logging of DNSBL there also seems to be a memory leak, unsure if related.

                4d48d88e-2214-4fce-9de0-ef30c4ada062-image.png

                Is it possible to switch to python unbound with DHCP registration? As it still says "Python DNSBL mode is not compatable with the DNS Resolver DHCP Registration option (Unbound will Crash)!" in the information for selecting python unbound.

                1 Reply Last reply Reply Quote 0
                • M
                  maddy_in65
                  last edited by maddy_in65

                  I have faced similar issue, DNSBL stopped blocking after 2.5.2 upgrade. I reinstalled pfsense but it didn't work. Later I changed mode to python unbound and it started working. However post this upgrade, my CPU and memory utilization is very high, earlier I had large list of IP and DNSBL but after this upgrade i cant enable all the list. I am running with only few list b of IP and DNSBL but after this upgrade i cant enable all the list. I am running with only few list but memory is still high. ut memory is still high. Is there any solution for this.

                  d50fe12e-8e8b-4ccd-a92f-d26deb6fbc5e-image.png

                  GertjanG 1 Reply Last reply Reply Quote 0
                  • GertjanG
                    Gertjan @maddy_in65
                    last edited by

                    @maddy_in65
                    What is your CPU doing ?
                    See here Diagnostics > System Activity
                    Or better : console or SSH access, option 8 and enter

                    top
                    

                    See here for more info.

                    No "help me" PM's please. Use the forum, the community will thank you.
                    Edit : and where are the logs ??

                    M 1 Reply Last reply Reply Quote 0
                    • M
                      maddy_in65 @Gertjan
                      last edited by

                      @gertjan
                      Here is "Top" output:

                       processes:  4 running, 56 sleeping
                      CPU: 91.3% user,  0.0% nice,  8.7% system,  0.0% interrupt,  0.0% idle
                      Mem: 958M Active, 337M Inact, 750M Wired, 208K Buf, 1698M Free
                      ARC: 278M Total, 161M MFU, 105M MRU, 2654K Anon, 2044K Header, 8178K Other
                           160M Compressed, 585M Uncompressed, 3.66:1 Ratio
                      Swap: 2048M Total, 2048M Free
                      
                        PID USERNAME    THR PRI NICE   SIZE    RES STATE    C   TIME    WCPU COMMAND
                      62378 root         88  20    0   468M   423M nanslp   0   0:37 132.04% ntopng
                      38952 unbound       1  77    0    91M    79M RUN      1   0:03  32.27% unbound
                        347 root          1  52    0   102M    39M piperd   0   1:06  25.19% php-fpm
                      43559 root          1  20    0    13M  3508K CPU1     1   0:00   0.59% top
                      62111 root          4  20    0    22M  5356K kqread   1   0:00   0.29% redis-server
                       9748 root          1  20    0    19M  6824K select   1   0:03   0.12% ntpd
                      36481 root          1  20    0    20M  9220K select   0   0:00   0.10% sshd
                      85972 root          5  52    0    11M  2592K uwait    0   0:00   0.06% dpinger
                      47972 dhcpd         1  25    0    23M    12M select   1   0:00   0.02% dhcpd
                      47822 root          1  20    0    18M  7552K kqread   0   0:00   0.01% lighttpd_pfb
                       5149 root          3  20    0    18M  7168K select   1   0:06   0.01% pcscd
                      85427 root          5  52    0    11M  2592K uwait    1   0:00   0.01% dpinger
                        346 root          1  52    0   102M    39M accept   0   2:03   0.00% php-fpm
                      48256 root          1  52    0   102M    39M accept   1   1:06   0.00% php-fpm
                      44666 root          1  52    0   102M    39M accept   1   0:51   0.00% php-fpm
                      62020 root          1  23    0   102M    38M accept   0   0:35   0.00% php-fpm
                      19548 root          1  20    0    11M  2648K select   0   0:07   0.00% syslogd
                      95969 root          2  20    0   229M   191M bpf      0   0:02   0.00% snort
                      19460 root          1  20    0   104M    36M nanslp   0   0:01   0.00% php-cgi
                       8574 root          1  20    0    30M  9792K kqread   0   0:01   0.00% nginx
                      49739 root          1  20    0    61M    39M piperd   0   0:00   0.00% php_pfb
                        345 root          1  20    0   102M    27M kqread   0   0:00   0.00% php-fpm
                      31190 root          1  20    0    12M  2956K bpf      1   0:00   0.00% filterlog
                       8290 root          1  20    0    29M  9248K kqread   1   0:00   0.00% nginx
                       9162 root          1  45    0    11M  2484K nanslp   1   0:00   0.00% cron
                      24662 root          1  20    0    21M  8448K select   0   0:00   0.00% mpd5
                        376 root          1  40   20    11M  2840K kqread   0   0:00   0.00% check_reload_status
                      49643 root          1  20    0    11M  2212K kqread   0   0:00   0.00% tail_pfb
                      54837 root          1  20    0    44M    35M bpf      0   0:00   0.00% arpwatch
                      56501 root          1  20    0    44M    35M bpf      0   0:00   0.00% arpwatch
                      [2.5.2-RELEASE][admin@
                      
                      
                      GertjanG 1 Reply Last reply Reply Quote 0
                      • GertjanG
                        Gertjan @maddy_in65
                        last edited by

                        @maddy_in65

                        Well ?
                        Who is this : ntopng ? I don't know what it is. Is it useful ? It's going at light speed (132 % CPU usage !?!). For me, that alarming. What if that "ntopng" is doing a lot of DNS requests ? That would explain something.
                        You stopped it ?

                        No "help me" PM's please. Use the forum, the community will thank you.
                        Edit : and where are the logs ??

                        1 Reply Last reply Reply Quote 0
                        • M
                          maddy_in65
                          last edited by

                          Yes I stopped it. CPU utilization is normal but Memory utilization is still high.
                          453c755f-e36f-4315-b809-223e57e9293d-image.png

                          GertjanG 1 Reply Last reply Reply Quote 0
                          • GertjanG
                            Gertjan @maddy_in65
                            last edited by

                            Use top again.
                            It shows the memory usage per process also.
                            Who is the winner ?

                            No "help me" PM's please. Use the forum, the community will thank you.
                            Edit : and where are the logs ??

                            1 Reply Last reply Reply Quote 0
                            • provelsP
                              provels
                              last edited by provels

                              Isn't high memory usage the nature of the Beastie anyway (file caching)?
                              I figure I paid for 100% of the memory and CPU and as long as I'm not running out, that's good ROI.

                              Peder

                              MAIN - pfSense+ 24.11-RELEASE - Adlink MXE-5401, i7, 16 GB RAM, 64 GB SSD. 500 GB HDD for SyslogNG
                              BACKUP - pfSense+ 23.01-RELEASE - Hyper-V Virtual Machine, Gen 1, 2 v-CPUs, 3 GB RAM, 8GB VHDX (Dynamic)

                              1 Reply Last reply Reply Quote 0
                              • M
                                maddy_in65
                                last edited by

                                One thing I noticed post 2.5.2 upgrade is that most clients are loosing internet connection for a while and connects back. I have observed this on few WLAN clients (mobile, tablets), they shows no connectivity . I thought it might be issue with AP (Unifi). I tried rebooting APs but issue still persists. I also check on few LAN clients and they also had similar issue. I have removed pfblocker and the issue didn't appear again. Today I have installed pfblocker again with unbound mode and few feeds. As of now all clients are stable and I am monitoring devices.

                                Unbound and Snort has major memory utilization.

                                last pid: 31316;  load averages:  0.81,  0.68,  0.72                                                                up 0+06:28:52  15:51:28
                                65 processes:  1 running, 64 sleeping
                                CPU:  1.4% user,  0.0% nice,  0.6% system,  0.2% interrupt, 97.9% idle
                                Mem: 951M Active, 273M Inact, 531M Wired, 208K Buf, 1988M Free
                                ARC: 214M Total, 126M MFU, 84M MRU, 257K Anon, 1113K Header, 3189K Other
                                     114M Compressed, 368M Uncompressed, 3.22:1 Ratio
                                Swap: 2048M Total, 2048M Free
                                
                                  PID USERNAME    THR PRI NICE   SIZE    RES STATE    C   TIME    WCPU COMMAND
                                  347 root          1  21    0   102M    39M accept   1   0:38   1.56% php-fpm
                                17542 root          2  20    0   230M   193M bpf      1   2:03   0.49% snort
                                90137 root          1  20    0    13M  3540K CPU1     1   0:00   0.11% top
                                70928 root          1  20    0    18M  7924K kqread   0   0:01   0.10% lighttpd_pfb
                                32031 root          1  20    0    28M  8616K kqread   0   0:03   0.08% nginx
                                 6428 root          3  20    0    23M    11M select   0   0:12   0.05% pcscd
                                21702 root          3  20    0   238M   197M bpf      1   0:03   0.04% snort
                                 4582 root          1  20    0   104M    36M nanslp   1   0:02   0.03% php-cgi
                                 4447 root          1  20    0    11M  2652K select   1   0:03   0.03% syslogd
                                71496 root          1  20    0    59M    38M piperd   1   0:01   0.02% php
                                37225 dhcpd         1  20    0    23M    12M select   0   0:00   0.02% dhcpd
                                23994 root          5  52    0    11M  2592K uwait    1   0:00   0.02% dpinger
                                36222 root          1  20    0    12M  2960K bpf      1   0:01   0.02% filterlog
                                78612 zabbix        1  20    0    19M  9056K nanslp   1   0:00   0.02% zabbix_agentd
                                24559 root          5  52    0    11M  2592K uwait    1   0:00   0.01% dpinger
                                33035 root          1  20    0    19M  6900K select   0   0:03   0.01% ntpd
                                28353 root          1  20    0    20M  9208K select   0   0:00   0.01% sshd
                                71058 root          1  20    0    10M  2148K kqread   1   0:00   0.01% tail_pfb
                                71320 root          1  20    0    61M    39M piperd   0   0:00   0.00% php_pfb
                                  345 root          1  20    0   102M    27M kqread   1   0:01   0.00% php-fpm
                                76619 root          1  20    0    44M    35M bpf      0   0:00   0.00% arpwatch
                                75582 root          1  20    0    44M    35M bpf      0   0:00   0.00% arpwatch
                                74827 root          1  20    0    44M    35M bpf      1   0:00   0.00% arpwatch
                                76215 root          1  20    0    44M    35M bpf      1   0:00   0.00% arpwatch
                                75224 root          1  20    0    44M    35M bpf      1   0:00   0.00% arpwatch
                                74047 root          1  20    0    44M    35M bpf      1   0:00   0.00% arpwatch
                                76918 root          1  20    0    44M    35M bpf      1   0:00   0.00% arpwatch
                                75978 root          1  20    0    44M    35M bpf      1   0:00   0.00% arpwatch
                                28242 unbound       2  20    0   383M   367M kqread   0   0:36   0.00% unbound
                                46839 root          1  52    0   104M    40M accept   1   0:33   0.00% php-fpm
                                  346 root          1  39    0   101M    39M accept   0   0:32   0.00% php-fpm
                                
                                
                                GertjanG 1 Reply Last reply Reply Quote 0
                                • GertjanG
                                  Gertjan @maddy_in65
                                  last edited by

                                  @maddy_in65 said in pfBlocker not logging after 2.5.2 pfSense upgrade:

                                  28242 unbound 2 20 0 383M 367M kqread 0 0:36 0.00% unbound

                                  I have

                                  55688 unbound       2  20    0   105M    82M kqread   1   2:57   0.00% unbound
                                  

                                  The difference is probably tour DNSBL usage (pfBlockerNG).

                                  Still, these values are ok.

                                  Btw : i'm not trying to block "everybody", as many and/or huge DNSBL/IP feeds do impact the system.
                                  I'm just using the minimal :

                                  8c85bd85-0ce7-46be-a445-7f8769c76648-image.png

                                  No "help me" PM's please. Use the forum, the community will thank you.
                                  Edit : and where are the logs ??

                                  M 1 Reply Last reply Reply Quote 0
                                  • M
                                    marcosm Netgate @Gertjan
                                    last edited by

                                    Using the latest pfBlockerNG-devel, IP stats won't work unless using auto rules. If using only the "Alias" actions, i.e. custom rules, the package is not able to keep track of the rule matches. I imagine this is the intended behavior.

                                    Note: I've only tested on 21.05.

                                    RonpfSR 1 Reply Last reply Reply Quote 0
                                    • RonpfSR
                                      RonpfS @marcosm
                                      last edited by RonpfS

                                      @marcos-ng From the under Action it says :

                                      Note:
                                      
                                      When manually creating 'Alias' type firewall rules, Prefix the Firewall rule Description with pfb_ .
                                      This will ensure that that Dashboard widget reports those statistics correctly. 
                                      
                                      Do not prefix with (pfB_) as those Rules will be auto-removed by package when 'Auto' rules are defined.
                                      

                                      2.4.5-RELEASE-p1 (amd64)
                                      Intel Core2 Quad CPU Q8400 @ 2.66GHz 8GB
                                      Backup 0.5_5, Bandwidthd 0.7.4_4, Cron 0.3.7_5, pfBlockerNG-devel 3.0.0_16, Status_Traffic_Totals 2.3.1_1, System_Patches 1.2_5

                                      M 1 Reply Last reply Reply Quote 0
                                      • M
                                        marcosm Netgate @RonpfS
                                        last edited by marcosm

                                        @ronpfs
                                        I missed that, thanks. I suppose then this should be confirmed by whomever reports that it's not working.

                                        1 Reply Last reply Reply Quote 0
                                        • n3xus_x3N
                                          n3xus_x3
                                          last edited by n3xus_x3

                                          Hello,
                                          today i updated the latest version of pfsense (2.5.2) , and i have the same problem . In the DNSBL configuration , i changed to localhost , i uninstalled pfblockerNG-devel,reinstalled , I have updated the lists , but i still have the same problem .
                                          Someone solved it?
                                          pfsense2.png

                                          GertjanG 1 Reply Last reply Reply Quote 0
                                          • GertjanG
                                            Gertjan @n3xus_x3
                                            last edited by

                                            @n3xus_x3 said in pfBlocker not logging after 2.5.2 pfSense upgrade:

                                            Someone solved it?

                                            The initial issue was : pfBlockerNG stopped blocking.
                                            Thus is stops logging.
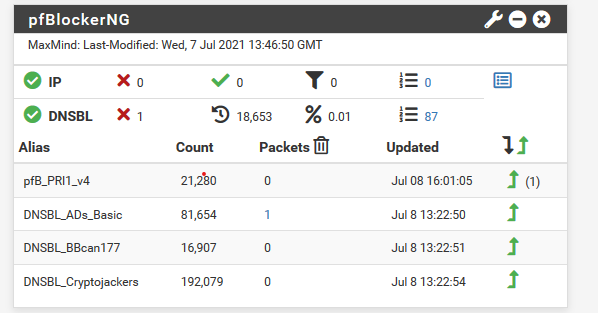
                                            I tend to say that's quiet normal.

                                            Here are the 'pfBlockerNG' files :

                                            ls -al /var/unbound/var/log/pfblockerng/
                                            

                                            You means these files are not growing in size for you ?

                                            Your stats say : it blocks things, as numbers are shown in the "Packet" column.

                                            @n3xus_x3 said in pfBlocker not logging after 2.5.2 pfSense upgrade:

                                            , i changed to localhost

                                            Changed what ? Where ?

                                            'localhost' is the default, and works :

                                            0effc049-d73d-4035-90a6-bab98b6dbcd4-image.png

                                            Or I do not understand what you mean by "i changed to localhost".

                                            No "help me" PM's please. Use the forum, the community will thank you.
                                            Edit : and where are the logs ??

                                            1 Reply Last reply Reply Quote 0
                                            • First post
                                              Last post
                                            Copyright 2025 Rubicon Communications LLC (Netgate). All rights reserved.