Solarflare traffic graph broken for extra PFs
-
Hello,
I actually posted about this some time back but didn't get any response (post in question here). This post is going to be longer, I am hoping explain things in more detail.
Traffic graph does not work for solarflare adapters in certain cases. I've done more trials myself, and I have found out that the issue happens only for extra physical functions of the solarflare adapter. For reference, you can divide a solarflare NIC into multiple physical adapters (to be clear, this is different than VFs)
I have two ports on the solarflare 10g adapter where I can divide each port into 8 different physical functions. Each of the 8 functions act part of a switch so I can do a NIC passthrough for VMs and they would be in the same subnet.
What I tried was have one port divided into 8 and the other port is not divided at all. I have passthrough one of the divided NICs and the undivided NIC into pfsense. I'm using ESXI if that makes a difference.
Traffic graph works for the undivided NIC, but divided NIC has nothing coming up in the charts. Funny thing, divided NIC is working just fine, I can even see individual clients' bandwidth in the traffic graph window. (I have the picture in the original post).
I have tried both implementation of Traffic modes, and neither made a difference.
Any help here would be appreciated!
-
There's probably not much we can do about this if the driver does not report the stats as expected for the virtual NICs.
Do you see traffic logged in the RRD graphs? (Status > Monitoring)
Or from iftop at the command line?Steve
-
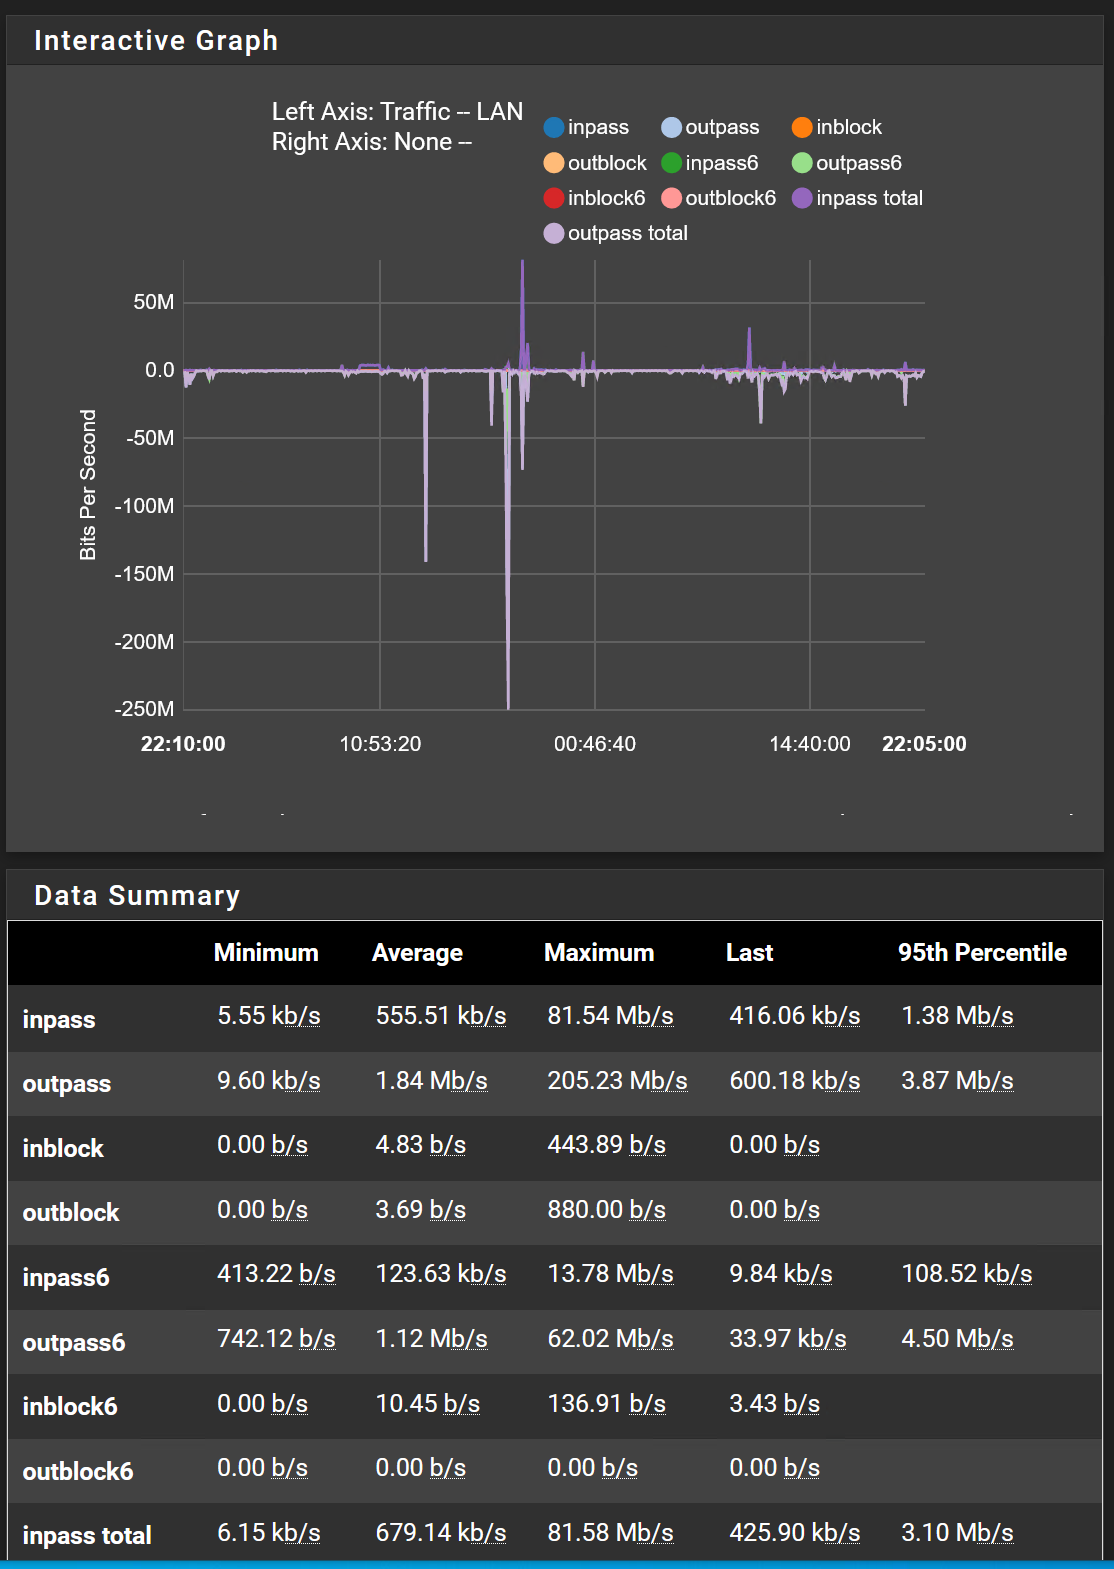
@stephenw10 Is this the RRD Graph?
-
It is. I assume LAN is assigned as one of the virtual interfaces there?
-
@stephenw10 yup.
-
Hmm, how do those interfaces appear in, say, ifconfig?
-
sfxge0: flags=28943<UP,BROADCAST,RUNNING,PROMISC,SIMPLEX,MULTICAST,PPROMISC> metric 0 mtu 1500 description: WAN options=ec03bb<RXCSUM,TXCSUM,VLAN_MTU,VLAN_HWTAGGING,JUMBO_MTU,VLAN_HWCSUM,TSO4,TSO6,VLAN_HWTSO,LINKSTATE,RXCSUM_IPV6,TXCSUM_IPV6> ether -redacted- hwaddr -redacted- inet6 -redacted-%sfxge0 prefixlen 64 scopeid 0x1 inet6 -redacted- prefixlen 64 inet -redacted- netmask 0xfffffc00 broadcast -redacted- media: Ethernet autoselect (1000baseSX <full-duplex,rxpause,txpause>) status: active nd6 options=23<PERFORMNUD,ACCEPT_RTADV,AUTO_LINKLOCAL> vmx0: flags=8a43<UP,BROADCAST,RUNNING,ALLMULTI,SIMPLEX,MULTICAST> metric 0 mtu 1500 description: IOT options=e403bb<RXCSUM,TXCSUM,VLAN_MTU,VLAN_HWTAGGING,JUMBO_MTU,VLAN_HWCSUM,TSO4,TSO6,VLAN_HWTSO,RXCSUM_IPV6,TXCSUM_IPV6> ether -redacted- inet6 -redacted-%vmx0 prefixlen 64 scopeid 0x2 inet -redacted- netmask 0xffffff00 broadcast -redacted- media: Ethernet autoselect status: active nd6 options=21<PERFORMNUD,AUTO_LINKLOCAL> sfxge1: flags=8a43<UP,BROADCAST,RUNNING,ALLMULTI,SIMPLEX,MULTICAST> metric 0 mtu 1500 description: LAN options=ec03bb<RXCSUM,TXCSUM,VLAN_MTU,VLAN_HWTAGGING,JUMBO_MTU,VLAN_HWCSUM,TSO4,TSO6,VLAN_HWTSO,LINKSTATE,RXCSUM_IPV6,TXCSUM_IPV6> ether -redacted- inet6 -redacted-%sfxge1 prefixlen 64 scopeid 0x3 inet6 fe80::1:1%sfxge1 prefixlen 64 scopeid 0x3 inet6 -redacted- prefixlen 64 inet -redacted- netmask 0xffffff00 broadcast -redacted- media: Ethernet autoselect (10Gbase-SR <full-duplex,rxpause,txpause>) status: active nd6 options=21<PERFORMNUD,AUTO_LINKLOCAL> -
Was ifconfig output helpful? :)
-
Not really, they look to be presented almost identically.
I would look at the interface stats in the sysctls. Make sure they are incrementing Equally across both NIC types. They may not even be defined for the virtual NICs.
Steve
-
You’re right about sysctl. I guess no fix for this, right?
[2.5.2-RELEASE][root@pfSense.home]/root: sysctl -a | grep sfxge.1.stats.tx_pkts
dev.sfxge.1.stats.tx_pkts: 0
[2.5.2-RELEASE][root@pfSense.home]/root: sysctl -a | grep sfxge.0.stats.tx_pkts
dev.sfxge.0.stats.tx_pkts: 76506024 -
Probably not in pfSense, it looks like a driver issue.
Unless there is some other sysctl that can alter that behaviour. I don't see anything listed though.
Steve