• Categories
  • Recent
  • Tags
  • Popular
  • Users
  • Search
  • Register
  • Login
Netgate Discussion Forum
  • Categories
  • Recent
  • Tags
  • Popular
  • Users
  • Search
  • Register
  • Login

Dashboard memory usage vs. Monitoring Memory

Scheduled Pinned Locked Moved webGUI
3 Posts 2 Posters 714 Views
Loading More Posts
  • Oldest to Newest
  • Newest to Oldest
  • Most Votes
Reply
  • Reply as topic
Log in to reply
This topic has been deleted. Only users with topic management privileges can see it.
  • R
    Raffi_
    last edited by Raffi_ Jul 31, 2018, 12:14 PM Jul 9, 2018, 2:15 PM

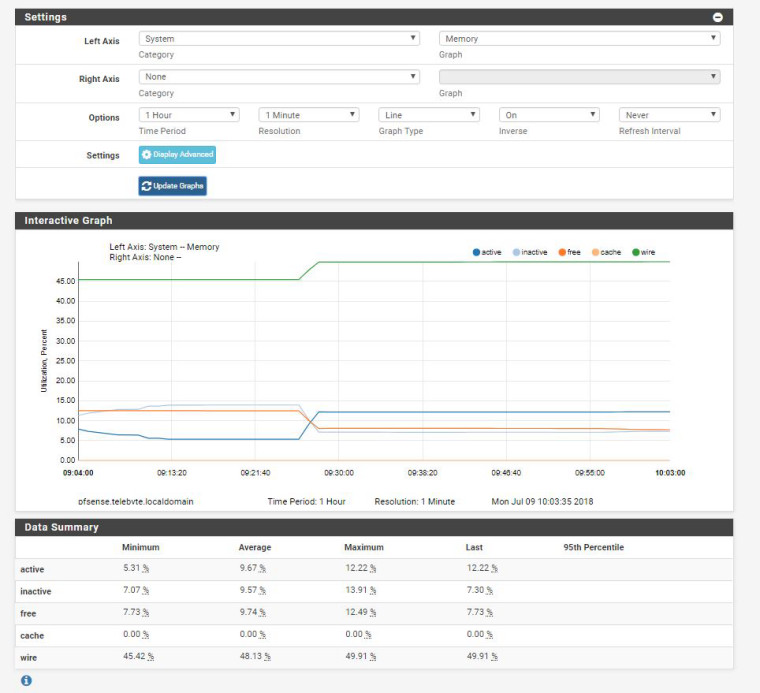
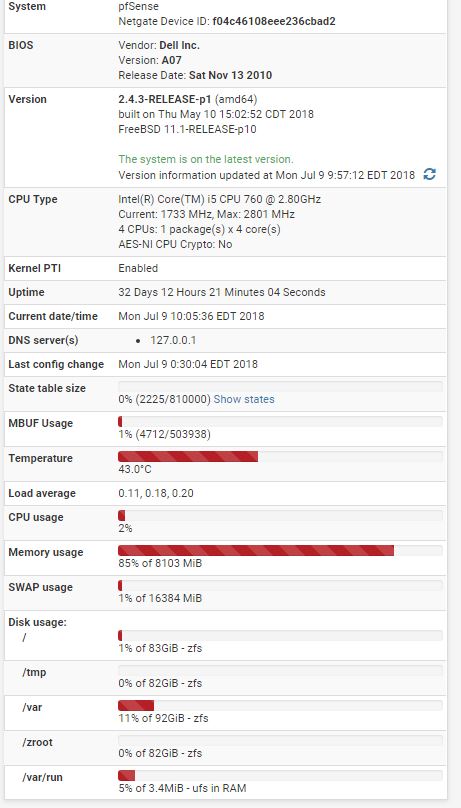
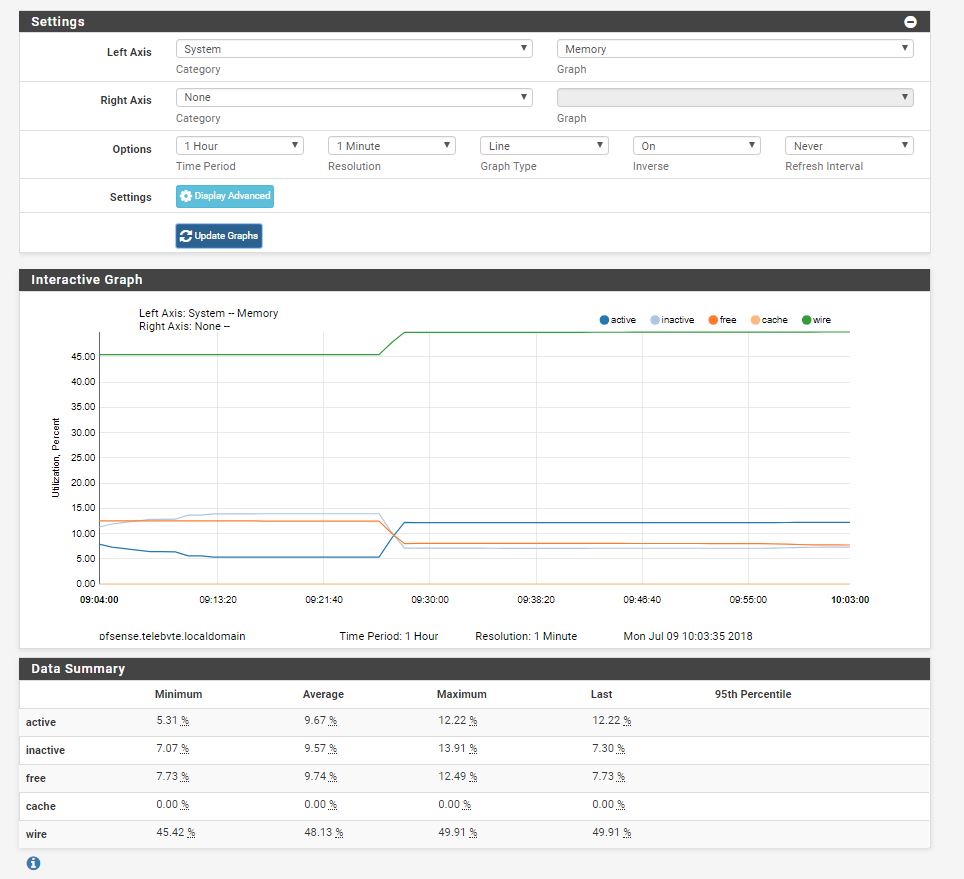
    I think I might be missing some bit of information. It used to be that the memory usage reported on the dashboard would match up with the total memory usage reported by going the Monitoring tab and checking the current memory usage graph. Then adding the wire, active, and inactive would give me the same value as the number reported on the dashboard. I noticed my dashboard memory usage was a little unusually higher than normal. It reported 85% usage. So I check my graphs and it doesn't add up. Even my worst case max numbers don't add up to that. What am I missing? See my screenshots and let me know if I'm missing something.1_1531145732548_Memory monitor.JPG 0_1531145732548_Dashboard.JPG

    1 Reply Last reply Reply Quote 0
    • R
      Raffi_
      last edited by Jul 11, 2018, 1:47 PM

      I was looking at this again today and now I have another question. If I look at the memory at any given point along the graph, adding up all the numbers doesn't equal 100. How can that be?

      1 Reply Last reply Reply Quote 0
      • Z
        zakariyapalmer
        last edited by Aug 16, 2021, 8:19 AM

        This post is deleted!
        1 Reply Last reply Reply Quote 0
        • First post
          Last post
        Copyright 2025 Rubicon Communications LLC (Netgate). All rights reserved.
          This community forum collects and processes your personal information.
          consent.not_received