CPU Usage when network used
-
@tman222 said in CPU Usage when network used:
hw.intr_storm_threshold
Hi there,
I have set hw.intr_storm_threshold to 8000 which was a value I saw recommended before. I do not see any noticeable difference. I did also try 1 test with P16 and 10000 but it also did not appear any different so stopped.
I also set isr dispatch to direct? I was not clear if that was the default or not. Also did not appear to do anything. :p
In regards to CPU core usage. I believe usage looks some-what similar to tests done earlier with most core's not really being utilized all that much. PPS similar to what I already posted and thus wont post again.
Here are some snippets...
-M 90 -P20 -T60last pid: 12425; load averages: 0.01, 0.13, 0.13 up 0+23:58:44 10:04:41 374 processes: 18 running, 248 sleeping, 108 waiting CPU 0: 0.0% user, 0.0% nice, 0.0% system, 11.9% interrupt, 88.1% idle CPU 1: 0.0% user, 0.0% nice, 0.0% system, 10.7% interrupt, 89.3% idle CPU 2: 0.0% user, 0.0% nice, 0.0% system, 18.6% interrupt, 81.4% idle CPU 3: 0.0% user, 0.0% nice, 0.0% system, 21.6% interrupt, 78.4% idle CPU 4: 0.0% user, 0.0% nice, 0.0% system, 16.5% interrupt, 83.5% idle CPU 5: 0.0% user, 0.0% nice, 0.0% system, 13.9% interrupt, 86.1% idle CPU 6: 0.0% user, 0.0% nice, 0.0% system, 19.6% interrupt, 80.4% idle CPU 7: 0.0% user, 0.0% nice, 0.0% system, 19.6% interrupt, 80.4% idle CPU 8: 0.0% user, 0.0% nice, 0.0% system, 0.0% interrupt, 100% idle CPU 9: 0.0% user, 0.0% nice, 0.0% system, 0.0% interrupt, 100% idle CPU 10: 0.0% user, 0.0% nice, 0.0% system, 0.0% interrupt, 100% idle CPU 11: 0.4% user, 0.0% nice, 0.0% system, 0.0% interrupt, 99.6% idle CPU 12: 0.0% user, 0.0% nice, 0.0% system, 0.0% interrupt, 100% idle CPU 13: 0.0% user, 0.0% nice, 0.0% system, 0.0% interrupt, 100% idle CPU 14: 0.0% user, 0.0% nice, 0.0% system, 0.0% interrupt, 100% idle CPU 15: 0.0% user, 0.0% nice, 0.0% system, 0.0% interrupt, 100% idle Mem: 40M Active, 232M Inact, 579M Wired, 40M Buf, 15G Free Swap: 3979M Total, 3979M Free-M 90 -P16 -T60
last pid: 87357;  load averages:  0.03,  0.12,  0.12    up 1+00:01:03  10:07:00
374 processes: 18 running, 248 sleeping, 108 waiting
CPU 0:   0.0% user,  0.0% nice,  0.0% system, 43.7% interrupt, 56.3% idle
CPU 1:   0.0% user,  0.0% nice,  0.0% system, 33.0% interrupt, 67.0% idle
CPU 2:   0.0% user,  0.0% nice,  0.0% system,  7.4% interrupt, 92.6% idle
CPU 3:   0.0% user,  0.0% nice,  0.0% system,  0.0% interrupt,  100% idle
CPU 4:   0.0% user,  0.0% nice,  0.0% system, 24.1% interrupt, 75.9% idle
CPU 5:   0.4% user,  0.0% nice,  0.0% system, 11.9% interrupt, 87.8% idle
CPU 6:   0.0% user,  0.0% nice,  0.0% system, 25.6% interrupt, 74.4% idle
CPU 7:   0.0% user,  0.0% nice,  0.0% system, 15.2% interrupt, 84.8% idle
CPU 8:   0.0% user,  0.0% nice,  0.0% system,  0.0% interrupt,  100% idle
CPU 9:   0.0% user,  0.0% nice,  0.0% system,  0.0% interrupt,  100% idle
CPU 10:  0.0% user,  0.0% nice,  0.0% system,  0.0% interrupt,  100% idle
CPU 11:  0.0% user,  0.0% nice,  0.0% system,  0.0% interrupt,  100% idle
CPU 12:  0.0% user,  0.0% nice,  0.0% system,  0.0% interrupt,  100% idle
CPU 13:  0.0% user,  0.0% nice,  0.0% system,  0.0% interrupt,  100% idle
CPU 14:  0.0% user,  0.0% nice,  0.0% system,  0.0% interrupt,  100% idle
CPU 15:  0.0% user,  0.0% nice,  0.0% system,  0.0% interrupt,  100% idle
Mem: 35M Active, 241M Inact, 579M Wired, 40M Buf, 15G Free
Swap: 3979M Total, 3979M Free
-M 90 -P2 -T60
last pid: 21234;  load averages:  0.28,  0.18,  0.14    up 1+00:02:14  10:08:11
374 processes: 21 running, 248 sleeping, 105 waiting
CPU 0:   0.0% user,  0.0% nice,  0.0% system,  0.0% interrupt,  100% idle
CPU 1:   0.0% user,  0.0% nice,  0.0% system,  0.0% interrupt,  100% idle
CPU 2:   0.0% user,  0.0% nice,  0.0% system, 50.0% interrupt, 50.0% idle
CPU 3:   0.0% user,  0.0% nice,  0.0% system, 82.2% interrupt, 17.8% idle
CPU 4:   0.0% user,  0.0% nice,  0.0% system,  0.0% interrupt,  100% idle
CPU 5:   0.0% user,  0.0% nice,  0.0% system, 45.6% interrupt, 54.4% idle
CPU 6:   0.0% user,  0.0% nice,  0.0% system,  0.0% interrupt,  100% idle
CPU 7:   0.0% user,  0.0% nice,  0.0% system,  0.0% interrupt,  100% idle
CPU 8:   0.0% user,  0.0% nice,  0.0% system,  0.0% interrupt,  100% idle
CPU 9:   0.0% user,  0.0% nice,  0.0% system,  0.0% interrupt,  100% idle
CPU 10:  0.0% user,  0.0% nice,  0.0% system,  0.0% interrupt,  100% idle
CPU 11:  0.0% user,  0.0% nice,  0.0% system,  0.0% interrupt,  100% idle
CPU 12:  0.0% user,  0.0% nice,  0.0% system,  0.0% interrupt,  100% idle
CPU 13:  0.0% user,  0.0% nice,  0.4% system,  0.0% interrupt, 99.6% idle
CPU 14:  0.0% user,  0.0% nice,  0.0% system,  0.0% interrupt,  100% idle
CPU 15:  0.0% user,  0.0% nice,  0.0% system,  0.0% interrupt,  100% idle
Mem: 35M Active, 241M Inact, 579M Wired, 40M Buf, 15G Free
Swap: 3979M Total, 3979M Free
-M 90 -P100 -T60
last pid: 84603;  load averages:  0.67,  0.31,  0.20    up 1+00:03:53  10:09:50
374 processes: 18 running, 248 sleeping, 108 waiting
CPU 0:   0.0% user,  0.0% nice,  0.0% system, 26.7% interrupt, 73.3% idle
CPU 1:   0.0% user,  0.0% nice,  0.0% system, 21.2% interrupt, 78.8% idle
CPU 2:   0.0% user,  0.0% nice,  0.0% system, 19.2% interrupt, 80.8% idle
CPU 3:   0.0% user,  0.0% nice,  0.0% system, 15.7% interrupt, 84.3% idle
CPU 4:   0.0% user,  0.0% nice,  0.0% system, 20.4% interrupt, 79.6% idle
CPU 5:   0.0% user,  0.0% nice,  0.0% system, 19.6% interrupt, 80.4% idle
CPU 6:   0.0% user,  0.0% nice,  0.0% system, 22.0% interrupt, 78.0% idle
CPU 7:   0.0% user,  0.0% nice,  0.0% system, 22.0% interrupt, 78.0% idle
CPU 8:   0.0% user,  0.0% nice,  0.0% system,  0.0% interrupt,  100% idle
CPU 9:   0.0% user,  0.0% nice,  0.0% system,  0.0% interrupt,  100% idle
CPU 10:  0.0% user,  0.0% nice,  0.0% system,  0.0% interrupt,  100% idle
CPU 11:  0.0% user,  0.0% nice,  0.0% system,  0.0% interrupt,  100% idle
CPU 12:  0.0% user,  0.0% nice,  0.0% system,  0.0% interrupt,  100% idle
CPU 13:  0.0% user,  0.0% nice,  0.0% system,  0.0% interrupt,  100% idle
CPU 14:  0.0% user,  0.0% nice,  0.0% system,  0.0% interrupt,  100% idle
CPU 15:  0.0% user,  0.0% nice,  0.0% system,  0.0% interrupt,  100% idle
Mem: 35M Active, 241M Inact, 579M Wired, 40M Buf, 15G Free
Swap: 3979M Total, 3979M Free
with pf disabled and P16 does not look any different.
last pid: 17311;  load averages:  0.36,  0.33,  0.22    up 1+00:05:27  10:11:24
373 processes: 25 running, 247 sleeping, 101 waiting
CPU 0:   0.0% user,  0.0% nice,  0.0% system, 26.1% interrupt, 73.9% idle
CPU 1:   0.0% user,  0.0% nice,  0.0% system, 31.7% interrupt, 68.3% idle
CPU 2:   0.0% user,  0.0% nice,  0.0% system, 29.1% interrupt, 70.9% idle
CPU 3:   0.0% user,  0.0% nice,  0.0% system, 16.8% interrupt, 83.2% idle
CPU 4:   0.0% user,  0.0% nice,  0.0% system, 40.3% interrupt, 59.7% idle
CPU 5:   0.0% user,  0.0% nice,  0.0% system, 25.4% interrupt, 74.6% idle
CPU 6:   0.0% user,  0.0% nice,  0.0% system, 39.9% interrupt, 60.1% idle
CPU 7:   0.0% user,  0.0% nice,  0.0% system, 34.0% interrupt, 66.0% idle
CPU 8:   0.0% user,  0.0% nice,  0.0% system,  0.0% interrupt,  100% idle
CPU 9:   0.0% user,  0.0% nice,  0.0% system,  0.0% interrupt,  100% idle
CPU 10:  0.0% user,  0.0% nice,  0.0% system,  0.0% interrupt,  100% idle
CPU 11:  0.0% user,  0.0% nice,  0.4% system,  0.0% interrupt, 99.6% idle
CPU 12:  0.0% user,  0.0% nice,  0.0% system,  0.0% interrupt,  100% idle
CPU 13:  0.0% user,  0.0% nice,  0.0% system,  0.0% interrupt,  100% idle
CPU 14:  0.0% user,  0.0% nice,  0.0% system,  0.0% interrupt,  100% idle
CPU 15:  0.0% user,  0.0% nice,  0.0% system,  0.0% interrupt,  100% idle
Mem: 35M Active, 241M Inact, 579M Wired, 40M Buf, 15G Free
Swap: 3979M Total, 3979M Free
I have not removed PPPoE at this time as its not really something I want to do as it will be somewhat more destructive.
Cheers!
-
Thanks @qwaven - I appreciate the update. Something still seems amiss here: When I run an iperf test and keep increasing the number of parallel streams, the cores on my pfSense system eventually all become fully loaded down. From the data in your last reply, it seems the majority of your cores still sit idle no matter how many streams you choose to use. I don't use pppoe on my system, but wanted to make sure that having it enabled wasn't somehow limiting the total capabilities of your system (this why I asked for you to temporarily try testing without it enabled just to see if there was any difference in performance).
If you don't mind, there's one other thing that would be good to see right now: Could you please post the output of "netstat -Q" for us?
Thanks in again and hope this helps.
-
Hi there,
I am assuming -Q is relevant at anytime? I have not done anything other than enter the command.
netstat -Q
Configuration:
Setting                        Current        Limit
Thread count                        16           16
Default queue limit                256        10240
Dispatch policy                 direct          n/a
Threads bound to CPUs         disabled          n/a

Protocols:
Name   Proto QLimit Policy Dispatch Flags
ip         1   3000   flow  default   ---
igmp       2    256 source  default   ---
rtsock     3   1024 source  default   ---
arp        4    256 source  default   ---
ether      5    256 source   direct   ---
ip6        6    256   flow  default   ---

Workstreams:
WSID CPU   Name     Len WMark   Disp'd  HDisp'd   QDrops   Queued  Handled
   0   0   ip         0   945  3899897        0        0 32668248 36568145
   0   0   igmp       0     3        0        0        0        6        6
   0   0   rtsock     0     5        0        0        0      850      850
   0   0   arp        0     0     1266        0        0        0     1266
   0   0   ether      0     0 101484612        0        0        0 101484612
   0   0   ip6        0     0        0        0        0        0        0
   1   1   ip         0   552  2405223        0        0  5549277  7954500
   1   1   igmp       0     0        0        0        0        0        0
   1   1   rtsock     0     0        0        0        0        0        0
   1   1   arp        0     1        0        0        0     2883     2883
   1   1   ether      0     0 23487698        0        0        0 23487698
   1   1   ip6        0     0        0        0        0        0        0
   2   2   ip         0   939  3450247        0        0  7992399 11442646
   2   2   igmp       0     0        0        0        0        0        0
   2   2   rtsock     0     0        0        0        0        0        0
   2   2   arp        0     0        0        0        0        0        0
   2   2   ether      0     0 52851635        0        0        0 52851635
   2   2   ip6        0     0        0        0        0        0        0
   3   3   ip         0  1848  3627402        0        0 15327765 18955167
   3   3   igmp       0     0        0        0        0        0        0
   3   3   rtsock     0     0        0        0        0        0        0
   3   3   arp        0     0        0        0        0        0        0
   3   3   ether      0     0 83754924        0        0        0 83754924
   3   3   ip6        0     0        0        0        0        0        0
   4   4   ip         0  1934  3000592        0        0 12546591 15547183
   4   4   igmp       0     0        0        0        0        0        0
   4   4   rtsock     0     0        0        0        0        0        0
   4   4   arp        0     1        0        0        0       15       15
   4   4   ether      0     0 35382809        0        0        0 35382809
   4   4   ip6        0     0        0        0        0        0        0
   5   5   ip         0  2043  2925436        0        0 11129328 14054764
   5   5   igmp       0     0        0        0        0        0        0
   5   5   rtsock     0     0        0        0        0        0        0
   5   5   arp        0     0        0        0        0        0        0
   5   5   ether      0     0 42080649        0        0        0 42080649
   5   5   ip6        0     0        0        0        0        0        0
   6   6   ip         0  2013  2767600        0        0 18088497 20856097
   6   6   igmp       0     0        0        0        0        0        0
   6   6   rtsock     0     0        0        0        0        0        0
   6   6   arp        0     0        0        0        0        0        0
   6   6   ether      0     0 73731512        0        0        0 73731512
   6   6   ip6        0     0        0        0        0        0        0
   7   7   ip         0   976  2383106        0        0  7019003  9402109
   7   7   igmp       0     0        0        0        0        0        0
   7   7   rtsock     0     0        0        0        0        0        0
   7   7   arp        0     0        0        0        0        0        0
   7   7   ether      0     0 39100484        0        0        0 39100484
   7   7   ip6        0     1        0        0        0        4        4
   8   8   ip         0   868        0        0        0 28748443 28748443
   8   8   igmp       0     0        0        0        0        0        0
   8   8   rtsock     0     0        0        0        0        0        0
   8   8   arp        0     0        0        0        0        0        0
   8   8   ether      0     0        0        0        0        0        0
   8   8   ip6        0     0        0        0        0        0        0
   9   9   ip         0   886        0        0        0  7866336  7866336
   9   9   igmp       0     0        0        0        0        0        0
   9   9   rtsock     0     0        0        0        0        0        0
   9   9   arp        0     0        0        0        0        0        0
   9   9   ether      0     0        0        0        0        0        0
   9   9   ip6        0     0        0        0        0        0        0
  10  10   ip         0  1922        0        0        0 18281823 18281823
  10  10   igmp       0     0        0        0        0        0        0
  10  10   rtsock     0     0        0        0        0        0        0
  10  10   arp        0     0        0        0        0        0        0
  10  10   ether      0     0        0        0        0        0        0
  10  10   ip6        0     0        0        0        0        0        0
  11  11   ip         0  1675        0        0        0 25873794 25873794
  11  11   igmp       0     0        0        0        0        0        0
  11  11   rtsock     0     0        0        0        0        0        0
  11  11   arp        0     0        0        0        0        0        0
  11  11   ether      0     0        0        0        0        0        0
  11  11   ip6        0     0        0        0        0        0        0
  12  12   ip         0   842        0        0        0  4971446  4971446
  12  12   igmp       0     0        0        0        0        0        0
  12  12   rtsock     0     0        0        0        0        0        0
  12  12   arp        0     1        0        0        0    14660    14660
  12  12   ether      0     0        0        0        0        0        0
  12  12   ip6        0     0        0        0        0        0        0
  13  13   ip         0  1035        0        0        0 10699300 10699300
  13  13   igmp       0     0        0        0        0        0        0
  13  13   rtsock     0     0        0        0        0        0        0
  13  13   arp        0     1        0        0        0     1341     1341
  13  13   ether      0     0        0        0        0        0        0
  13  13   ip6        0     0        0        0        0        0        0
  14  14   ip         0   992        0        0        0 19460583 19460583
  14  14   igmp       0     0        0        0        0        0        0
  14  14   rtsock     0     0        0        0        0        0        0
  14  14   arp        0     0        0        0        0        0        0
  14  14   ether      0     0        0        0        0        0        0
  14  14   ip6        0     0        0        0        0        0        0
  15  15   ip         0  1169        0        0        0 13328102 13328102
  15  15   igmp       0     0        0        0        0        0        0
  15  15   rtsock     0     0        0        0        0        0        0
  15  15   arp        0     0        0        0        0        0        0
  15  15   ether      0     0        0        0        0        0        0
  15  15   ip6        0     0        0        0        0        0        0
Cheers!
-
Thanks @qwaven - I appreciate the additional info. Your numbers in the WMark (Watermark) column are a lot higher than what I see, but I'm not 100% sure how to interpret that. For instance, is this the amount of packets that crossed the water mark or is this a global limit? I think @stephenw10 or someone else with a better knowledge of the FreeBSD networking stack might be able to set shed some more light on these statistics.
After some additional thought, seeing the queue statistics on your ix and igb interfaces might also be useful.
For RX Stats:
sysctl -a | grep rx_packetsFor TX Stats:
sysctl -a | grep tx_packetsand then post the tx and rx queue statistics for all active igb and ix interfaces. How are packets distributed across the tx and rx queues for all the different interfaces that are currently active?
Thanks in advance and hope this helps.
-
@tman222 said in CPU Usage when network used:
sysctl -a | grep rx_packets
sysctl -a | grep rx_packets
dev.ix.3.queue7.rx_packets: 6387858
dev.ix.3.queue6.rx_packets: 6755233
dev.ix.3.queue5.rx_packets: 7452156
dev.ix.3.queue4.rx_packets: 5690876
dev.ix.3.queue3.rx_packets: 5994398
dev.ix.3.queue2.rx_packets: 6624108
dev.ix.3.queue1.rx_packets: 8177888
dev.ix.3.queue0.rx_packets: 8585302
dev.ix.2.queue7.rx_packets: 0
dev.ix.2.queue6.rx_packets: 0
dev.ix.2.queue5.rx_packets: 0
dev.ix.2.queue4.rx_packets: 0
dev.ix.2.queue3.rx_packets: 0
dev.ix.2.queue2.rx_packets: 0
dev.ix.2.queue1.rx_packets: 0
dev.ix.2.queue0.rx_packets: 0
dev.ix.1.queue7.rx_packets: 16551499
dev.ix.1.queue6.rx_packets: 33534177
dev.ix.1.queue5.rx_packets: 17563120
dev.ix.1.queue4.rx_packets: 15072354
dev.ix.1.queue3.rx_packets: 39145147
dev.ix.1.queue2.rx_packets: 23228763
dev.ix.1.queue1.rx_packets: 7950923
dev.ix.1.queue0.rx_packets: 41279340
dev.ix.0.queue7.rx_packets: 22
dev.ix.0.queue6.rx_packets: 210025
dev.ix.0.queue5.rx_packets: 43
dev.ix.0.queue4.rx_packets: 861
dev.ix.0.queue3.rx_packets: 26
dev.ix.0.queue2.rx_packets: 15
dev.ix.0.queue1.rx_packets: 29
dev.ix.0.queue0.rx_packets: 23467772
sysctl -a | grep tx_packets
dev.ix.3.queue7.tx_packets: 16140452
dev.ix.3.queue6.tx_packets: 33202115
dev.ix.3.queue5.tx_packets: 17090472
dev.ix.3.queue4.tx_packets: 14520542
dev.ix.3.queue3.tx_packets: 38602349
dev.ix.3.queue2.tx_packets: 22896318
dev.ix.3.queue1.tx_packets: 7152241
dev.ix.3.queue0.tx_packets: 57226399
dev.ix.2.queue7.tx_packets: 0
dev.ix.2.queue6.tx_packets: 0
dev.ix.2.queue5.tx_packets: 0
dev.ix.2.queue4.tx_packets: 0
dev.ix.2.queue3.tx_packets: 0
dev.ix.2.queue2.tx_packets: 0
dev.ix.2.queue1.tx_packets: 0
dev.ix.2.queue0.tx_packets: 0
dev.ix.1.queue7.tx_packets: 4275957
dev.ix.1.queue6.tx_packets: 4377190
dev.ix.1.queue5.tx_packets: 3828586
dev.ix.1.queue4.tx_packets: 2886044
dev.ix.1.queue3.tx_packets: 4404683
dev.ix.1.queue2.tx_packets: 5183075
dev.ix.1.queue1.tx_packets: 5869218
dev.ix.1.queue0.tx_packets: 11726952
dev.ix.0.queue7.tx_packets: 2607146
dev.ix.0.queue6.tx_packets: 2812508
dev.ix.0.queue5.tx_packets: 4187141
dev.ix.0.queue4.tx_packets: 3436090
dev.ix.0.queue3.tx_packets: 2184920
dev.ix.0.queue2.tx_packets: 1856375
dev.ix.0.queue1.tx_packets: 3202041
dev.ix.0.queue0.tx_packets: 4121751
Cheers!
-
Hi @qwaven - thanks for the additional information. It looks like the packets are well distributed across the queues on the non pppoe interfaces, which is good. I apologize for not asking you this in the previous post, but could you please also give us the output of "netstat -m" Thanks again.
-
netstat -m
106492/19253/125745 mbufs in use (current/cache/total)
98297/10023/108320/1000000 mbuf clusters in use (current/cache/total/max)
98297/9987 mbuf+clusters out of packet secondary zone in use (current/cache)
0/24/24/524288 4k (page size) jumbo clusters in use (current/cache/total/max)
0/0/0/524288 9k jumbo clusters in use (current/cache/total/max)
0/0/0/84549 16k jumbo clusters in use (current/cache/total/max)
223217K/24955K/248172K bytes allocated to network (current/cache/total)
0/0/0 requests for mbufs denied (mbufs/clusters/mbuf+clusters)
0/0/0 requests for mbufs delayed (mbufs/clusters/mbuf+clusters)
0/0/0 requests for jumbo clusters delayed (4k/9k/16k)
0/0/0 requests for jumbo clusters denied (4k/9k/16k)
0 sendfile syscalls
0 sendfile syscalls completed without I/O request
0 requests for I/O initiated by sendfile
0 pages read by sendfile as part of a request
0 pages were valid at time of a sendfile request
0 pages were requested for read ahead by applications
0 pages were read ahead by sendfile
0 times sendfile encountered an already busy page
0 requests for sfbufs denied
0 requests for sfbufs delayed
Cheers!
-
Hi @qwaven - those mbuf cluster number also look good. After thinking about this a bit more and doing some more reading, I am starting to believe that we're hitting some sort of I/O constraint here (whether real or artificial). Have a look at these two sites:
https://calomel.org/network_performance.html
https://bsdrp.net/documentation/examples/forwarding_performance_lab_of_a_superserver_5018a-ftn4_with_10-gigabit_chelsio_t540-crWhat's interesting to me about the BSDRP page in particular is that the benchmark hardware was a previous generation Intel Atom CPU with half as many cores, yet the throughput was approximately twice as high (even under pure forwarding conditions, i.e. no pf, ipf, or ipfw enabled). I realize the tests were done on FreeBSD 11.1 vs. pfSense, but I wouldn't expect the difference between the two under normal circumstances to be this drastic.
Having said that, I'm not sure if the limitations that you're seeing are due to having pppoe enabled on the system or there is some type of limitation with the onboard 10Gbit ports. One thing that might be worth trying is duplicating the iperf3 tests, but using the Chelsio NIC instead to see if there is any difference in throughput.
Other than that, I'm basically out of ideas now on this one. Perhaps the other responders in this thread will have some more thoughts on what to try. Thanks again sharing the additional data with us, and hope this helps.
-
Well I've done this. I popped the chelsio in. Steps after:
- Moved JUST the NAS to the chelsio, no change (no vlan)
- Moved the test box/network to the chelsio, no change (no vlan)
- Started playing with the options in PFSense
i) adjusted the firewall policy to aggressive (was normal) , possibly saw marginal increase with parallel streams but not enough to really mention.
ii) Disabled "insert stronger ID..." and let the races start! :)
Immediately speeds are improved. I can't quite get as good as without PF at all but its def a lot better. I am unclear if this option is default enabled in PF or not?
With 6 streams:
[SUM] 0.00-10.00 sec 8.79 GBytes 7.55 Gbits/sec 1784 sender
[SUM] 0.00-10.00 sec 8.77 GBytes 7.53 Gbits/sec receiverSaw some spikes above 9.
I suspect it is not 100% required to use the chelsio card but actually may see even further speed increases if I move one network back to the built in which I imagine would be using different PCIe lanes than the addon card.
Also keep in mind I have done no modifications like previously done so flow control appears active...etc.
Some more numbers:
last pid: 10762;  load averages:  0.87,  0.33,  0.26    up 0+00:43:07  11:32:13
400 processes: 22 running, 256 sleeping, 122 waiting
CPU 0:   0.0% user,  0.4% nice,  0.8% system,  4.3% interrupt, 94.5% idle
CPU 1:   0.0% user,  0.4% nice,  1.6% system, 10.6% interrupt, 87.5% idle
CPU 2:   0.0% user,  0.4% nice,  1.2% system, 60.4% interrupt, 38.0% idle
CPU 3:   0.0% user,  0.0% nice,  0.4% system,  7.5% interrupt, 92.2% idle
CPU 4:   0.0% user,  0.8% nice,  0.0% system,  9.0% interrupt, 90.2% idle
CPU 5:   0.0% user,  0.4% nice,  1.2% system, 34.8% interrupt, 63.7% idle
CPU 6:   0.0% user,  0.0% nice,  0.0% system, 21.2% interrupt, 78.8% idle
CPU 7:   0.0% user,  0.8% nice,  0.8% system, 37.3% interrupt, 61.2% idle
CPU 8:   0.0% user,  0.4% nice,  0.0% system, 37.3% interrupt, 62.4% idle
CPU 9:   0.0% user,  0.4% nice,  0.4% system, 29.0% interrupt, 70.2% idle
CPU 10:  0.0% user,  0.0% nice,  0.8% system, 17.3% interrupt, 82.0% idle
CPU 11:  0.0% user,  0.0% nice,  1.2% system, 34.1% interrupt, 64.7% idle
CPU 12:  0.0% user,  0.0% nice,  0.4% system, 23.9% interrupt, 75.7% idle
CPU 13:  0.0% user,  0.8% nice,  0.0% system, 13.7% interrupt, 85.5% idle
CPU 14:  0.0% user,  0.0% nice,  0.0% system, 48.2% interrupt, 51.8% idle
CPU 15:  0.0% user,  0.4% nice,  0.0% system, 16.5% interrupt, 83.1% idle
Mem: 115M Active, 168M Inact, 675M Wired, 41M Buf, 15G Free
Swap: 3979M Total, 3979M Free
iperf3 -M90 -P10
        input        (Total)           output
packets  errs idrops      bytes    packets  errs      bytes colls
  719k     0     0        98M       719k     0        98M     0
  716k     0     0        98M       716k     0        98M     0
  721k     0     0        99M       721k     0        99M     0
  710k     0     0        97M       710k     0        97M     0
  720k     0     0        99M       720k     0        99M     0
Cheers!
-
@qwaven - that's great news!!
I just checked on my pfSense box and I do not see the "IP Random ID generation" option enabled. I don't believe it's enabled by default either. Any idea how it might have become enabled on your system?
In any case, those throughput numbers look a lot better and are more in line with what I was expecting for your C3000 based hardware originally. If you have some time, feel free to re-run some of the iperf3 tests from earlier in this thread to see where the pps limits are now -- I imagine you should be closer to 1M pps with pf enabled and potentially well above 2M pps with pf turned off.
Anyway, I'm glad this finally resolved. I'll be honest, I probably would have never have thought of the "IP Random ID generation" option :). But good to know now for future reference.
-
If its not on by default I must have enabled it during my initial setup way back when I was on the other hardware even. The description does make it sound like it should be a good thing to have enabled. I'm a bit surprised that it would be capable of throttling the throughput so much. I'm guessing it must function in some sort of single thread which would make sense why my CPU cores were not utilized very evenly before. In the post above it looks more distributed to me.
The 719k is my iperf3 test. I did a few different P# options and based on the different numbers it seems to level out about 7xxk.
Cheers!
-
Not read all 3 pages, just page 1 so far, here is my initial thoughts.
As has been stated PPPoE is a cpu hog, compared to other protocols it is cpu heavy and single threaded.
You do have multiple queues configured on nic which is good tho.
Check RSS status with netstat -Q.
Try disabling PTI (meltdown mitigation), is an option in the UI to disable it, and reboot after disabling it to apply it.
PowerD should enable turbo clocks, so if that isnt working I expect its disabled in the bios.
With all this said I dont know what you can expect out of PPPoE on that chip, especially if you also using NAT, so I got no idea what the baseline expected performance is.
-
Thanks for the reply chrcoluk. However, I think we've managed to figure things out.
Thanks all for all the help/support with this. I think things have been concluded well enough. Lots of learning! :)
Cheers!
-
So what numbers did/do you achieve now with those 10G interfaces? Copper/SFP+ modules? And what changes/values from sysctl or loader.conf.local did you set for it?
-
Hi,
The numbers I got were posted earlier. The changes I made to the loader/sysctl for the most part do not seem to have changed much. The speed increase happened once I turned off the option to insert a stronger ID.
For reference here are the system tunables page (sysctl) and boot/loader.conf.local file. Most of which is now commented out and/or for the built in interface card and not the chelsio. :p
#Improve Cache size
hw.ix.rxd="4096"
hw.ix.txd="4096"
#Change processing limit -1 is unlimited
hw.ix.tx_process_limit="-1"
hw.ix.rx_process_limit="-1"
#Set the queues to cores
#hw.ix.num_queues="16"
#force flow control settings 0 to disable.
hw.ix.flow_control="0"
dev.ix.0.fc=0
dev.ix.1.fc=0
dev.ix.2.fc=0
dev.ix.3.fc=0
#disable cache connection detail
#net.inet.tcp.hostcache.cachelimit="0"
#ensure HT is disabled
machdep.hyperthreading_allowed="0"
#enable optimized version of soreceive
#net.inet.tcp.soreceive_stream="1"
#unlimited isr threads to maximize all core use
#net.isr.maxthreads="-1"
#net.isr.bindthreads="1"
#use msix instead
#hw.ix.enable_msix="1"
#use aim to improve efficency on network stack
#hw.ix.enable_aim="1"
#hw.ix.max_interrupt_rate="16000"
#increase max interrupts
#hw.intr_storm_threshold="9000"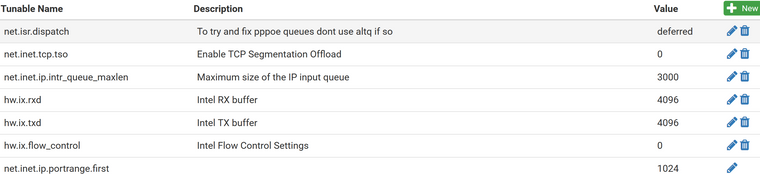
Hope that helps.
Cheers!