Netgate Discussion Forum
    • Categories
    • Recent
    • Tags
    • Popular
    • Users
    • Search
    • Register
    • Login

    CPU Usage

    Scheduled Pinned Locked Moved General pfSense Questions
    3 Posts 2 Posters 517 Views
    Loading More Posts
    • Oldest to Newest
    • Newest to Oldest
    • Most Votes
    Reply
    • Reply as topic
    Log in to reply
    This topic has been deleted. Only users with topic management privileges can see it.
    • R
      rustydusty1717
      last edited by

      Hello,

      Just curious if I should be relying on the CPU Usage on the dashboard or under Monitoring > System > Processor instead? Seeing consistently 10% CPU usage on the Dashboard however the monitoring page should never little usage, even looking at 1HR time period.

      Using the SG-3100 appliance.

      1 Reply Last reply Reply Quote 0
      • stephenw10S
        stephenw10 Netgate Administrator
        last edited by

        When you look at the monitoring graphs you will probably want to turn off the 'processes' line since that value is usually far higher swamping the other data.
        Then know that it is shown is utilisation number not percentage CPU used like the dashboard. So on the SG-3100, that has 2 CPU cores, a value of 2 would be 100% but it can be higher than that as it shows the CPU loading by demand. So you might see:

        Selection_816.png

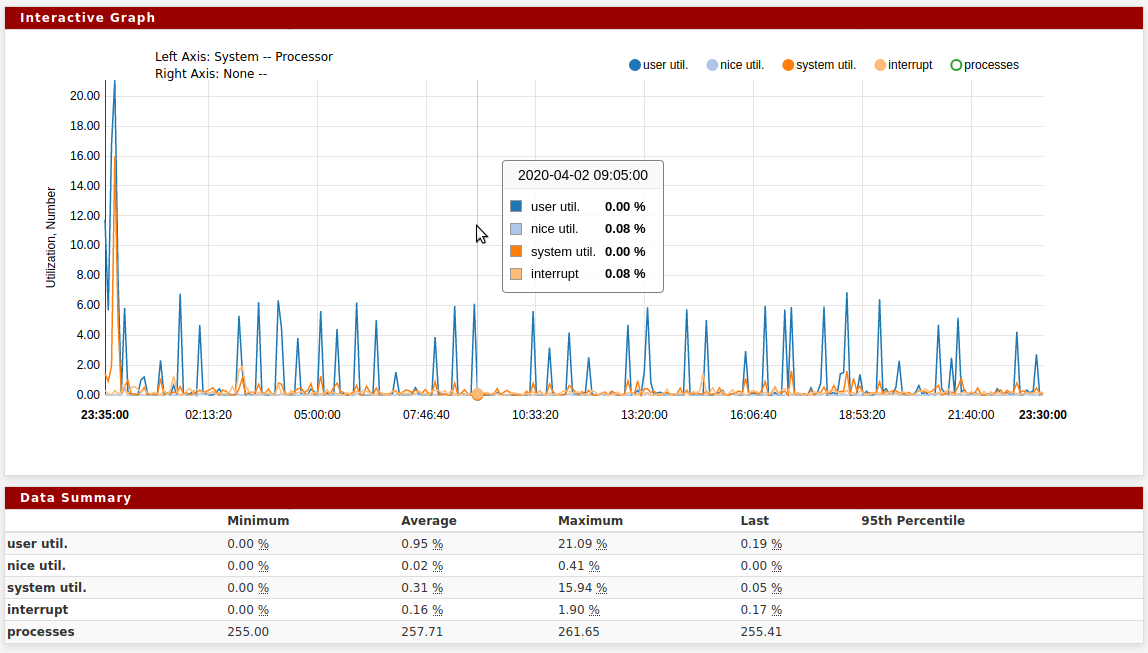
        To see actual CPU usage across the cores including what is using it check Diag > System Activity.

        Steve

        1 Reply Last reply Reply Quote 0
        • R
          rustydusty1717
          last edited by

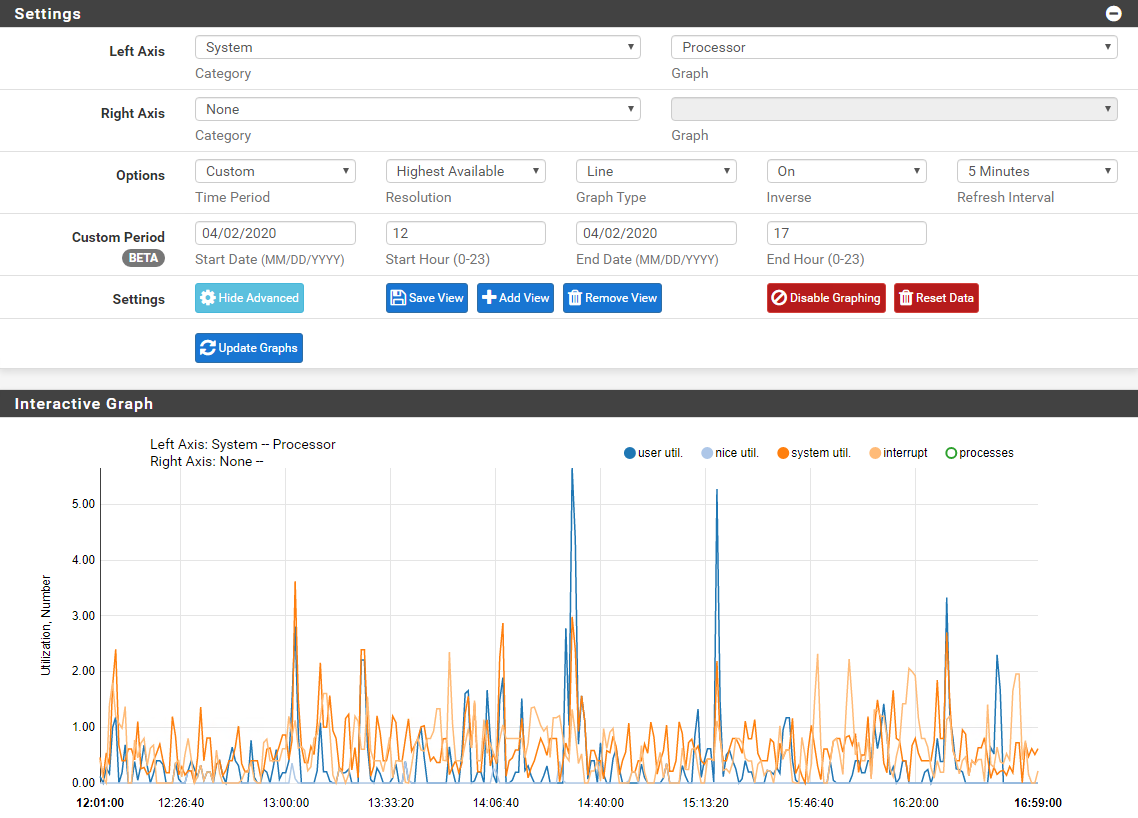
          Here's what I'm seeing. Custom view from 12PM - 5PM today. Processes has been removed from the graph.

          What I'm seeing here is not just barely 5% CPU?

          monitoring.PNG

          1 Reply Last reply Reply Quote 0
          • First post
            Last post
          Copyright 2025 Rubicon Communications LLC (Netgate). All rights reserved.