• Categories
  • Recent
  • Tags
  • Popular
  • Users
  • Search
  • Register
  • Login
Netgate Discussion Forum
  • Categories
  • Recent
  • Tags
  • Popular
  • Users
  • Search
  • Register
  • Login

Collect ntopng Data for Grafana and show Hosts on a Map not working

Scheduled Pinned Locked Moved General pfSense Questions
2 Posts 2 Posters 990 Views
Loading More Posts
  • Oldest to Newest
  • Newest to Oldest
  • Most Votes
Reply
  • Reply as topic
Log in to reply
This topic has been deleted. Only users with topic management privileges can see it.
  • E
    EddyT
    last edited by Apr 3, 2020, 11:08 AM

    Hello,

    I have pfSense running quite good and all is working kinda okay.
    I got one problem. I am collecting Data and transferring it over InfluxDB to a Machine
    running Grafana. As for now it all works but not the Map.
    It looks like this:
    Screenshot_2020-04-03 DPI - Grafana(1).png

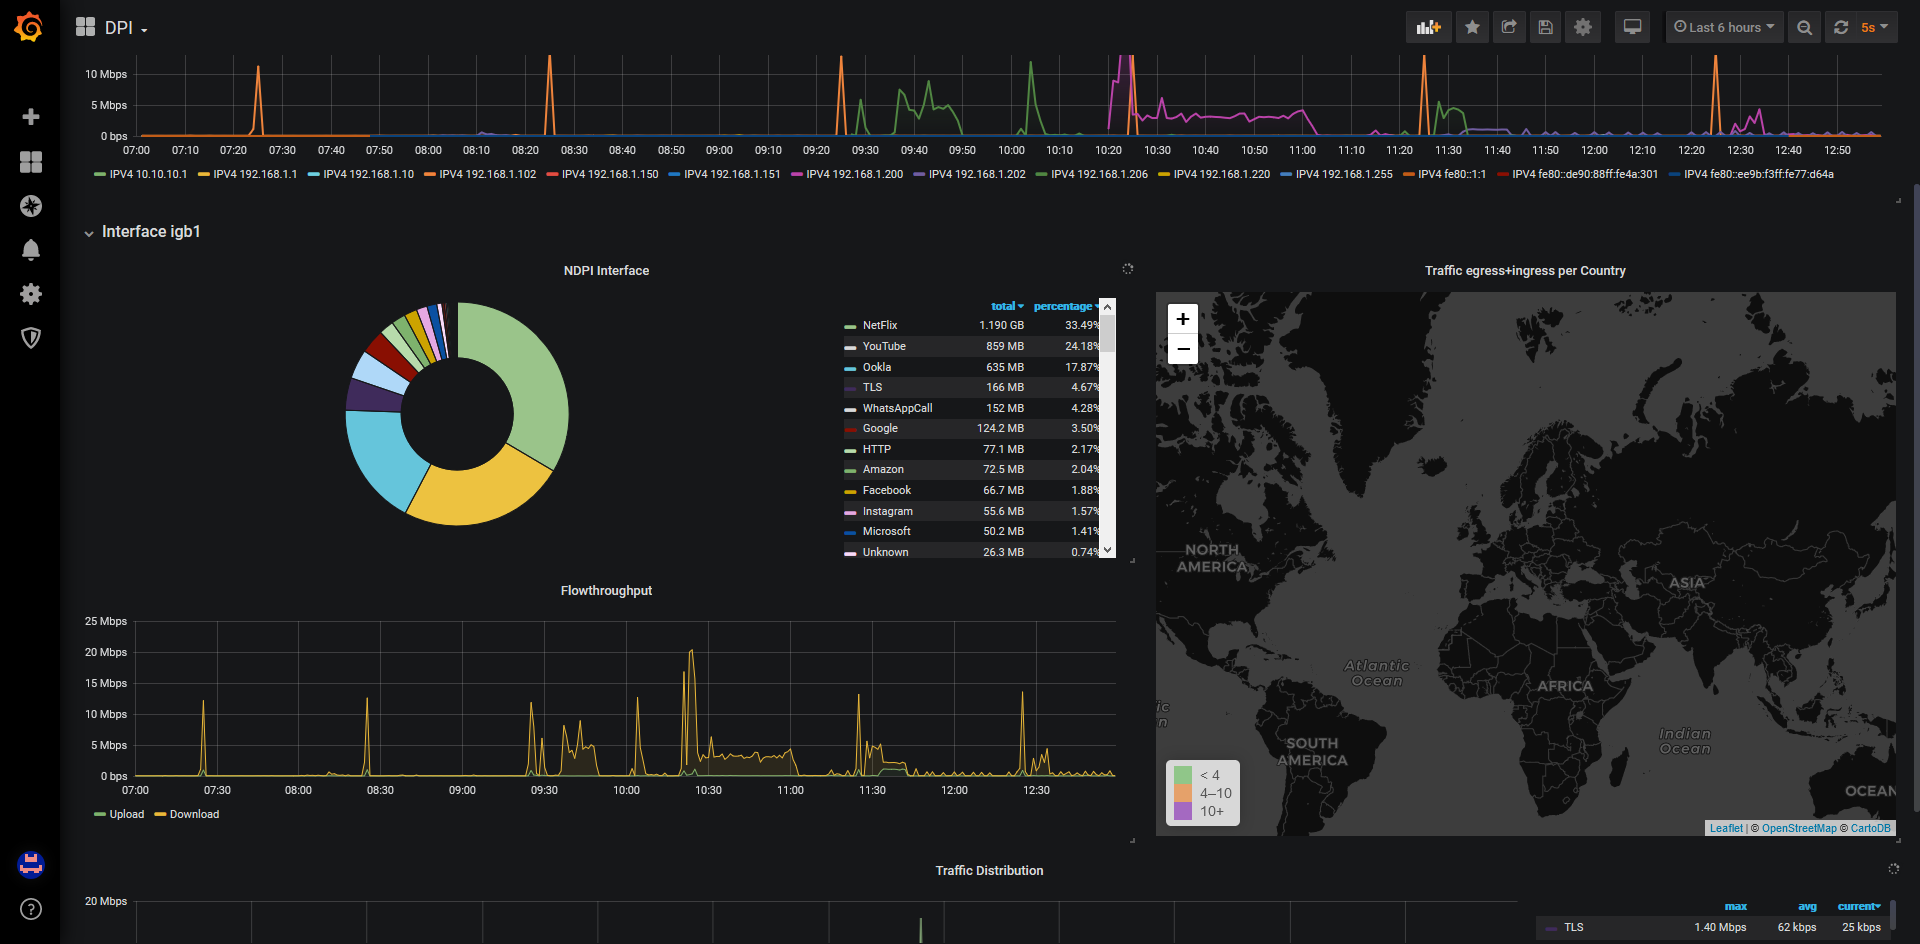
    Why isn´t it creating any Information on the Map? What do I have to check? I dont really understand Grafana so good maybe one of you can help me here.
    Please tell me what Info / Screenshots you need.

    Thanks very much and stay Healthy!

    P 1 Reply Last reply Nov 16, 2020, 9:02 PM Reply Quote 0
    • P
      pfsense99 @EddyT
      last edited by Nov 16, 2020, 9:02 PM

      @EddyT Hi - I am trying to create graphs with ntopng and pfsense like yours - do you mind to share your json

      1 Reply Last reply Reply Quote 0
      • First post
        Last post
      Copyright 2025 Rubicon Communications LLC (Netgate). All rights reserved.
        This community forum collects and processes your personal information.
        consent.not_received