Grafana Dashboard using Telegraf with additional plugins
-
@VictorRobellini I checked that, all clear.
I'll keep looking.
EDIT : I thought you were talking about the added junk that sometimes gets added to files when going back and forth through windows and linux, I don't see any of that when I vi the interfaces script (I do see it in the telegraf.conf file BTW but only with the entries from the extra config section of the GUI).
Are you saying that should be in there or that it shouldn't?
-
@bigjohns97 said in Grafana Dashboard using Telegraf with additional plugins:
On linux you can run "cat -A filename'. I don't think the cat in pfSense has the same capability. When in doubt, just the tr command against the file, all it should be doing is replacing the carriage returns, so running it on a valid file will have no impact. Even running it multuple times will have no impact. -
@VictorRobellini does that script work for you? if so, what version of pfSense are you running?
My research tells me that it will have to be re-written due to some new way that python converts certain data to bytes before sending, but I am not very knowledgeable about this stuff. I posted something to the github link from the original author to see if he knows what might be the issue.
-
https://gist.github.com/fastjack/a0feb792a9655da7aa3e2a7a1d9f812f
Looks like FastJack uploaded an edited version that works with PFS 2.4.5 that comes with python 3.7
-
@bigjohns97 Awesome! I'll update the repo shortly.
-
@bigjohns97 Thanks again, I've updated the repo with some basic instructions. How are you showing the measurements in the dashbord? When I tried converting from microseconds to milliseconds things didn't look right.
-
@VictorRobellini said in Grafana Dashboard using Telegraf with additional plugins:
@bigjohns97 Thanks again, I've updated the repo with some basic instructions. How are you showing the measurements in the dashbord? When I tried converting from microseconds to milliseconds things didn't look right.
I am using the default microseconds, I don't specify an ip address so it uses my WAN default gateway which does show in microseconds which I think is nice.
I really don't need to see 1ms it's more useful to 4-8 microseconds even though the difference is very small, kinda lets you know when you start reaching the limits of your connection.
BTW it looks like the graph will switch back to milliseconds as soon as the value gets that high and then it goes back to micro once things calm down.
-
I'm not sure if it's something on my system, but I needed to modify the telegraf_gateways.py script.
Changed this:
    print("gateways,gateway_name="+values[0]+" rtt="+str(int(values[1])/100.0)+ \
          ",rttsd="+str(int(values[2])/100.0)+",loss="+str(int(values[3]))+"i")
to this:
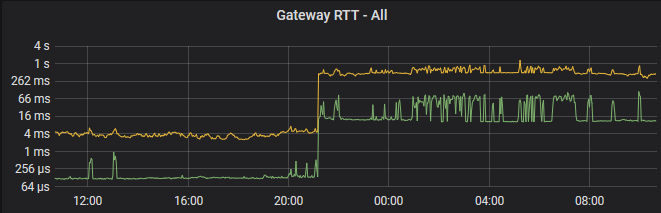
    print("gateways,gateway_name="+values[0]+" rtt="+str(int(values[1])/1.0)+ \
          ",rttsd="+str(int(values[2])/1.0)+",loss="+str(int(values[3]))+"i")
The figures displayed are now correct and match what is displayed on the pfsense dashboard.
- Green is my ISP connection, sits at ~10ms.
- Yellow is a VPN tunnel to the other side of the world and ~400ms is about right.
-
@JohnKap after actually pinging the address from a machine that shows below 1ms you are correct, I never went and actually checked the accuracy of this.
LOL at me thinking I had 8 microseconds to my first hop

-
@JohnKap I never understood the reason to /100. I just never took the time to dig deeper.
Thank you
-
Thanks for this Dashboard. I am just starting to have a play around with it and now have most things working.
My setup is IGB0.10 is my WAN and have this set in the variable
I have IGB1 and my LAN, IGB2 as my 10GB LAN, IGB1.30 as my IP Phone network and IGB1.40 as my Guest network.The WAN shows but in and out look the same on the graph but show different values.
For the LAN it only shows IGB0 and OPVNS1. Not sure where all the other LANS are or why it does not display them.This is my first look at Telegraf and InfluxDB so am a complete noob at it.
-
@veldthui I'm not sure I understand what's going on. Can you post a screenshot?
-
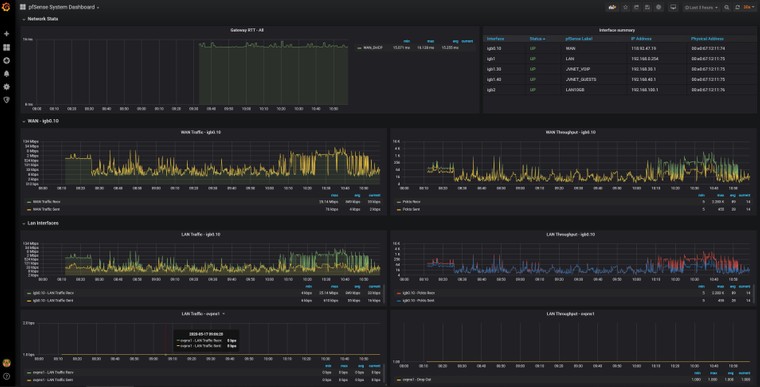
Attached is an image of the lower part which should show the WAN and LANs. It shows the WAN but does not look right and does not show the correct LANs
-
@veldthui Can you share how you have the interfaces defined in the grafana variable config?
-
@VictorRobellini Okay I worked out that the WAN only had one of the values multiplied by 8 to change it to bytes. Changed the other and it looks okay now.
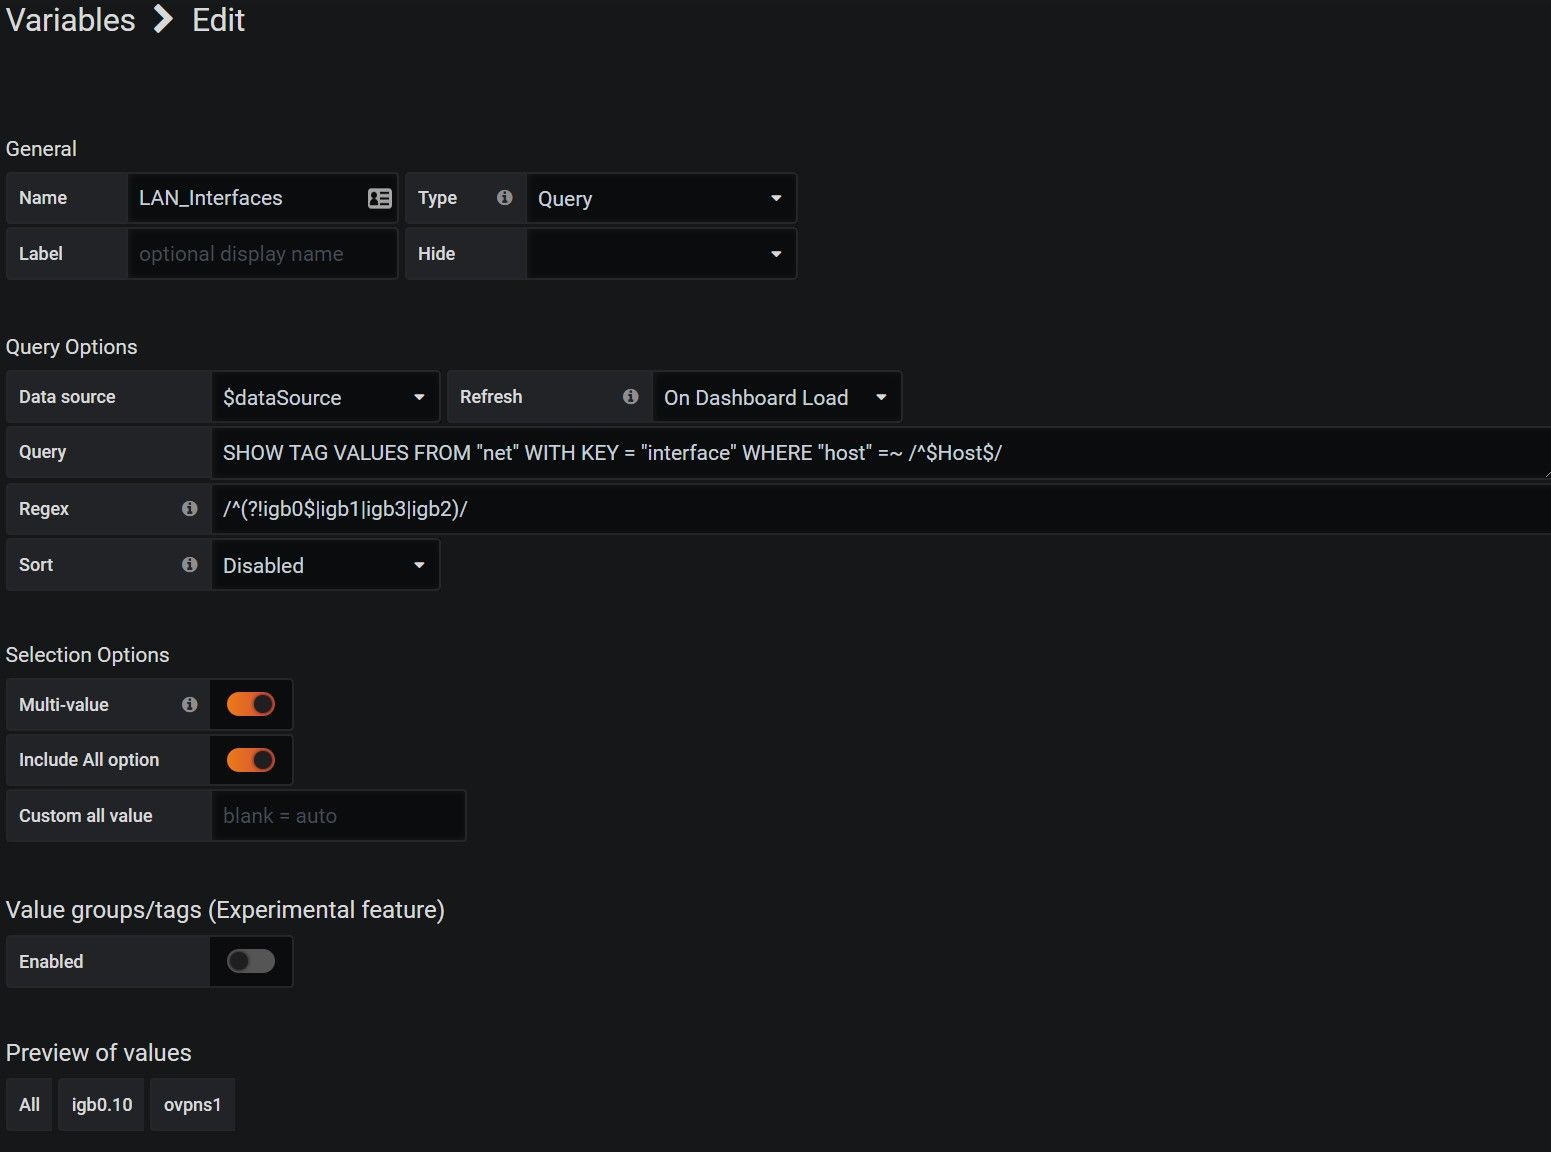
Below is the definition which is how it was downloaded. If I add a $ to igb1, igb2, and igb3 I can then see the igb1.30 and igb1.40 networks but not igb1 and igb0.10 should not be in the list as that is the WAN.
-
@veldthui said in Grafana Dashboard using Telegraf with additional plugins:
What is your Regex?
What adapter(s) is your WAN?
What adapters to you want displayed?Please take a look at the github page. There's plenty written up in the Readme
-
The regex is as above. My WAN is on the IGB0 adapter as VLAN 10 which shows as igb0.10.
I want to display this as the WAN which it is doing. For the LAN I want to display igb1, igb1.30, igb1.40, and igb2.
igb3 and igb4 are not in use at present but may be in future. I have read the readme file but it does not explain it very well. I have only very basic understanding of regex as well -
@veldthui said in Grafana Dashboard using Telegraf with additional plugins:
The content of the "Regex" field is the same as what I have posted to github and it does not match what you are saying.
Please review the content on Github, specifically the section titled, Configuration
If the instructions are unclear, please let me know what I can add to make them better. -
Okay I think I have finally worked it out. my regex now looks like /^(?!igb0)/ to filter out everything on igb0 and leave the rest showing. Appears to have worked.
Thanks for the help. -
any chance of an idiots guide (me = dummy) to installing this lot?
Tried from your Github page and first problem was the docker-compose example threw errors. So gave up.