Port forward to UDP 10000 is NOT working
-
Generally, I get angry with such posts, but this one brought a smile on my face - great sense of humour. :-)
You are right, when you know your stuff, it is a 2 min job but when you don't even 2 weeks is less (as in my case). I always thought networking is not my cup of tea as my core strength is Sys Admin, but then I was able to do a lot of stuff and got 2 environments up and running pretty well which gave me a false hope that I can do this sh!t... but clearly I am still not there - not yet.
I have been drinking as well and so I don't think this is the right time to touch the Prod environment, so I will give it a go tomorrow morning.
However, just so you know I tried packet capturing but I was unable to open the output file, it asks for some weird file type association and I am not able to open it at all. But never mind, I will try it again and report back to you SIR. Need to go back to my drinks - it's not nice to keep someone waiting... :-)
Thanks for getting back to me and give some pointers - appreciate it mate.
Thx: Rav
-
@raviktiwari said in Port forward to UDP 10000 is NOT working:
I have been drinking as well and so I don't think this is the right time to touch the Prod environment, so I will give it a go tomorrow morning.
That's a prerequisite in my shop... :)
But seriously.. pfsense port forwarding works just fine and is fairly easy to implement. So when someone comes along everyone here will and should get very matter of factly arrogant and corrective.. (to a point). There is no- it doesn't work on my implementation even if it does on every body else's. That said..
Remember-- Specifically WIndows but maybe others.. built in firewalls treat any "out of subnet address" as "public" and will block anything incoming. Yes if 192.168.2.1 is not in your subnet then it is public and untrusted. even if you think that firewall is off it is often not.
/diag_packet_capture.php is your friend.. Get to know it well. :)
-
Alright then, @chpalmer provoked me and I took a peek on Production systems....
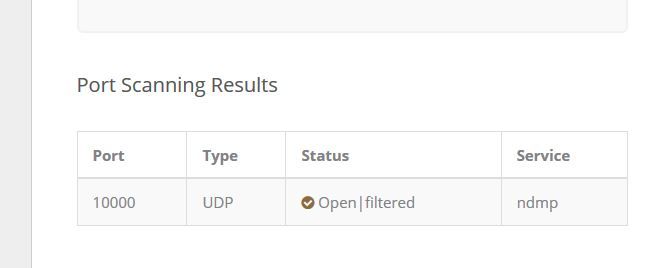
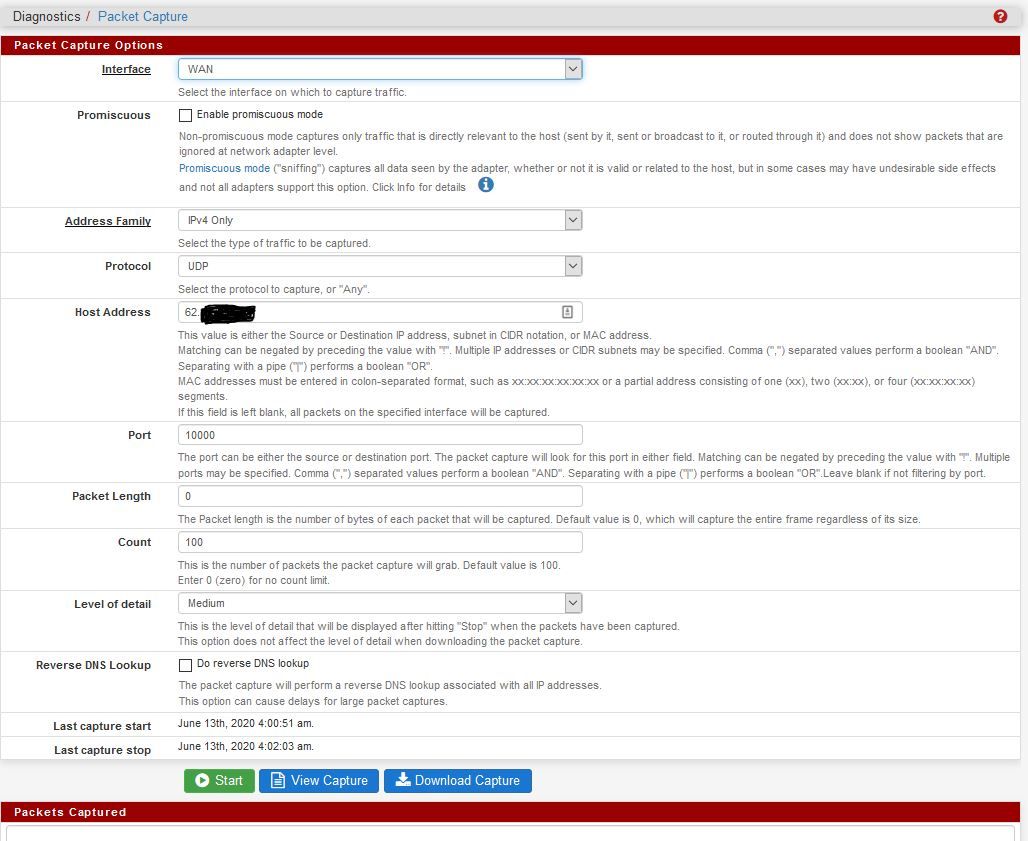
ipvoid shows all good on WAN port... so WAN port is listening and pfsense is doing what it has been asked to do (PFA the SS).
However, when I go to packet capture (WAN or LAN), I am unable to see any details in the box below and download has a .cap extension, which I am not sure how to open - does not open in notepad. PFA the SS for that as well.
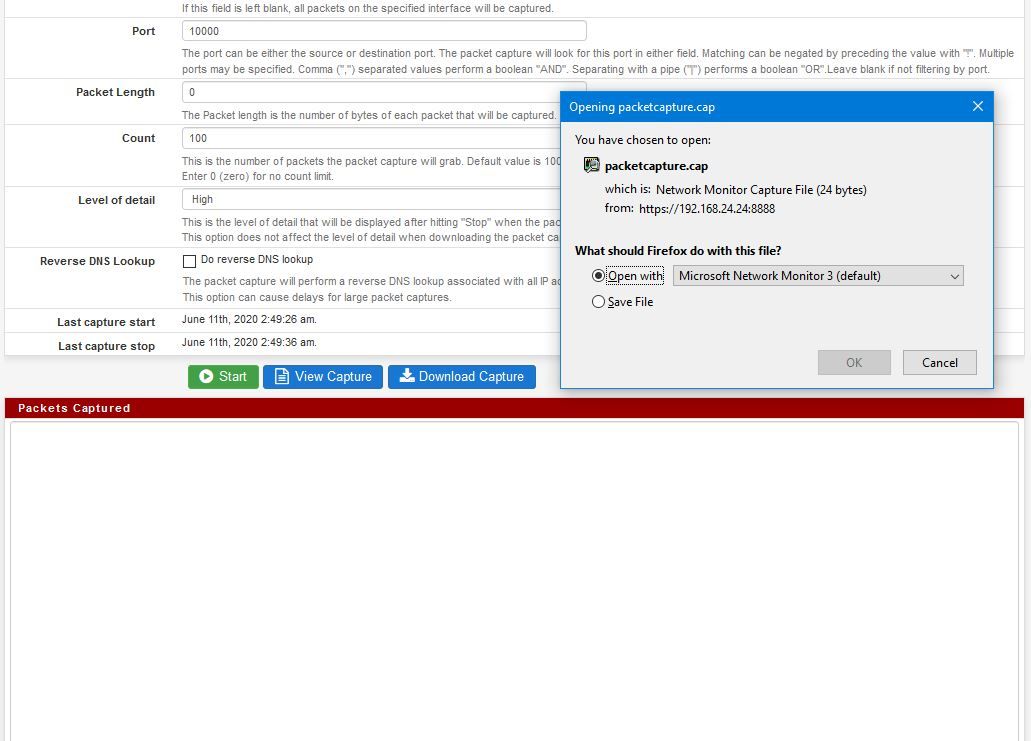
I am trying to install Wireshark assuming the downloaded files can be viewed in wireshark... but any idea how I can get the captured data displayed in the box below?
Thx: Rav
-
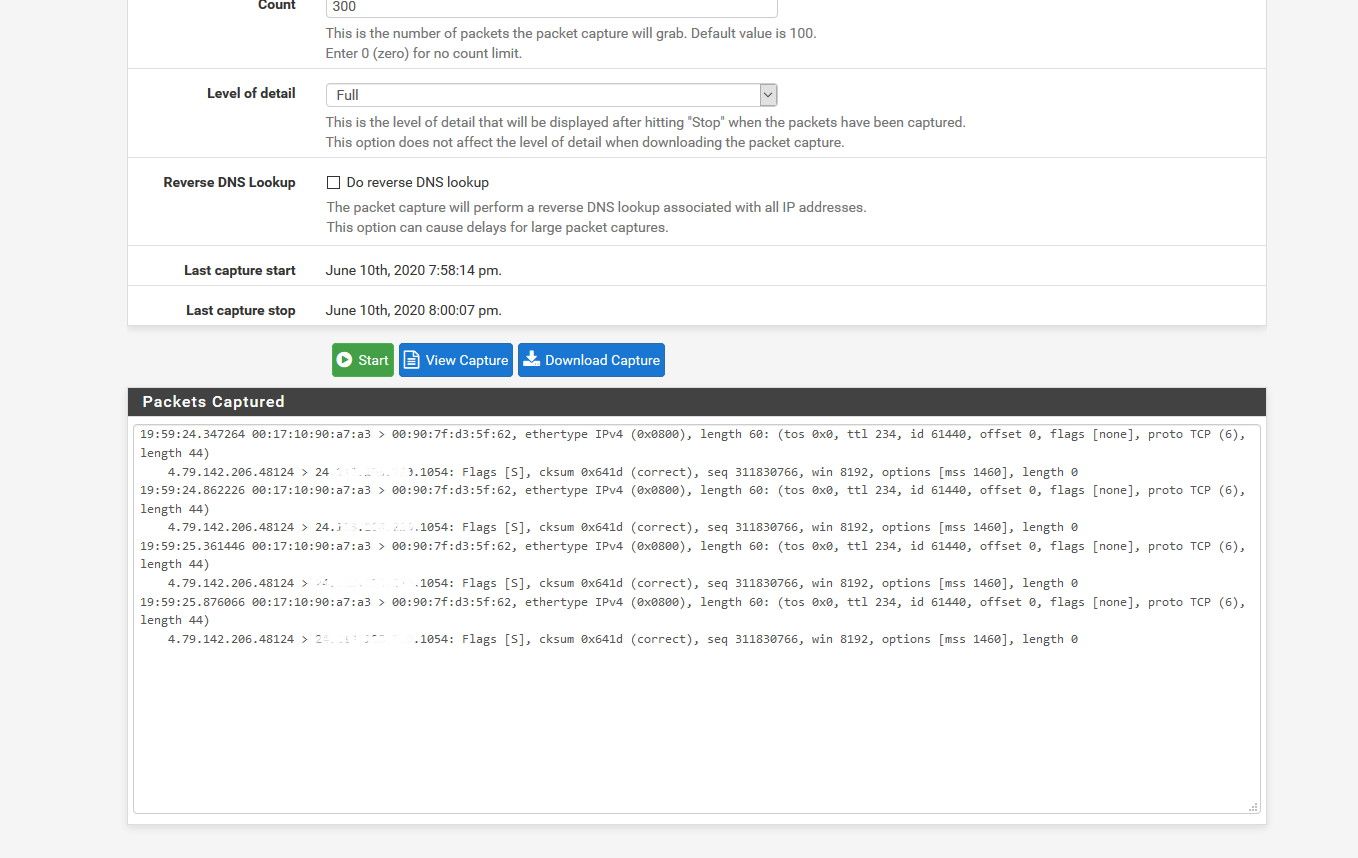
It should show up easily in the box below.
Im using GRC.com to try some connections inbound and doing a packet capture but that resource stops at 1055. But my screen capture will show you what to expect.
-
But it's not... I think I might have some browser issue... some extension, java whatever (despite the fact that I even changed browser).
I am saying this because I know my test server along with test pfsense has UDP port 10K working... so I just tried capturing traffic for that.... but I can't see anything.
Do I need to leave the capturing on for few mins, like 2-5 mins before I can actually see any captured packets?
Thx: Rav
-
If you see nothing I would bet your ISP is blocking that port.
-
How is that possible?
Just tried port 80 as well as 443 (TCP) and we all know it IS working, so why there is nothing for these port in the box below - as you can see it (in your ss).
Do I need to capture traffic from another Ip address.. as in my public IP is: 1.2.3.4 and both me and my server is connected to this same issue (via different interface at pfsenses) so can I do packet capture from this laptop or should I use another laptop whose public ip is: 5.6.7.8?
Many Thx: Rav
Many Thanks,
Rav -
Assuming your IP address is indeed public.. Not 100.xx.xx.xx or any of the others... Your ISP can block stuff. Especially if you are a residential customer.. Look at your TOS. They probably say no servers.
Don't feel shy to ask them.
-
Yes I truly have a public IP: 62...* and this is a commercial ISP. When I signed the contract I gave them MY ToS saying I will be hosting servers. They even support me with my issues, for example in changing my reverse DNS and so on.
Reason I am arguing is that when I give command on Test Server:
nc -l 10000 -uAnd then from Prod machine (should have Internet access):
echo "123" | nc -u my.public.ip.address 10000I do get "123" displayed on my test server... so that means I can forward the port and it is working, listening and displaying everything.
So why it is not working only in pfsense packet capture box? And worst-case scenario, what will ISP block? A port right? Even if they block UDP port 10K, they cannot block port 80 and 443 on TCP... but I cannot see anything even for those ports?
Many Thanks,
Rav -
Well.. commercial so you should be open.
Ive never had issues with the packet capture page on both Fireflop and Chrome.. But that is the limit of my testing..
-
@raviktiwari
are you trying from a network behind the router itself? if yes do you have some form of NAT reflection enabled?
system > advanced ? firewall & nat > Network Address Translation section. -
@raviktiwari
All comes down to the way you define your rules: The wildcard to wildcard (all to all) rules should go into the floating rules as they should be applied to every network in your domain...Hope it helps
-
A part of the test pfSense :

The "10000" rule send over 1.16 Giga bytes.
The second rule shows a whopping 3 Gb being handled by this rule.All this traffic didn't made it into the "Jitsi" process, or it was on the LAN .... probably it hit the "wall" between it ; the OS firewall of the "Jitsi" server.
Byw : I'm not sure, but this does not look "ok" to me :
You have two identical rules that have a port "10000" as a source address..
What about change the range for the second rule : 10001 - 20000 ? -
Thanks everyone... I don't know how and why ut it seems to be working... trust me, I did not make any changes other than the testing that @johnpoz and @chpalmer asked me to do yesterday... yes, I did restart the server as there were some bionic security and kernel upgrade that was pushed on the server and a restart was needed at the end of the update.
I am going to take a backup of the configuration and keep it safe somewhere as this configuration issue has troubled be quite a few times and for a long time. So Thanks to everyone once again.
However, the other issue, which actually delayed the troubleshooting of this issue (Unable to see the packet capture in the box below) is still something that I would like to get resolved.
Many Thanks,
Rav -
Hi @taz3146
Yes I am trying from a network behind the router itself?I checked system > advanced ? firewall & nat > Network Address Translation section and it was set to disabled, because I thought I will never need it. However, I have now changed it to: Nat+proxy.
And I am still unable to see any packet captured details in the box below.
P.S: UDP port 10K has already started working without making this NAT reflection changes. Do you still want me to make this change - I mean for the data capture box to display me the content?@Gertjan, that is in the plan, I wanted to get 10K work first and then change the other one from 10K1-20K now that it is working, I plan to make that changes.
Thanks for your time, help and support.
Thx: Rav
-
If you can not see traffic in diag.. Yeah you have an issue there..
As to firewall&nat set to disabled? What did you change?
NAT Reflection mode for port forwards?
You have zero use for that unless your actually doing the abomination that is nat reflection.. Which your port forwards would have zero to do with..
As to your sniffing - you sure your sniffing on the correct interface?
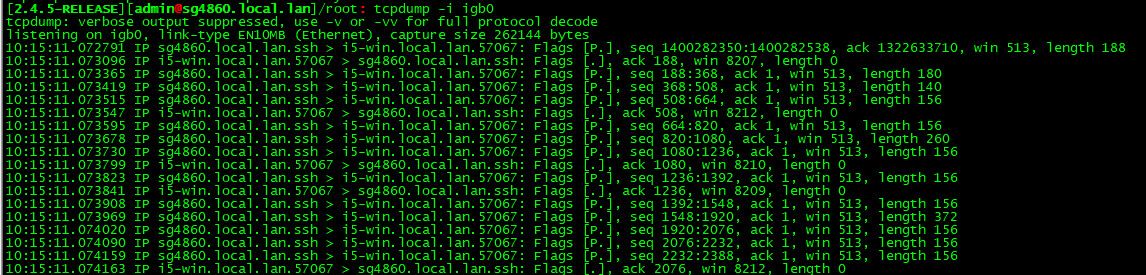
So from ssh, just do a tcpdump... Do you see flow of traffic?
-
Hey @johnpoz thanks again for your time and support.
I agree...I don't need to enable Nat reflection in advance but because someone suggested it to try so I gave it a go, which made no difference, so I can now revert it back to disabled.
I understand it gives me some benefit to run everything from behind the same firewall but I never had any requirement or issues anyways, so I probably don't need it anyways.
BTW, what do you mean by "If you can not see traffic in diag.." What is diag? Is it Packet Capture under Diagnostic mode? I know everything is working but the packet capture information is not being displayed in the box below. And that is what I want to get resolved.
I think I am sniffing right interface, but I am more than happy to be corrected. So how do I ensure that I am sniffing the correct interface? Can you give me some commands of path to menu which I need to click to ensure I am doing it right?
And yes, from ssh, doing a tcpdump on my network card gives loads of traffic flow - so much so that I had to stop it as it seemed it is never going to stop. :-)
As usual amny help/support/pointers is highly appreciated.
Many Thanks,
Rav -
Well what settings did you do on the diag, packet capture menu.. You have to make sure you select the correct interface for stuff to show up.. I have never seen such an issue..
I would validate by doing a sniff for what your wanting to see via tcpdump say your 10k port on your "wan" interface that your selection in the diag, packet capture.. Do you see it there, and then setting the same filtering on the gui packet capture you not seeing anything come up??
Is this traffic coming in via a vlan? Or a PPPoE connection? That might give you some issues with not seeing traffic in the packet capture screen
-
@johnpoz apologies for the delayed response...
As far as settings are concerned, I have not made any changes and it is pretty standard stuff... you can see the SS for more details and if you see something silly, please do not hesitate to correct me.
This test was done from a laptop behind the production server trying to capture UDP port 10K on Test server as well as on Prod Server (both of them have got different public IP). I even tried capturing the LAN port (changed the interface to LAN and Host address to 192.168 IP) - but same result, no result in the box below. It says packet capture is running, then I stop it and there is nothing in the box, even when I click on View capture, there is nothing.
However, I have just realised an interesting thing:
Just did a test on WAN and Opt1 interface, with respective IP for TCP port 443 and now I can see information in the box below.
Also, it works only for the IP that I am behind.. so from a laptop behind Prod IP, I can not capture packets (or see any information) for Test IP address - which probably makes sense.For connectivity point of view, my WAN connection is via cable broadband (Virgin Media Fibre Optic), which terminates on ISP Router (now running as Modem because I have taken 3 static IP addresses). From there it comes into my pfSense and then from pSense LAN and Opt1 port goes to office network and server network respectively.
issues with not seeing traffic in the packet capture screenSo now the question is: why UDP ports are not being captured or displayed?
As always, any help/support/suggestion/pointers are highly appreciated.
Many Thanks,
Rav -
@raviktiwari said in Port forward to UDP 10000 is NOT working:
So now the question is: why UDP ports are not being captured or displayed?
Because pfsense is not seeing them.. If it sees tcp, it would see UDP as well..
If your not getting them to your WAN... Then it can not forward them.. Quite possible they are blocked UPSTREAM of pfsense... If your not seeing them via your capture, then pfsense is not seeing them.