Could you help me analyze these crashdumps?
-
I am having regular crashes (once a month), they have been increasing recently (once a week). I also see the following entries more often in the syslog of the pfsense interface:
Sep 14 03:05:16	kernel		MCA: Bank 1, Status 0x9400000000000151
Sep 14 03:05:16	kernel		MCA: Global Cap 0x0000000000000106, Status 0x0000000000000000
Sep 14 03:05:16	kernel		MCA: Vendor "AuthenticAMD", ID 0x730f01, APIC ID 0
Sep 14 03:05:16	kernel		MCA: CPU 0 COR ICACHE L1 IRD error
Sep 14 03:05:16	kernel		MCA: Address 0xffff81250360
This is the last crashdump (ddl.txt):
db:1:lockinfo> show locks
No such command; use "help" to list available commands
db:1:lockinfo>  show alllocks
No such command; use "help" to list available commands
db:1:lockinfo>  show lockedvnods
Locked vnodes
db:0:kdb.enter.default>  show pcpu
cpuid        = 0
dynamic pcpu = 0x860580
curthread    = 0xfffff80047c3c000: pid 95879 "sh"
curpcb       = 0xfffffe011f55cb80
fpcurthread  = 0xfffff80047c3c000: pid 95879 "sh"
idlethread   = 0xfffff8000496e000: tid 100003 "idle: cpu0"
curpmap      = 0xfffff8005ec5c138
tssp         = 0xffffffff835a32d0
commontssp   = 0xffffffff835a32d0
rsp0         = 0xfffffe011f55cb80
gs32p        = 0xffffffff835a9f28
ldt          = 0xffffffff835a9f68
tss          = 0xffffffff835a9f58
tlb gen      = 494627
db:0:kdb.enter.default>  bt
Tracing pid 95879 tid 100170 td 0xfffff80047c3c000
kdb_enter() at kdb_enter+0x3b/frame 0xfffffe011f55c730
vpanic() at vpanic+0x19b/frame 0xfffffe011f55c790
panic() at panic+0x43/frame 0xfffffe011f55c7f0
pmap_remove_pages() at pmap_remove_pages+0x791/frame 0xfffffe011f55c8d0
vmspace_exit() at vmspace_exit+0x9c/frame 0xfffffe011f55c910
exit1() at exit1+0x5e9/frame 0xfffffe011f55c970
sys_sys_exit() at sys_sys_exit+0xd/frame 0xfffffe011f55c980
amd64_syscall() at amd64_syscall+0xa86/frame 0xfffffe011f55cab0
fast_syscall_common() at fast_syscall_common+0x101/frame 0xfffffe011f55cab0
--- syscall (1, FreeBSD ELF64, sys_sys_exit), rip = 0x800b62caa, rsp = 0x7fffffffeb38, rbp = 0x7fffffffec20 ---
[shortened]
<118>Bootup complete
MCA: Bank 1, Status 0x9400000000000151
MCA: Global Cap 0x0000000000000106, Status 0x0000000000000000
MCA: Vendor "AuthenticAMD", ID 0x730f01, APIC ID 0
MCA: CPU 0 COR ICACHE L1 IRD error
MCA: Address 0xffff80d18660
MCA: Bank 1, Status 0x9400000000000151
MCA: Global Cap 0x0000000000000106, Status 0x0000000000000000
MCA: Vendor "AuthenticAMD", ID 0x730f01, APIC ID 0
MCA: CPU 0 COR ICACHE L1 IRD error
MCA: Address 0xffff812503c0
<6>pid 78627 (unbound), jid 0, uid 59: exited on signal 10
MCA: Bank 1, Status 0x9400000000000151
MCA: Global Cap 0x0000000000000106, Status 0x0000000000000000
MCA: Vendor "AuthenticAMD", ID 0x730f01, APIC ID 0
MCA: CPU 0 COR ICACHE L1 IRD error
MCA: Address 0xffff80cfdbd0
panic: bad pte va 800bb3000 pte 0
cpuid = 0
KDB: enter: panic
And these are the start lines of a couple of other ones:
db:1:lockinfo> show locks
No such command; use "help" to list available commands
db:1:lockinfo>  show alllocks
No such command; use "help" to list available commands
db:1:lockinfo>  show lockedvnods
Locked vnodes
db:0:kdb.enter.default>  show pcpu
cpuid        = 2
dynamic pcpu = 0xfffffe01961fb580
curthread    = 0xfffff80008877620: pid 70097 "cat"
curpcb       = 0xfffffe011fc63b80
fpcurthread  = 0xfffff80008877620: pid 70097 "cat"
idlethread   = 0xfffff80004970000: tid 100005 "idle: cpu2"
curpmap      = 0xfffff800601ff138
tssp         = 0xffffffff835a33a0
commontssp   = 0xffffffff835a33a0
rsp0         = 0xfffffe011fc63b80
gs32p        = 0xffffffff835a9ff8
ldt          = 0xffffffff835aa038
tss          = 0xffffffff835aa028
tlb gen      = 1145354
db:0:kdb.enter.default>  bt
Tracing pid 70097 tid 100130 td 0xfffff80008877620
kdb_enter() at kdb_enter+0x3b/frame 0xfffffe011fc63730
vpanic() at vpanic+0x19b/frame 0xfffffe011fc63790
panic() at panic+0x43/frame 0xfffffe011fc637f0
pmap_remove_pages() at pmap_remove_pages+0x791/frame 0xfffffe011fc638d0
vmspace_exit() at vmspace_exit+0x9c/frame 0xfffffe011fc63910
exit1() at exit1+0x5e9/frame 0xfffffe011fc63970
sys_sys_exit() at sys_sys_exit+0xd/frame 0xfffffe011fc63980
amd64_syscall() at amd64_syscall+0xa86/frame 0xfffffe011fc63ab0
fast_syscall_common() at fast_syscall_common+0x101/frame 0xfffffe011fc63ab0
--- syscall (1, FreeBSD ELF64, sys_sys_exit), rip = 0x800903caa, rsp = 0x7fffffffec28, rbp = 0x7fffffffec40 ---
db:0:kdb.enter.default>  ps
db:1:lockinfo> show locks No such command; use "help" to list available commands db:1:lockinfo> show alllocks No such command; use "help" to list available commands db:1:lockinfo> show lockedvnods Locked vnodes db:0:kdb.enter.default> show pcpu cpuid = 0 dynamic pcpu = 0x898380 curthread = 0xfffff80058533000: pid 67822 "sh" curpcb = 0xfffffe0120575b80 fpcurthread = 0xfffff80058533000: pid 67822 "sh" idlethread = 0xfffff80004975000: tid 100003 "idle: cpu0" curpmap = 0xfffff800ced5c138 tssp = 0xffffffff82bb6810 commontssp = 0xffffffff82bb6810 rsp0 = 0xfffffe0120575b80 gs32p = 0xffffffff82bbd068 ldt = 0xffffffff82bbd0a8 tss = 0xffffffff82bbd098 db:0:kdb.enter.default> bt Tracing pid 67822 tid 100156 td 0xfffff80058533000 kdb_enter() at kdb_enter+0x3b/frame 0xfffffe01205752b0 vpanic() at vpanic+0x194/frame 0xfffffe0120575310 panic() at panic+0x43/frame 0xfffffe0120575370 pmap_remove_pages() at pmap_remove_pages+0x7fc/frame 0xfffffe0120575450 exec_new_vmspace() at exec_new_vmspace+0x1b5/frame 0xfffffe01205754c0 exec_elf64_imgact() at exec_elf64_imgact+0x931/frame 0xfffffe01205755b0 kern_execve() at kern_execve+0x77c/frame 0xfffffe0120575900 sys_execve() at sys_execve+0x4a/frame 0xfffffe0120575980 amd64_syscall() at amd64_syscall+0xa38/frame 0xfffffe0120575ab0 fast_syscall_common() at fast_syscall_common+0x101/frame 0xfffffe0120575ab0 --- syscall (59, FreeBSD ELF64, sys_execve), rip = 0x800b4664a, rsp = 0x7fffffffe218, rbp = 0x7fffffffe360 --- db:0:kdb.enter.default> psMany thanks for any hints!
-
MCA faults can only be hardware. Check the RAM of just started happening spontaneously.
Steve
-
Many thanks! Unfortunately, the firewall sits at a remote location, I will need to drive 2 hours to do the memtest. However, good to know it is unambiguous the hardware.
-
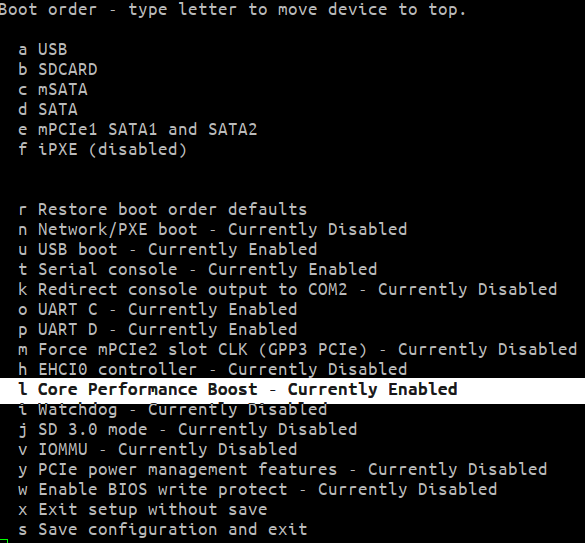
@Helmut101 Disable "Core Performance Boost" on Bios and see if it still crashes. I have the same problem and this is what solves the problem for me.
-
Many thanks! Unfortunately (or furtunately), I returned the APU.C2 to the manufacturer and got a replacement - they said they never had this occur, but the Kernel Panic was pretty unambiguous hardware related, which is why they exchanged this without a problem.
Running on the new APU pfsense since 4 weeks with the same configuration, no problems anymore.
What finally made me accept that this must be hardware/memory is that errors increased over the last couple of months. First it was a crash once a month. In September, it increased to once a week. In the last week, it was several crashes per day.
I am not sure, but one possibility I considered what could have caused these problems was that the pfblocker_ng extension increased temperature to 50-55°C on a permanent basis. This is totally within an acceptable range, but below 50°C would be preferrable I think.
-
nowadays those CPUs should be able to work smoothly up to 75/80C° degrees.
50 / 55 is nothing to worry aboutpi@raspberrypi2:~ $ vcgencmd measure_temp temp=58.0'Cit's running without any problem
it is more likely that it was faulty
-
@Helmut101 said in Could you help me analyze these crashdumps?:
This is totally within an acceptable range, but below 50°C would be preferrable I think
Yeah lower is always preferable but that is within the expected temperature range. You should not expect it to fail unreasonably early at that.
Steve