Packet lost
-
Last few days i was trying to find a solution with my ISP about my dropping connection,in the last 4 months i had only problems.
With light usage my connection is "fine" few packets lost. But when i try to download something my packets lost start to raise and pfsense will lose the pppoe connection, my modem is in bridge mode.
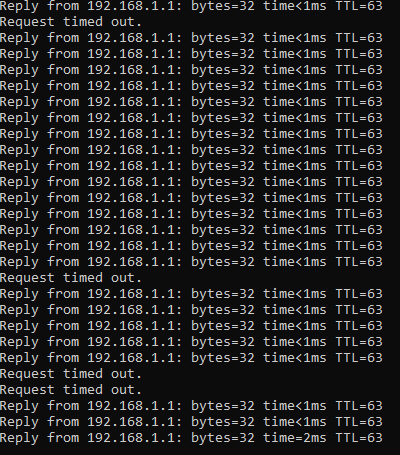
By mistake today i saw that i have also drooped packets/or high ping values(80ms,150ms,200ms), from my PC with pfsense witch is very strange.
Pc is connected straight to the pfsense by cat6 cable , and in the last 2 years i had this working.
I don't use Suricata and i have disabled all the hardware settings.
This is a fresh install, less then 1 month, but also i had this a crash in this time with this info
Version String: FreeBSD 11.3-STABLE #243 abf8cba50ce(RELENG_2_4_5): Tue Jun 2 17:53:37 EDT 2020
root@buildbot1-nyi.netgate.com:/build/ce-crossbuild-245/obj/amd64/YNx4Qq3j/build/ce-crossbuild-245/source
Panic String: vm_fault: fault on nofault entry, addr: fffffe0002685000
Dump Parity: 1918919020
Bounds: 1
Dump Status: good
Thank you. -
I would try a new cable first. If you're pinging the pfSense and getting drops then it's presumably either the NIC in your computer, the cable, or the NIC in the pfSense.
-
Seeing packet loss on a congested WAN connection is not uncommon. The PPPoE session should not go down though. And it should not affect pings from LAN clients to the LAN IP obviously.
What doestop -aSHshow when you are running that?It looks like you also had a kernel panic, do you have the complete crash dump?
Steve
-
@stephenw10 said in Packet lost:
Seeing packet loss on a congested WAN connection is not uncommon.
Occasional packet loss is pretty much mandatory, if you expect flow control to work. TCP throttles up, until it starts losing packets, then it backs down, based on the assumption the loss is caused by congestion. If you plot the process, it resembles a saw tooth pattern.
-
@teamits said in Packet lost:
I would try a new cable first. If you're pinging the pfSense and getting drops then it's presumably either the NIC in your computer, the cable, or the NIC in the pfSense.
I already did, also today i will change also the cable from pfsense to modem.
@stephenw10 said in Packet lost:
Seeing packet loss on a congested WAN connection is not uncommon. The PPPoE session should not go down though. And it should not affect pings from LAN clients to the LAN IP obviously.
What doestop -aSHshow when you are running that?It looks like you also had a kernel panic, do you have the complete crash dump?
Steve
I know that if the connection is full is normal to see packet loss, but not to lose the link in less then 5 min.===group
last pid: 19122;  load averages:  0.16,  0.17,  0.17                                                                                                                                                                                                                                                 up 0+05:28:39  03:49:38
187 processes: 6 running, 164 sleeping, 17 waiting
CPU:  0.9% user,  0.8% nice,  1.4% system,  0.0% interrupt, 97.0% idle
Mem: 963M Active, 253M Inact, 571M Wired, 193M Buf, 6011M Free
Swap: 2689M Total, 2689M Free

  PID USERNAME   PRI NICE   SIZE    RES STATE   C   TIME    WCPU COMMAND
   11 root       155 ki31     0K    64K CPU0    0 319:17  99.16% [idle{idle: cpu0}]
   11 root       155 ki31     0K    64K RUN     1 320:23  98.76% [idle{idle: cpu1}]
   11 root       155 ki31     0K    64K CPU3    3 321:07  98.33% [idle{idle: cpu3}]
   11 root       155 ki31     0K    64K RUN     2 320:47  93.04% [idle{idle: cpu2}]
    0 root       -92    -     0K   704K -       3   0:18   1.38% [kernel{em4 que}]
    0 root       -92    -     0K   704K -       3   0:11   1.07% [kernel{em0 que}]
28203 root        52    0 97380K 38336K accept  3   0:13   0.37% php-fpm: pool nginx (php-fpm)
 6815 root        52    0 95332K 37852K accept  1   0:11   0.36% php-fpm: pool nginx (php-fpm)
   21 root       -16    -     0K    16K -       3   0:01   0.06% [rand_harvestq]
 3783 root        20    0  7820K  4036K CPU1    1   0:00   0.05% top -aSH
   12 root       -60    -     0K   272K WAIT    1   0:10   0.04% [intr{swi4: clock (0)}]
76542 root        20    0 23680K  9040K kqread  2   0:06   0.04% nginx: worker process (nginx)
38773 root        20    0  6404K  2464K select  0   0:05   0.01% /usr/sbin/syslogd -s -c -c -l /var/dhcpd/var/run/log -P /var/run/syslog.pid -f /etc/syslog.conf
28875 root        20    0 12964K  7864K select  1   0:00   0.01% sshd: admin@pts/0 (sshd)
 1492 root        20    0  4644K  2324K select  0   0:01   0.01% /usr/local/sbin/clog_pfb -f /var/log/filter.log
 2818 root        22    0 52212K 37816K piperd  2   0:02   0.00% /usr/local/bin/php -f /usr/local/pkg/pfblockerng/pfblockerng.inc queries
   23 root       -16    -     0K    48K psleep  1   0:01   0.00% [pagedaemon{dom0}]
17356 root        20    0  6964K  2748K bpf     2   0:01   0.00% /usr/local/sbin/filterlog -i pflog0 -p /var/run/filterlog.pid
   20 root       -16    -     0K    16K pftm    2   0:09   0.00% [pf purge]
    0 root       -92    -     0K   704K -       0   0:06   0.00% [kernel{em1 que}]
 1342 uucp        20    0  6628K  2620K select  2   0:00   0.00% /usr/local/libexec/nut/usbhid-ups -a apc
77368 root        20    0 12464K  5784K select  2   0:01   0.00% /usr/local/sbin/ntpd -g -c /var/etc/ntpd.conf -p /var/run/ntpd.pid{ntpd}
19060 dhcpd       20    0 16460K 10960K select  0   0:00   0.00% /usr/local/sbin/dhcpd -user dhcpd -group _dhcp -chroot /var/dhcpd -cf /etc/dhcpd.conf -pf /var/run/dhcpd.pid em0 em1
 1670 root        20    0 52276K 37520K piperd  0   0:00   0.00% /usr/local/bin/php_pfb -f /usr/local/pkg/pfblockerng/pfblockerng.inc filterlog
   12 root       -88    -     0K   272K WAIT    2   0:00   0.00% [intr{irq268: xhci0}]
 2176 root        20    0 10500K  7072K kqread  2   0:04   0.00% /usr/local/sbin/lighttpd_pfb -f /var/unbound/pfb_dnsbl_lighty.conf
  342 root        20    0 95200K 25772K kqread  2   0:00   0.00% php-fpm: master process (/usr/local/lib/php-fpm.conf) (php-fpm)
   16 root       -68    -     0K    80K -       1   0:00   0.00% [usb{usbus0}]
58369 root        20    0  6904K  2340K nanslp  1   0:01   0.00% /usr/local/bin/dpinger -S -r 0 -i WAN_PPPOE -B 88.0.129.221 -p /var/run/dpinger_WAN_PPPOE~88.0.129.221~8.8.8.8.pid -u /var/run/
58369 root        20    0  6904K  2340K sbwait  3   0:00   0.00% /usr/local/bin/dpinger -S -r 0 -i WAN_PPPOE -B 88.0.129.221 -p /var/run/dpinger_WAN_PPPOE~88.0.129.221~8.8.8.8.pid -u /var/run/
62055 root        20    0  6292K  1984K select  1   0:00   0.00% /usr/sbin/powerd -b max -a max -n max
   26 root        20    -     0K    32K sdflus  3   0:00   0.00% [bufdaemon{/ worker}]
 3751 root        20    0 12612K  2440K select  2   0:00   0.00% /usr/local/sbin/upsd -u root
  418 root        20    0  9156K  5496K select  2   0:00   0.00% /sbin/devd -q -f /etc/pfSense-devd.conf
58369 root        20    0  6904K  2340K nanslp  2   0:00   0.00% /usr/local/bin/dpinger -S -r 0 -i WAN_PPPOE -B 88.0.129.221 -p /var/run/dpinger_WAN_PPPOE~88.0.129.221~8.8.8.8.pid -u /var/run/
   28 root        16    -     0K    16K syncer  2   0:00   0.00% [syncer]
   29 root       -16    -     0K    16K vlruwt  2   0:00   0.00% [vnlru]
   26 root       -16    -     0K    32K psleep  3   0:00   0.00% [bufdaemon{bufdaemon}]
   27 root       -16    -     0K    16K -       0   0:00   0.00% [bufspacedaemon]
    0 root       -16    -     0K   704K swapin  3 181.3H   0.00% [kernel{swapper}]
96817 unbound     20    0  1825M  1017M kqread  1   2:04   0.00% /usr/local/sbin/unbound -c /var/unbound/unbound.conf{unbound}
54086 root        52    0 97380K 38340K accept  3   0:13   0.00% php-fpm: pool nginx (php-fpm)
18060 root        52    0 95332K 37848K accept  2   0:12   0.00% php-fpm: pool nginx (php-fpm)
   12 root       -72    -     0K   272K WAIT    0   0:02   0.00% [intr{swi1: netisr 2}]
 2280 root        20    0 52212K 37840K piperd  3   0:01   0.00% /usr/local/bin/php -f /usr/local/pkg/pfblockerng/pfblockerng.inc dnsbl
    7 root       -16    -     0K    32K -       3   0:01   0.00% [cam{doneq0}]
   12 root       -88    -     0K   272K WAIT    0   0:01   0.00% [intr{irq269: ahci0}]
26977 root        52   20  6976K  2764K wait    2   0:01   0.00% /bin/sh /var/db/rrd/updaterrd.sh
   12 root       -56    -     0K   272K WAIT    2   0:00   0.00% [intr{swi5: fast taskq}]
96817 unbound     20    0  1825M  1017M kqread  2   0:00   0.00% /usr/local/sbin/unbound -c /var/unbound/unbound.conf{unbound}
96817 unbound     20    0  1825M  1017M kqread  0   0:00   0.00% /usr/local/sbin/unbound -c /var/unbound/unbound.conf{unbound}
   16 root       -68    -     0K    80K -       2   0:00   0.00% [usb{usbus0}]
   12 root       -84    -     0K   272K WAIT    0   0:00   0.00% [intr{irq1: atkbd0}]
 2509 root        20    0 52212K 37808K piperd  0   0:00   0.00% /usr/local/bin/php -f /usr/local/pkg/pfblockerng/pfblockerng.inc index
97269 uucp        20    0  6456K  2400K nanslp  3   0:00   0.00% /usr/local/sbin/upsmon
96817 unbound     20    0  1825M  1017M kqread  2   0:00   0.00% /usr/local/sbin/unbound -c /var/unbound/unbound.conf{unbound}
 6520 root        20    0 14456K  8128K select  0   0:00   0.00% /usr/local/sbin/mpd5 -b -k -d /var/etc -f mpd_wan.conf -p /var/run/pppoe_wan.pid -s ppp pppoeclient{mpd5}
   12 root       -72    -     0K   272K WAIT    2   0:00   0.00% [intr{swi1: netisr 0}]
26587 root        20    0 19600K  3296K uwait   0   0:00   0.00% /usr/local/sbin/filterdns -p /var/run/filterdns.pid -i 300 -c /var/etc/filterdns.conf -d 1{eth-eu1.nanopool.or}
26587 root        20    0 19600K  3296K uwait   1   0:00   0.00% /usr/local/sbin/filterdns -p /var/run/filterdns.pid -i 300 -c /var/etc/filterdns.conf -d 1{eu1.ethermine.org}
58369 root        20    0  6904K  2340K accept  1   0:00   0.00% /usr/local/bin/dpinger -S -r 0 -i WAN_PPPOE -B 88.0.129.221 -p /var/run/dpinger_WAN_PPPOE~88.0.129.221~8.8.8.8.pid -u /var/run/
   22 root       -16    -     0K    16K idle    3   0:00   0.00% [enc_daemon0]
    0 root         8    -     0K   704K -       1   0:00   0.00% [kernel{thread taskq}]
26587 root        20    0 19600K  3296K uwait   0   0:00   0.00% /usr/local/sbin/filterdns -p /var/run/filterdns.pid -i 300 -c /var/etc/filterdns.conf -d 1{eth-eu2.nanopool.or}
  357 root        40   20  6752K  2548K kqread  0   0:00   0.00% /usr/local/sbin/check_reload_status
   14 root        -8    -     0K    48K -       3   0:00   0.00% [geom{g_event}]
18683 root        48   20 22780K 16868K CPU2    2   0:00   0.00% /usr/local/sbin/unbound-control -c /var/unbound/unbound.conf stats_noreset
77168 root        20    0  6376K  2372K nanslp  2   0:00   0.00% /usr/sbin/cron -s
    7 root       -16    -     0K    32K -       1   0:00   0.00% [cam{scanner}]
   68 root        -8    -     0K    16K mdwait  2   0:00   0.00% [md0]
11137 root        20    0  6196K  2100K kqread  3   0:00   0.00% /usr/local/sbin/dhcpleases -l /var/dhcpd/var/db/dhcpd.leases -d acasa -p /var/run/unbound.pid -u /var/unbound/dhcpleases_entrie
    1 root        20    0  5012K   840K wait    1   0:00   0.00% [init]
42156 root        20    0  6532K  2400K nanslp  2   0:00   0.00% /usr/local/libexec/sshg-blocker -w /usr/local/etc/sshguard.whitelist{sshg-blocker}
73419 root        20    0  7280K  3544K pause   3   0:00   0.00% /bin/tcsh
40208 root        52    0  6724K  2732K wait    1   0:00   0.00% login [pam] (login)
26587 root        20    0 19600K  3296K uwait   1   0:00   0.00% /usr/local/sbin/filterdns -p /var/run/filterdns.pid -i 300 -c /var/etc/filterdns.conf -d 1{signal-thread}
39731 root        20    0  6192K  1912K nanslp  3   0:00   0.00% minicron: helper /usr/local/bin/ping_hosts.sh  (minicron)
42793 root        52    0  6976K  2852K wait    3   0:00   0.00% -sh (sh)
   13 root       -16    -     0K    64K sleep   2   0:00   0.00% [ng_queue{ng_queue0}]
I i am a newbie but i don't see my pfsense being under stress when i download something.
Here is the dump. textdump.tar.0
I have limiters working, but semes to work only with streaming(youtube and so) , when i do a direct download with or without limiters is the same story.
I ask here now for help because my isp changed the mode/cable outside my house 2 weeks ago, so i need to be 100% sure that is not my fault, before to make again a complain.
Today i will do another clean install and this time i will move my WAN to the 4xport NIC, right now is on the onboard NIC, is also intel.
Thank you guys for fast anaswers. -
@lcbbcl said in Packet lost:
I know that if the connection is full is normal to see packet loss
Not just on your connection. The congestion could occur anywhere along the path.
Is it just occasional packet loss? If so, that's entirely normal. If it's a lot of loss, that may be a different matter.
-
Relevant parts of that crash report:
db:0:kdb.enter.default>  show pcpu
cpuid        = 2
dynamic pcpu = 0xfffffe02a389c580
curthread    = 0xfffff800065ff000: pid 0 "em1 que"
curpcb       = 0xfffffe01e98bda80
fpcurthread  = none
idlethread   = 0xfffff8000620a000: tid 100005 "idle: cpu2"
curpmap      = 0xffffffff834f1c40
tssp         = 0xffffffff835a33a0
commontssp   = 0xffffffff835a33a0
rsp0         = 0xfffffe01e98bda80
gs32p        = 0xffffffff835a9ff8
ldt          = 0xffffffff835aa038
tss          = 0xffffffff835aa028
tlb gen      = 461962
db:0:kdb.enter.default>  bt
Tracing pid 0 tid 100062 td 0xfffff800065ff000
kdb_enter() at kdb_enter+0x3b/frame 0xfffffe01e98bcc90
vpanic() at vpanic+0x19b/frame 0xfffffe01e98bccf0
panic() at panic+0x43/frame 0xfffffe01e98bcd50
vm_fault_hold() at vm_fault_hold+0x24c6/frame 0xfffffe01e98bce80
vm_fault() at vm_fault+0x75/frame 0xfffffe01e98bcec0
trap_pfault() at trap_pfault+0x165/frame 0xfffffe01e98bcf20
trap() at trap+0x29d/frame 0xfffffe01e98bd030
calltrap() at calltrap+0x8/frame 0xfffffe01e98bd030
--- trap 0xc, rip = 0xffffffff83f2640a, rsp = 0xfffffe01e98bd100, rbp = 0xfffffe01e98bd170 ---
fq_codel_enqueue() at fq_codel_enqueue+0x14a/frame 0xfffffe01e98bd170
dummynet_io() at dummynet_io+0x1c4/frame 0xfffffe01e98bd1b0
pf_test() at pf_test+0xfd8/frame 0xfffffe01e98bd3c0
pf_check_out() at pf_check_out+0x1d/frame 0xfffffe01e98bd3e0
pfil_run_hooks() at pfil_run_hooks+0x90/frame 0xfffffe01e98bd470
ip_output() at ip_output+0xa53/frame 0xfffffe01e98bd5a0
ip_forward() at ip_forward+0x2c3/frame 0xfffffe01e98bd640
ip_input() at ip_input+0x724/frame 0xfffffe01e98bd6d0
netisr_dispatch_src() at netisr_dispatch_src+0xa2/frame 0xfffffe01e98bd720
ether_demux() at ether_demux+0x15b/frame 0xfffffe01e98bd750
ether_nh_input() at ether_nh_input+0x32c/frame 0xfffffe01e98bd7b0
netisr_dispatch_src() at netisr_dispatch_src+0xa2/frame 0xfffffe01e98bd800
ether_input() at ether_input+0x26/frame 0xfffffe01e98bd820
if_input() at if_input+0xa/frame 0xfffffe01e98bd830
em_rxeof() at em_rxeof+0x2e1/frame 0xfffffe01e98bd8a0
em_handle_que() at em_handle_que+0x40/frame 0xfffffe01e98bd8e0
taskqueue_run_locked() at taskqueue_run_locked+0x185/frame 0xfffffe01e98bd940
taskqueue_thread_loop() at taskqueue_thread_loop+0xb8/frame 0xfffffe01e98bd970
fork_exit() at fork_exit+0x83/frame 0xfffffe01e98bd9b0
fork_trampoline() at fork_trampoline+0xe/frame 0xfffffe01e98bd9b0
--- trap 0, rip = 0, rsp = 0, rbp = 0 ---
db:0:kdb.enter.default>  ps
load_dn_aqm dn_aqm CODEL loaded load_dn_aqm dn_aqm PIE loaded panic: vm_fault: fault on nofault entry, addr: fffffe00028db000 cpuid = 2 KDB: enter: panicSo it looks like that was in FQ-CoDel. Perhaps you had it misconfigured at one point, has it only crashed once?
-
Thank you all, problem solved.
Was onboard network card. Now i moved my wan to 4xnic and all is perfect.
I did also a fresh install because i was not able to delete the pppoe witch had link with my onboard nic.