Double counting of WAN out traffic?
-
Hi
I see on traffic graphs WAN out traffic double actual traffic. The LAN in traffic is as expected.
I have one LAN and one WAN interface.
What can cause this? -
In 2.4.5p1?
Are you using VLANs?
Steve
-
@STEPHENW10 Yes, 2.4.5p1 no VLANs
-
Which direction, outbound or inbound on the wan.
A picture of what your seeing would be most helpful as well.
-
@johnpoz said in Double counting of WAN out traffic?:
Which direction, outbound or inbound on the wan.
A picture of what your seeing would be most helpful as well.
Outbound WAN is twice inbound LAN
The difference exists in graphs. Also when I am doing a speed test inbound LAN matches the results of the speed test, outbound WAN is double what I am getting from speed test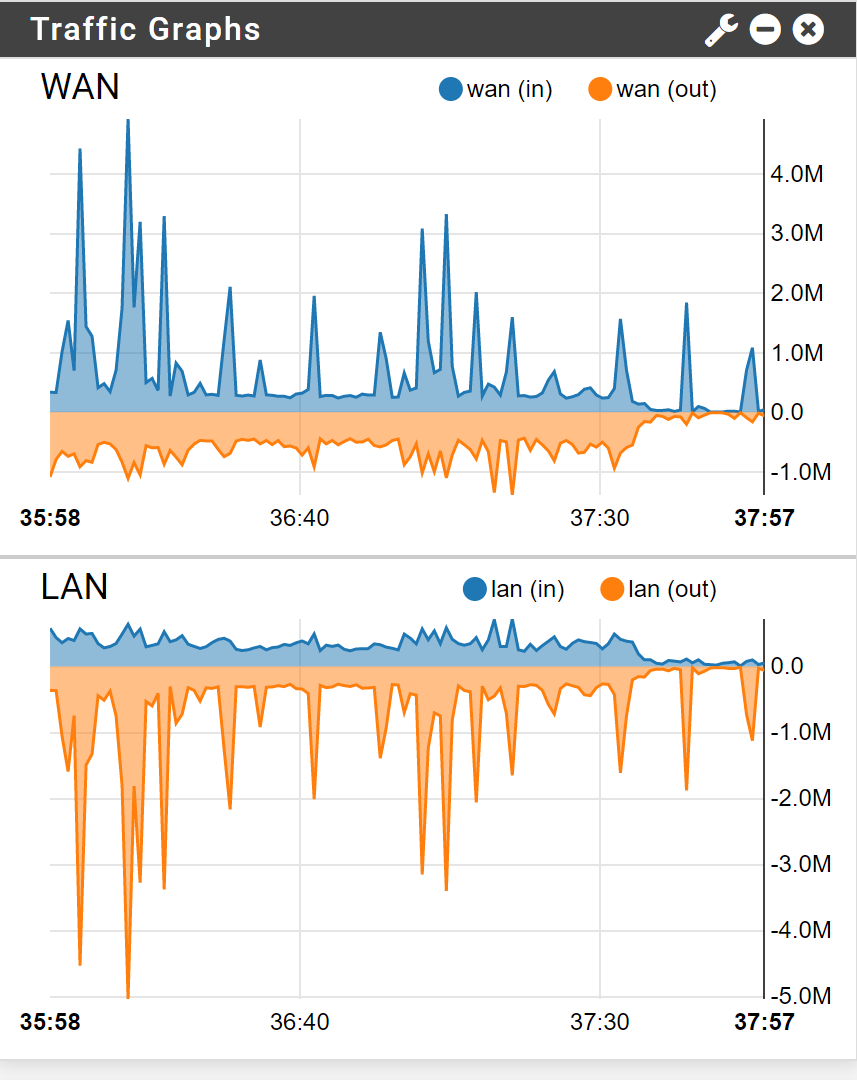
-
That looks correct. The inbound traffic on WAN is outbound on LAN. Values are the same.
Edit: Oh I see what you're saying. Just not easy to see there. If you mouse-over the LAN(in) and WAN(out) does it show exactly double values?
Steve
-
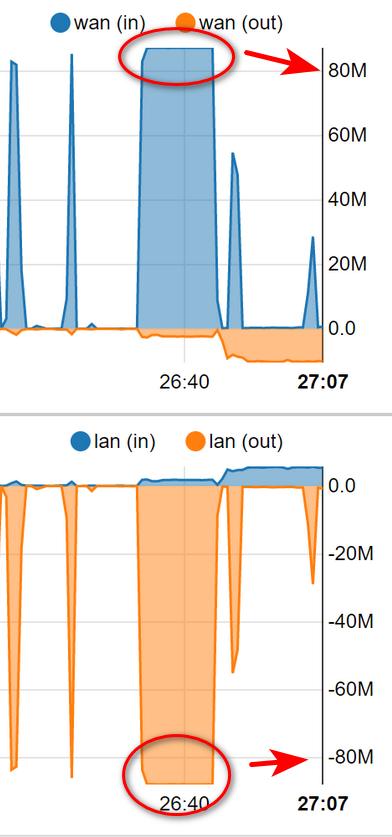
What is he saying - sure looks like mirror to me.. Other than bottom graph shows the 5M, and seems to be cut off on the top graph... But sure looks close enough to be the same.. Looks like a perfect mirror to me - which is what it should be.. Well maybe not exact to the bit, because you could have traffic hitting the lan or wan that doesn't get passed through to the other.
But where is double?? Looks like wan out, to lan in - just the scale missing the 1M?
This could be off a bit?
But its not double.. And again - there will always be traffic seen on wan that is not passed through to lan, and then traffic that hits lan that is not sent out the wan.. You also have small amounts of traffic that would be created by pfsense, dns queries.. package downloads, etc..
Now if you were doing a speed test and getting 100Mbps, and only saw 50 on one of the graphs - But this looks fine and normal and within graphing error expectations, especially with smoothing, etc.
How is this double - looks like a perfect mirror, which it should be - at exactly the same values..
-
I'm not sure I see it on the graph either :) but it sounds vaguely like my recent post about traffic shaper queue display:
https://forum.netgate.com/topic/157564/bandwidth-usage-shown-on-queue-status-page-is-wrong (root queue shows double the observed speed) -
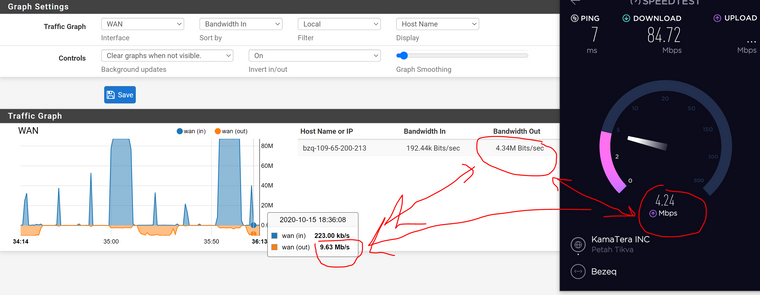
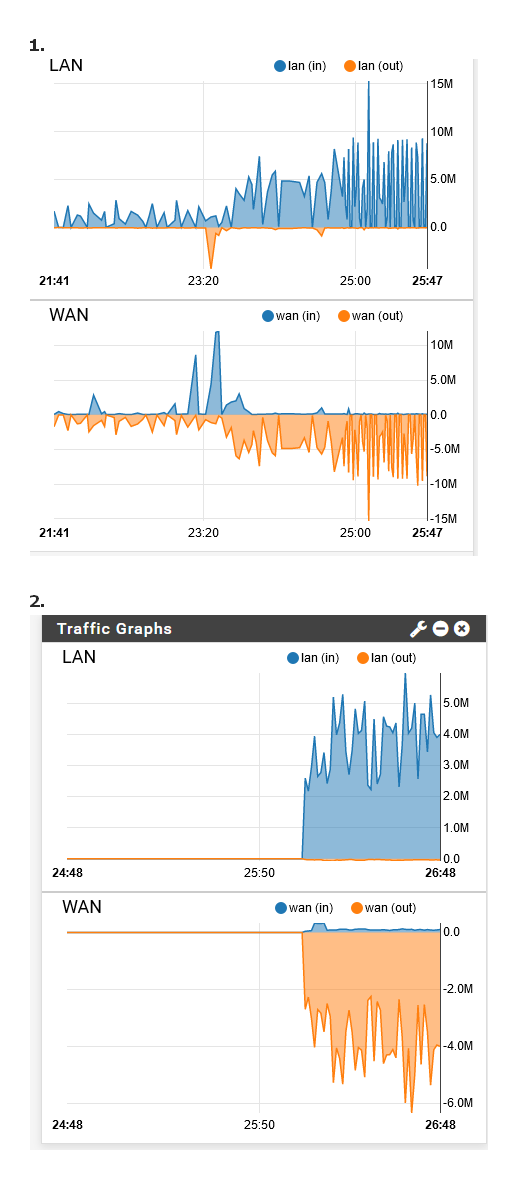
@johnpoz I am attaching an additional screenshot.
I have 100M/5M link so it is hard to produce a clear graph.
But I checked numbers and traffic is doubled. Not some small difference.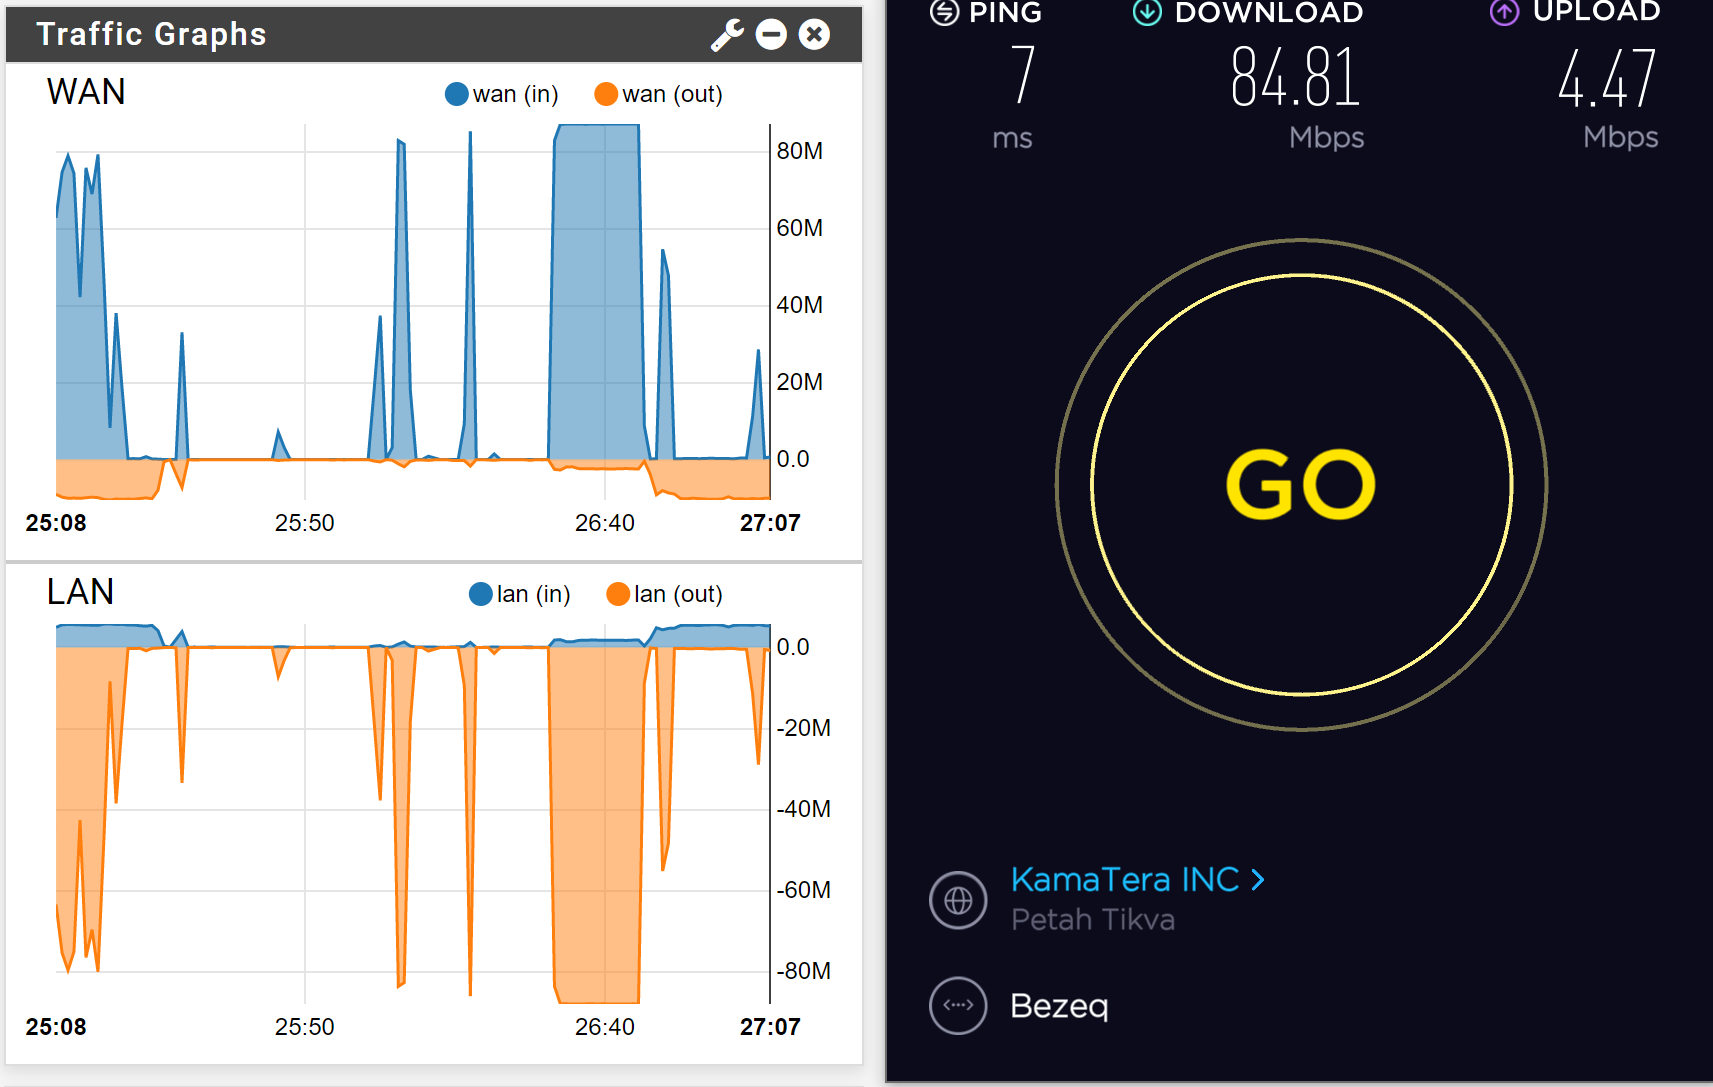
-
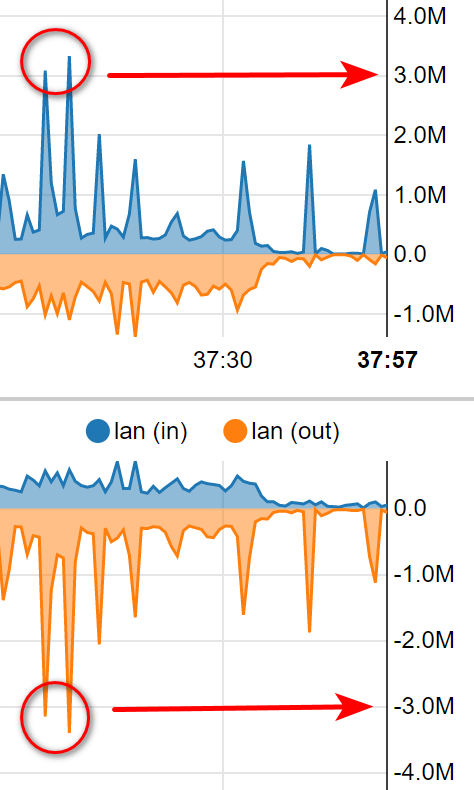
@johnpoz I think I reproduced the problem clear. Please see below
-
Where?? You looking at some instantaneous number without a timestamp, vs some other instantaneous of a graph that does smoothing.
Sorry but these sure look pretty freaking exact to me..
edit: here I just went to upload only internet speed test.. Sure looks pretty freaking on the ball to me..
So the scale doesn't get skewed with large numbers on download, and then small numbers on upload, etc.
-
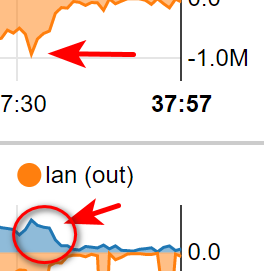
@johnpoz he's looking at WAN out/LAN in, the other side of both graphs (which don't have a scale showing due to the high download speed scale). Are you saying the traffic graph is expected to sometimes show 9.6 Mbps even though the connection speed is lower?
@stepanov1975 to be clearer, are you saying you have a 5 Mbps upload and should not be able to get 9-10? Because that's what I saw in my thread, with the traffic shaper queue numbers.
That said I just tried it once and though the numbers were slightly higher it wasn't double for me... the download graph showed 70-75 and per Google that's a 69, and upload showed 10-13 and per Google that is a 10.2.
Only install packages for your version, or risk breaking it. Select your branch in System/Update/Update Settings.
When upgrading, allow 10-15 minutes to reboot, or more depending on packages, CPU, and/or disk speed.
Upvote 👍 helpful posts! -
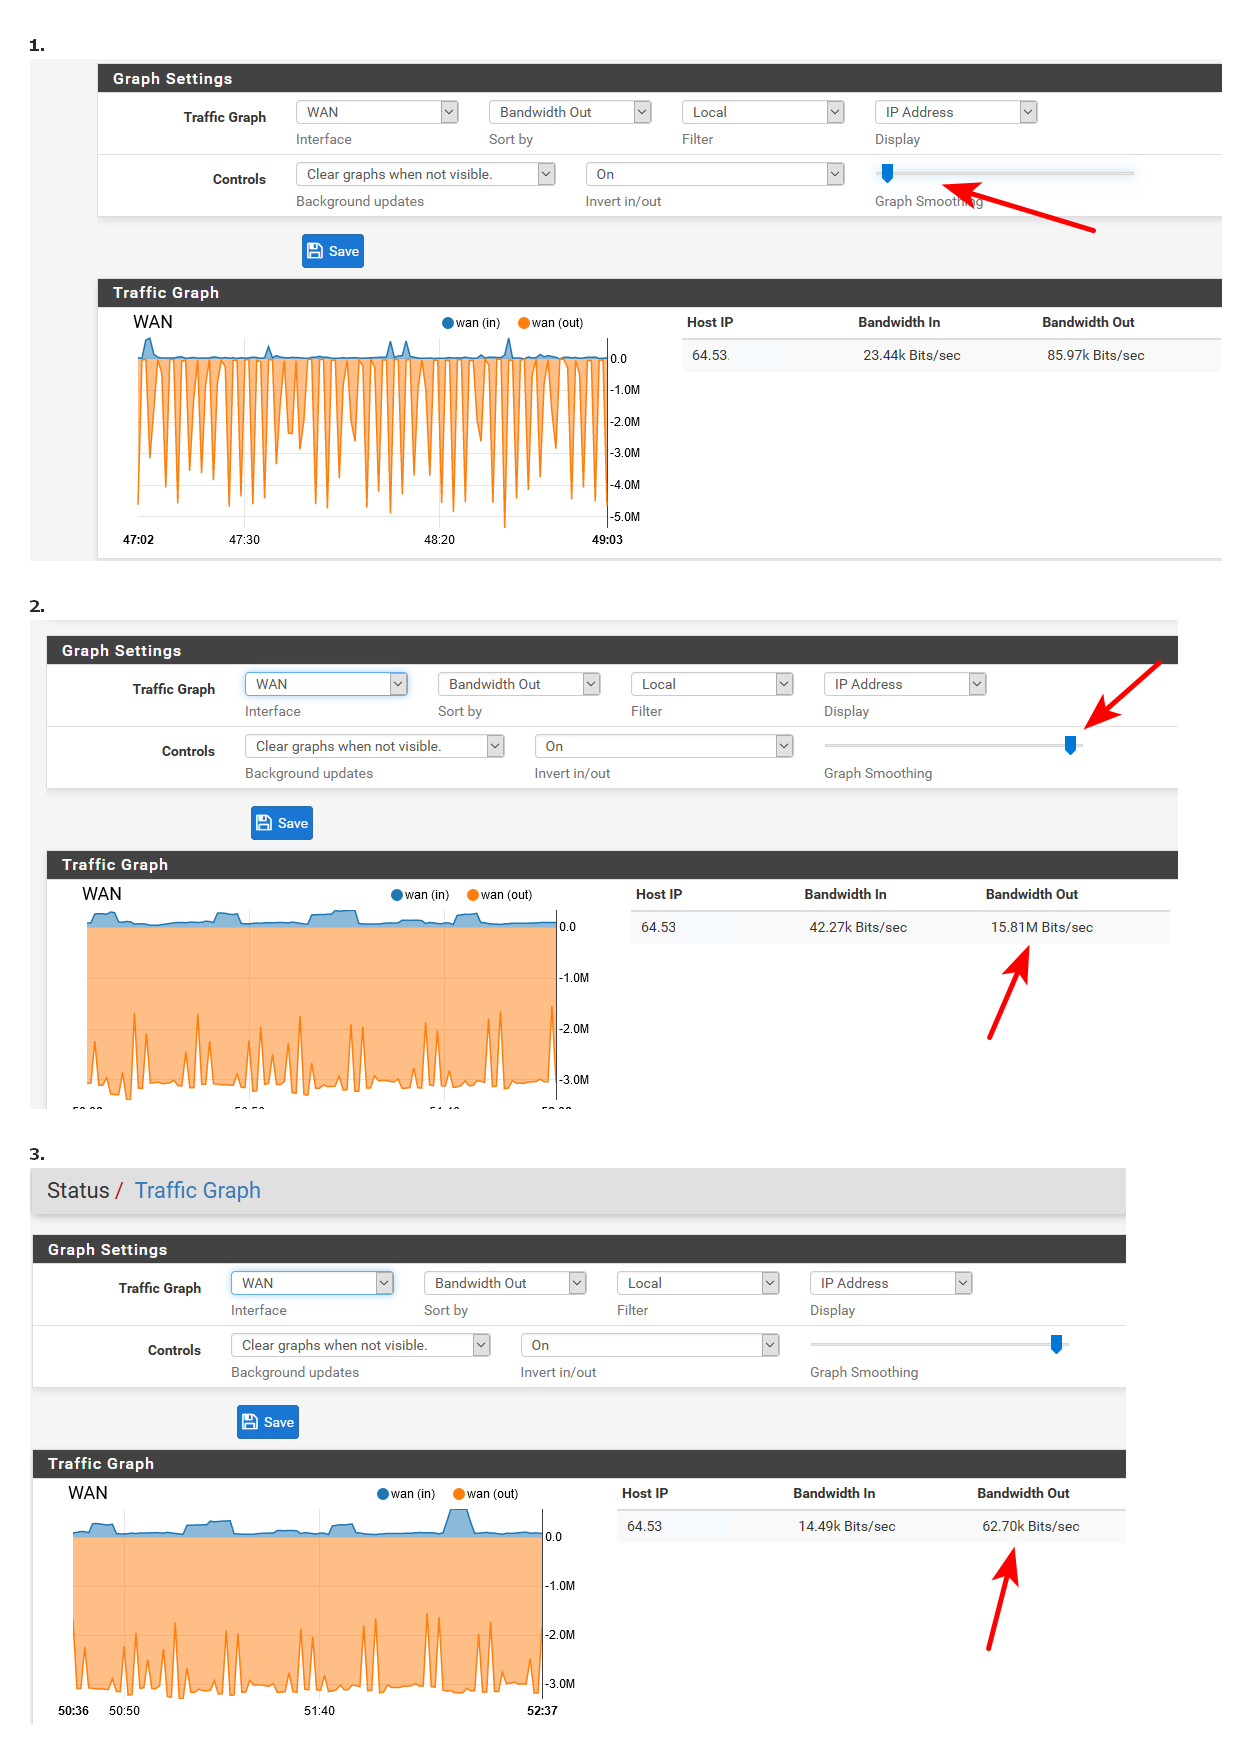
@johnpoz Sorry that I am unable to explain the problem clearly.
- The problem exists only for outbound traffic of the WAN interface.
- The graph shows traffic that is clearly twice what shown on the LAN side
- It is also twice the traffic shown in the results of the speed test.
- It is also twice the traffic shown in the interface for the speed test connection.
- LAN Inbound traffic is the same as traffic shown in the speed test and also the same as shown for connection to speed test server.
- We have three different sources in agreement. So, we can assume the number is tight, but the graph of WAN outbound traffic shows twice this number.
- So my conclusion is that the graph of outbound traffic is wrong.
I am attaching once more a screenshot showing what I said above.

-
@teamits
@stepanov1975 to be clearer, are you saying you have a 5 Mbps upload and should not be able to get 9-10? Because that's what I saw in my thread, with the traffic shaper queue numbers.
This is also right. But I am actually saying something different.
I am saying that I can check connection speed in three different places (other than the graph), and all sources agree, but the graph shows twice the speed. -
@stepanov1975 Just brainstorming, do you have Snort or Suricata running? Or traffic shaping?
-
@teamits Triaffic shaping
-
@stepanov1975 said in Double counting of WAN out traffic?:
Triaffic shaping
Interesting. Can you check the bandwidth on the root queue on Status/Queues page as well, per https://forum.netgate.com/topic/157564/bandwidth-usage-shown-on-queue-status-page-is-wrong ? I can do more tests on the traffic graph later but I duplicated that doubled-bandwidth problem on four routers yesterday.
-
@teamits said in Double counting of WAN out traffic?:
Are you saying the traffic graph is expected to sometimes show 9.6 Mbps even though the connection speed is lower?
No not with a flat line like that.. But with instantaneous numbers you could for sure see different numbers that what you get for an average..
That instant number you see in the traffic graph can for sure be misleading to what your actually moving on an average..
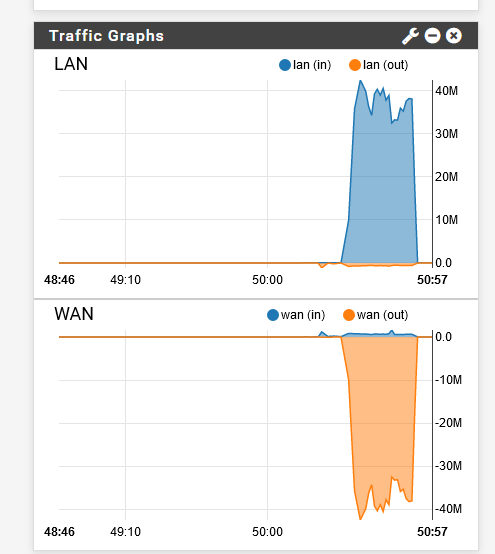
For example - my plex is serving up some data via streams
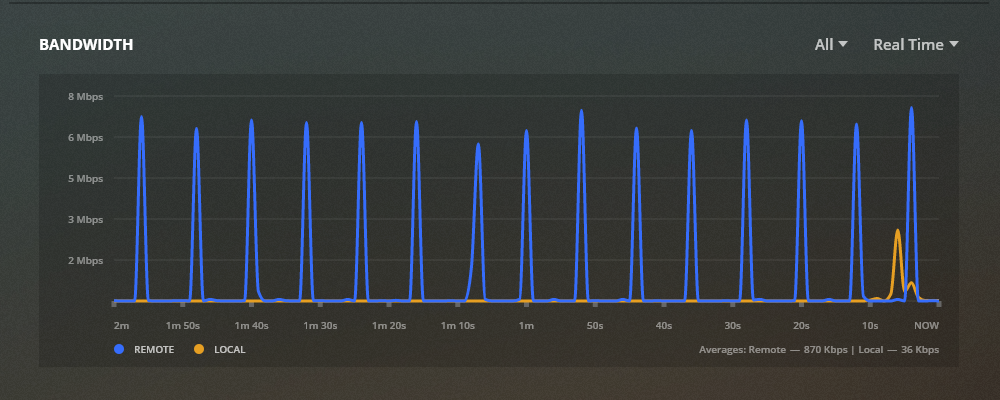
you can see its bursty... And dending how you have your graphs set for when they sample, how they smooth you can see different values..
That instantaneous value you see in the traffic graph, wouldn't say that is all that exact to be honest if you looking to what the bandwidth move is over /time, etc..
I am not using any queues or shaping.. And the graphs show exactly what I would expect to see.. Not double that is for sure..
So what I am saying is I am unable to duplicate your problem no matter what graphs I look at.
Best testing method would be to generate some very stable traffic flow - iperf for example set with specific bandwidth setting so you could move say 50mbps stable for extended period... Then what does your values show.. Keep in mind best time to test this would be with nothing else on the network that could create traffic.
edit: More examples of variables.. And instantaneous readings..
No smoothing, max smoothing - instant values being shown vs what the graph shows.
I can not really do a stable iperf3 tests right now... because I have lots of stuff going on, and users streaming videos..
-
I started a 4 GB upload to observe. I understand traffic is a point in time measurement that will vary up and down, but for a max upload it should be reasonably consistent, and not double the connection speed.
For me the traffic graph WAN Out hovered around 13-15 Mbps (which would be normal), and the Status/Queues/Interface WAN/root queue ranged from 26-30 Mbps as I observed in my thread (double the connection speed). That's consistent with what I saw on all four routers yesterday, I just wasn't looking at the traffic graph specifically.
So it seems like OP and I have a similar sounding symptom but they are not the same.
-
@teamits I have PRIQ so, no root queue :(