CPU and NIC w/ Multi-Queue Process
-
Hello All.
I have a question regarding mult-queue and how pfSense manage it.
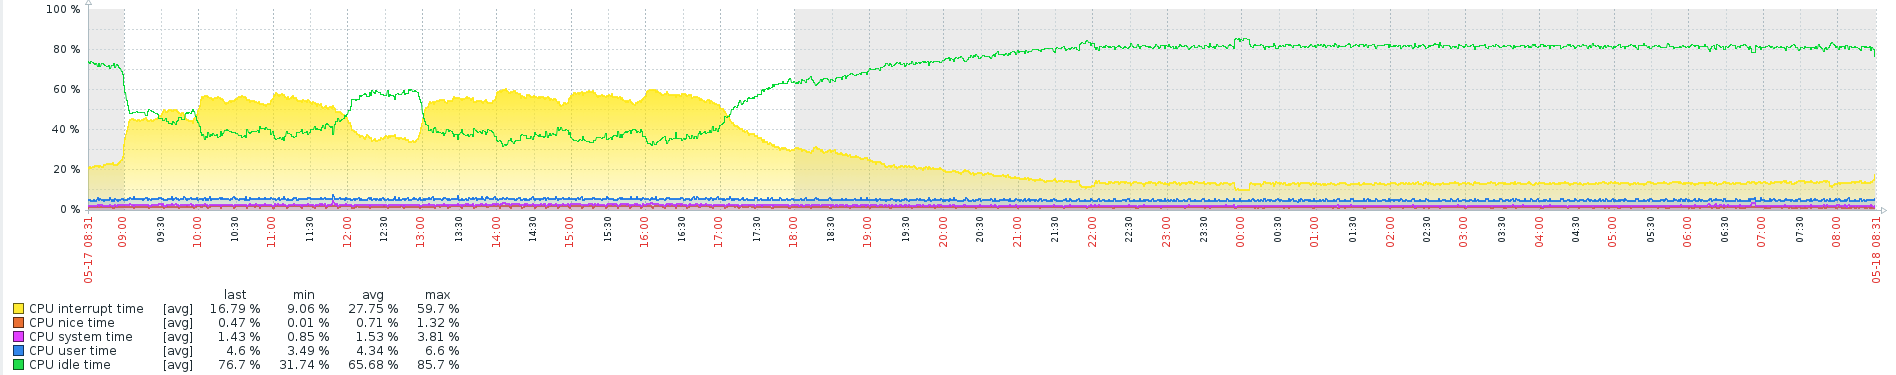
As shown in the image the CPU interrupt time % is relevant high and during the peak it can reach more then 90%.
My setup are;
2.4.4-RELEASE-p2 (amd64) FreeBSD 11.2-RELEASE-p6
---- Running in two dell pe-r320 servers as HA stature with good performanceSome additional configurations was modified from the default since beginning as shown below.
- System > Advanced > Firewall & NAT
IP Do-Not-Fragment compatibility
√ Clear invalid DF bits instead of dropping the packetsFirewall Optimization Options
√ Conservative- System > Advanced > Networking
Hardware TCP Segmentation Offloading
√ Disable hardware TCP segmentation offload
Hardware Large Receive Offloading
√ Disable hardware large receive offloadAlso the CPU has 4 cores that means it can handle 4 queues at time.
The NIC types are "bce" and "igb" that running with combination of LAGG and BRIDGE0 configuration as follows;LAG0 = bce0,bce1 as WAN
BRIDGE0 = LAG0+LAN "igb1"This is the top -aSH results;
last pid: 51443;  load averages:  0.63,  0.72,  0.72 up 816+01:44:57 08:25:01
197 processes: 5 running, 151 sleeping, 41 waiting
CPU:  0.2% user,  0.0% nice,  0.3% system, 13.2% interrupt, 86.3% idle
Mem: 29M Active, 71M Inact, 517M Wired, 306M Buf, 3292M Free
Swap: 4096M Total, 4096M Free

  PID USERNAME   PRI NICE   SIZE    RES STATE   C   TIME    WCPU COMMAND
   11 root       155 ki31     0K    64K CPU3    3    ???  93.90% [idle{idle: cpu3}]
   11 root       155 ki31     0K    64K RUN     2    ???  93.73% [idle{idle: cpu2}]
   11 root       155 ki31     0K    64K CPU0    0    ???  90.28% [idle{idle: cpu0}]
   11 root       155 ki31     0K    64K CPU1    1    ???  75.17% [idle{idle: cpu1}]
   12 root       -92    -     0K   656K WAIT    1 3041.3  21.65% [intr{irq285: bce0}]
   12 root       -92    -     0K   656K WAIT    0 1250.5   7.57% [intr{irq269: igb1:que 0}]
   12 root       -92    -     0K   656K WAIT    2 772.9H   4.42% [intr{irq271: igb1:que 2}]
   12 root       -92    -     0K   656K WAIT    3 771.7H   4.32% [intr{irq272: igb1:que 3}]
   12 root       -92    -     0K   656K WAIT    1 763.9H   4.08% [intr{irq270: igb1:que 1}]
   12 root       -72    -     0K   656K WAIT    3 462.8H   2.89% [intr{swi1: pfsync}]
   12 root       -92    -     0K   656K WAIT    0  98.5H   0.76% [intr{irq279: igb3:que 0}]
34819 root        20    0  6600K  3104K bpf     0  61.8H   0.54% /usr/local/sbin/filterlog -i pflog0 -p /var/run/filterlog.pid
58538 root        20    0  6400K  2544K select  3  29.1H   0.26% /usr/sbin/syslogd -s -c -c -l /var/dhcpd/var/run/log -P /var/run/syslog.pid -f /etc/syslog.conf
   20 root       -16    -     0K    16K -       2  32.0H   0.24% [rand_harvestq]
93789 root        20    0  9860K  4684K CPU2    2   0:00   0.09% top -aSH
   19 root       -16    -     0K    16K pftm    2 451:15   0.08% [pf purge]
   12 root       -60    -     0K   656K WAIT    2 801:51   0.07% [intr{swi4: clock (0)}]
38237 root        20    0 14148K 10268K nanslp  3   9:53   0.01% zabbix_agentd: collector [idle 1 sec] (zabbix_agentd)
38975 root        38    0 14148K 10436K nanslp  2  38:36   0.01% zabbix_agentd: active checks #1 [idle 1 sec] (zabbix_agentd)
77975 root        20    0  8948K  2488K nanslp  3   5:06   0.01% [dpinger{dpinger}]
78175 root        20    0  8948K  2488K nanslp  1   4:54   0.01% [dpinger{dpinger}]
I saw that pfSense 2.5.0 is able to utilize multiple NIC queues by default, and therefore no tweaks are necessary. I don't have tested yet to know.
My question is;
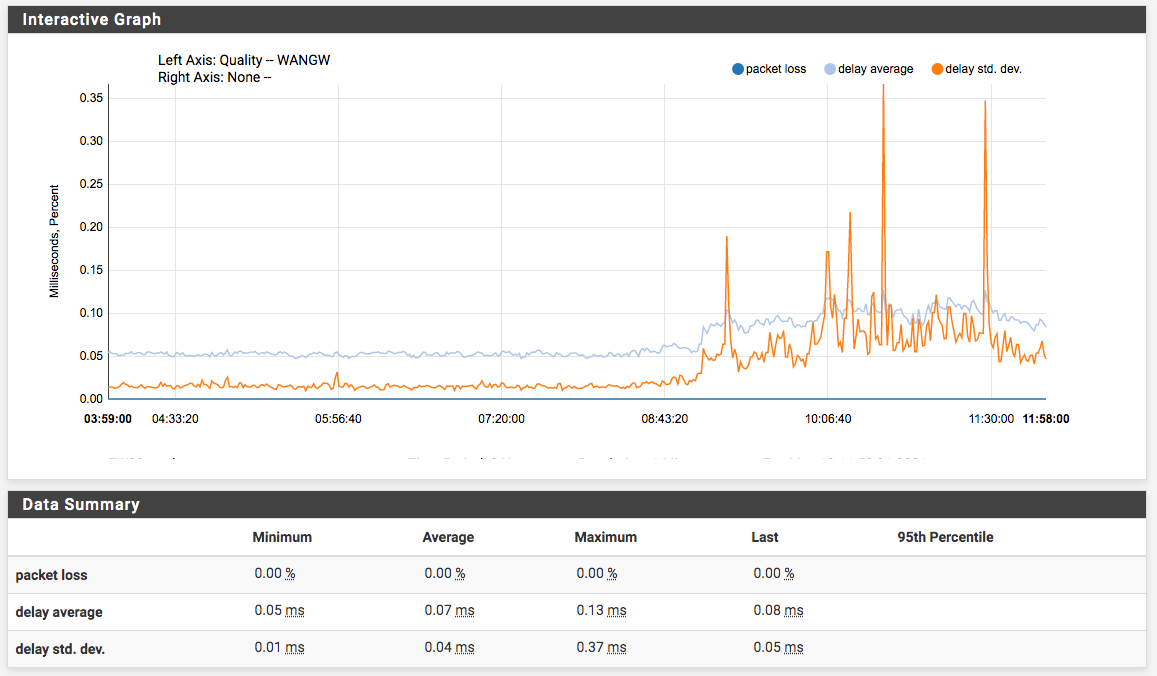
The CPU interrupt is a normal process to process packets or it is abnormal. In terms of packet quality I don't see any packet losses.
- To understand how pfSense generates the CPU and NIC queues, and what would be the best practices of configuration level considering that the usage % of CPU interrupt is high than the OS self.
If anyone has a good knowledge that topic, please share it. I'm sure it will surely help others.
Thank you in advence.
MY
-
Interrupt load is where you would expect to see that load caused by traffic. Nothing there looks especially unusual.
I don't see any load from bce1 and I would expect to if it's in an LACP LAGG and there are multiple connections.
It looks like you have at lease 4 igb NICs in that system. If most of your traffic is across that LAGG I would be swapping out the bce NICs for igb if you can.
Steve
-
Hi @stephenw10, I appreciate your comment.
Actually there's no load from bce1 because it's used as failover port.
We have two NIC cards as follow below.
NIC card 1st
bge0 (master port)
--- As LAGG0 / FAILOVER configuration. (WAN)
bge1 (failover port)NIC card 2nd
igb0 (LAN)
igb1 (OPT1) As BRIDGE0 w/ LAGG0
igb2 (OPT2)
igb3 (SYNC)The main load on that scenario are on the LAGG0 "bge0" and BRIDGE0 "igb1" interface as transparent from WAN to OPT1. The reason for that is to allow the same WAN interface IP block assignment to the OPT1 interface.
As a note the CPU type is;
Intel(R) Xeon(R) CPU X3430 @ 2.40GHz
4 CPUs: 1 package(s) x 4 core(s)
AES-NI CPU Crypto: NoCPU Load Average
(max 4.0 / 250Mbps)

CPU jumps
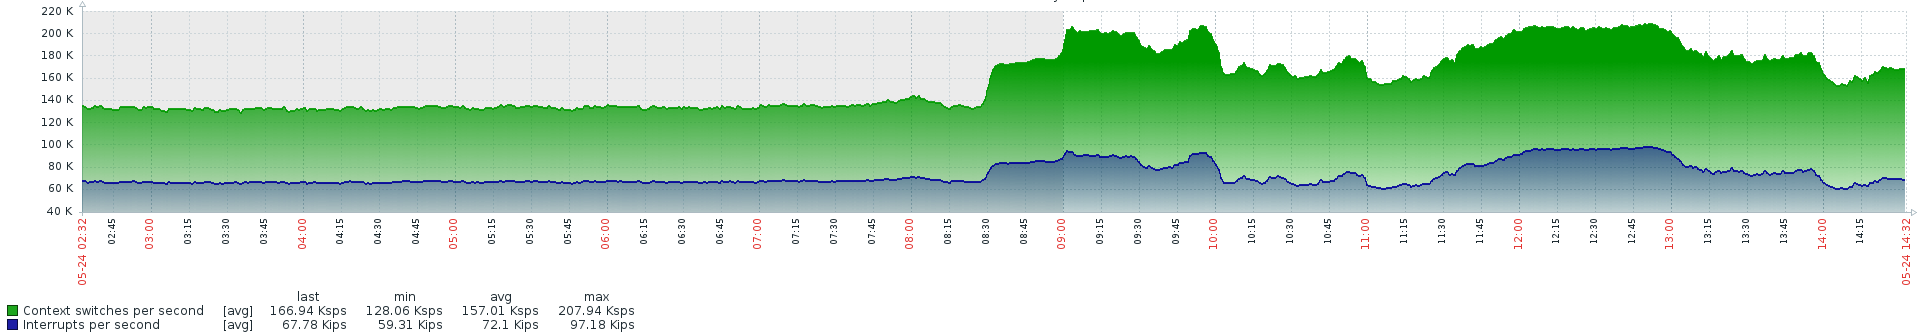
As show, the peak of the traffic on WAN interface are less than 300Mbps but the CPU load looks hight for some reason.
As reference, this is the BRIDGE0 interface traffic.
(It looks the sum of the WAN and OPT1 interface that shows a peak of 500Mbps)
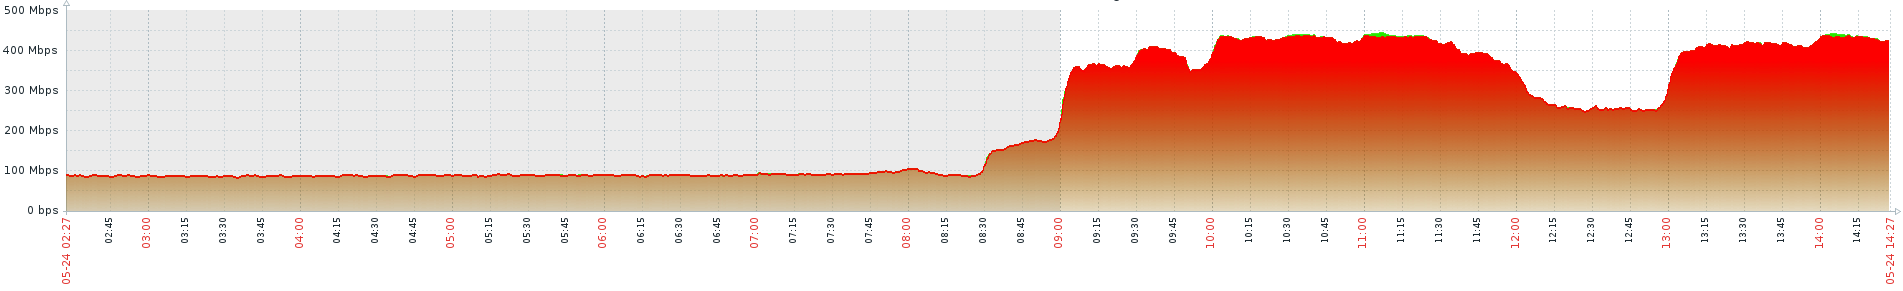
There is some adjustment "trick" on the "System Tunables" configuration that will help the CPU performance? As it goes so far I think that the max speed that it can process is less than 600Mpbs in (BRIDGE0) total. I'll keep monitoring it.
MY
-
Ah, yes, traffic like that over a bridge interface is always going to use significantly more CPU cycles. I imagine it's actally the bridge doing that and not the lagg or bce NICs.
I would remove the bridge if you can, at least as a test.None the less I would still use an LACP lagg if whatever it;s connected to supports that. And I would use the multiqueue igb NICs there if you can. Use bce for sync where throughput is going to be much lower.
Also that appears to be an HA node and using bridges with HA is risky at best. You can very easily create a loop.
Steve
-
Hi @stephenw10, Thank you!
You're correct regarding using bridges with HA configuration.
As sample, below is the scenario that I have tested.
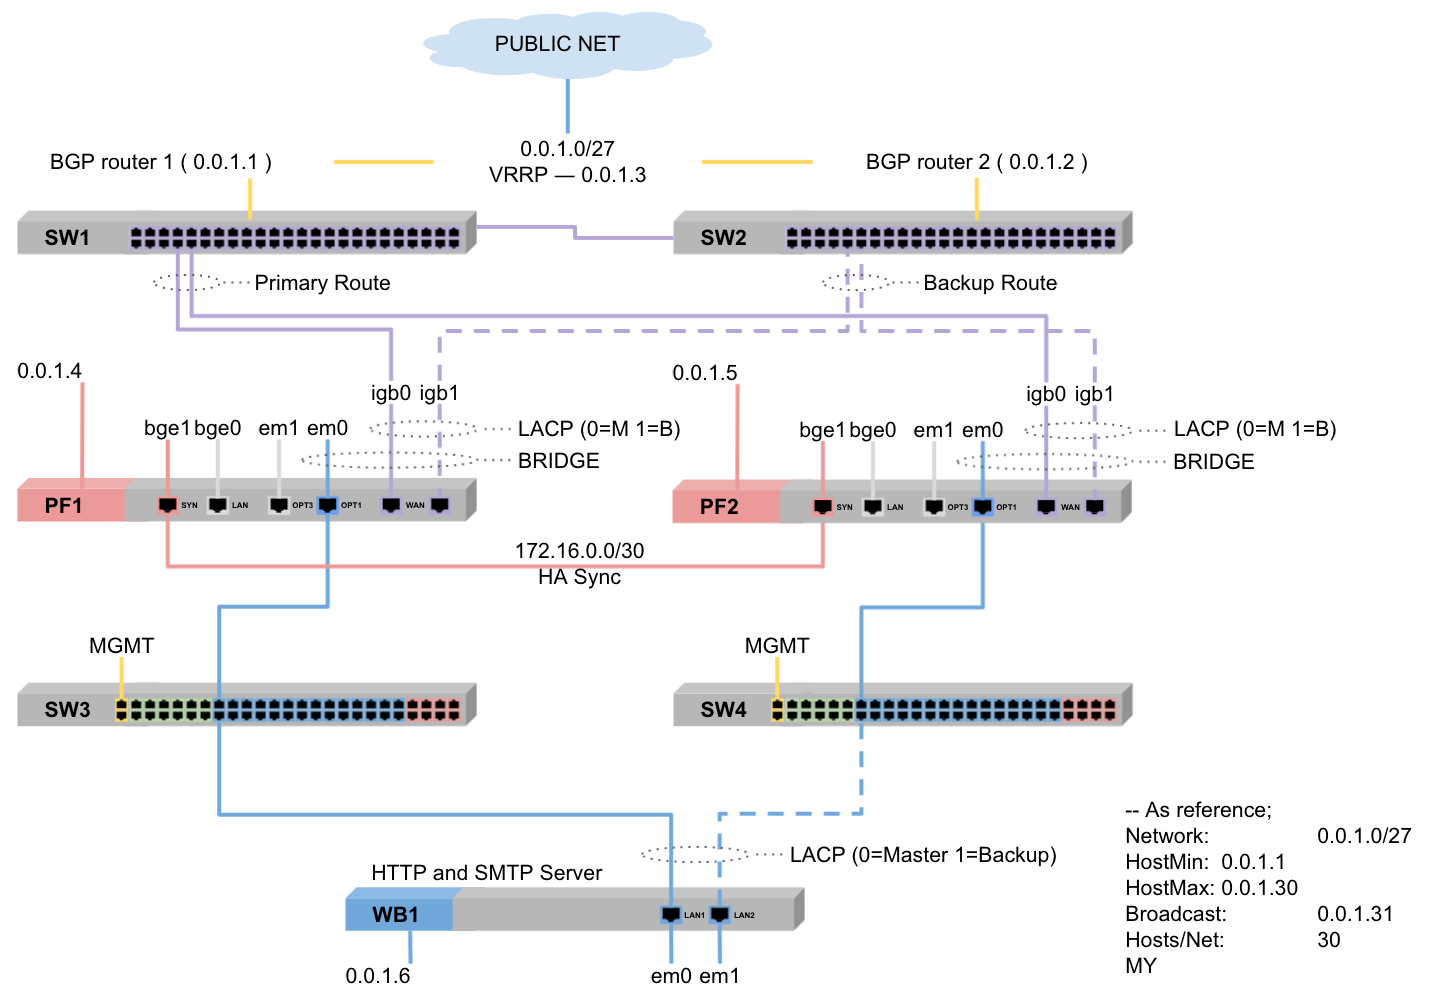
As shown the switches SW3 and SW4 aren't interconnected to avoid loops.
For redundancy I use a combination of LACP in failover mode and VRRP IP as default gateway instead of use pfSense CARP configuration.
The reason to enable HA is to have the pfSense Sessions, Alias and Rules synchronized.
For the servers behind, as shown WB1, there's two connectivity ways;
- Master to SW3 (SW4 as Backup) WB1
- Master to SW4 (SW3 as Backup) * WB2
- Image
It means, both pfSense can handle traffic simultaneously. Although being configured as HA Master / Backup they work as Active / Active. Did you had some experience like that before?
Regarding the hight CPU interrupt time % issue.
After change the parameters below, the performance looks better then before. I still monitoring it.
System Tunables
net.link.bridge.pfil_bridge = 0 to 1
net.link.bridge.pfil_member = 1 to 0MY