Netgate Discussion Forum
    • Categories
    • Recent
    • Tags
    • Popular
    • Users
    • Search
    • Register
    • Login

    dashboard traffic graph vs status traffic graph

    Scheduled Pinned Locked Moved General pfSense Questions
    2 Posts 2 Posters 270 Views
    Loading More Posts
    • Oldest to Newest
    • Newest to Oldest
    • Most Votes
    Reply
    • Reply as topic
    Log in to reply
    This topic has been deleted. Only users with topic management privileges can see it.
    • U
      ukhobo
      last edited by

      Hi all,

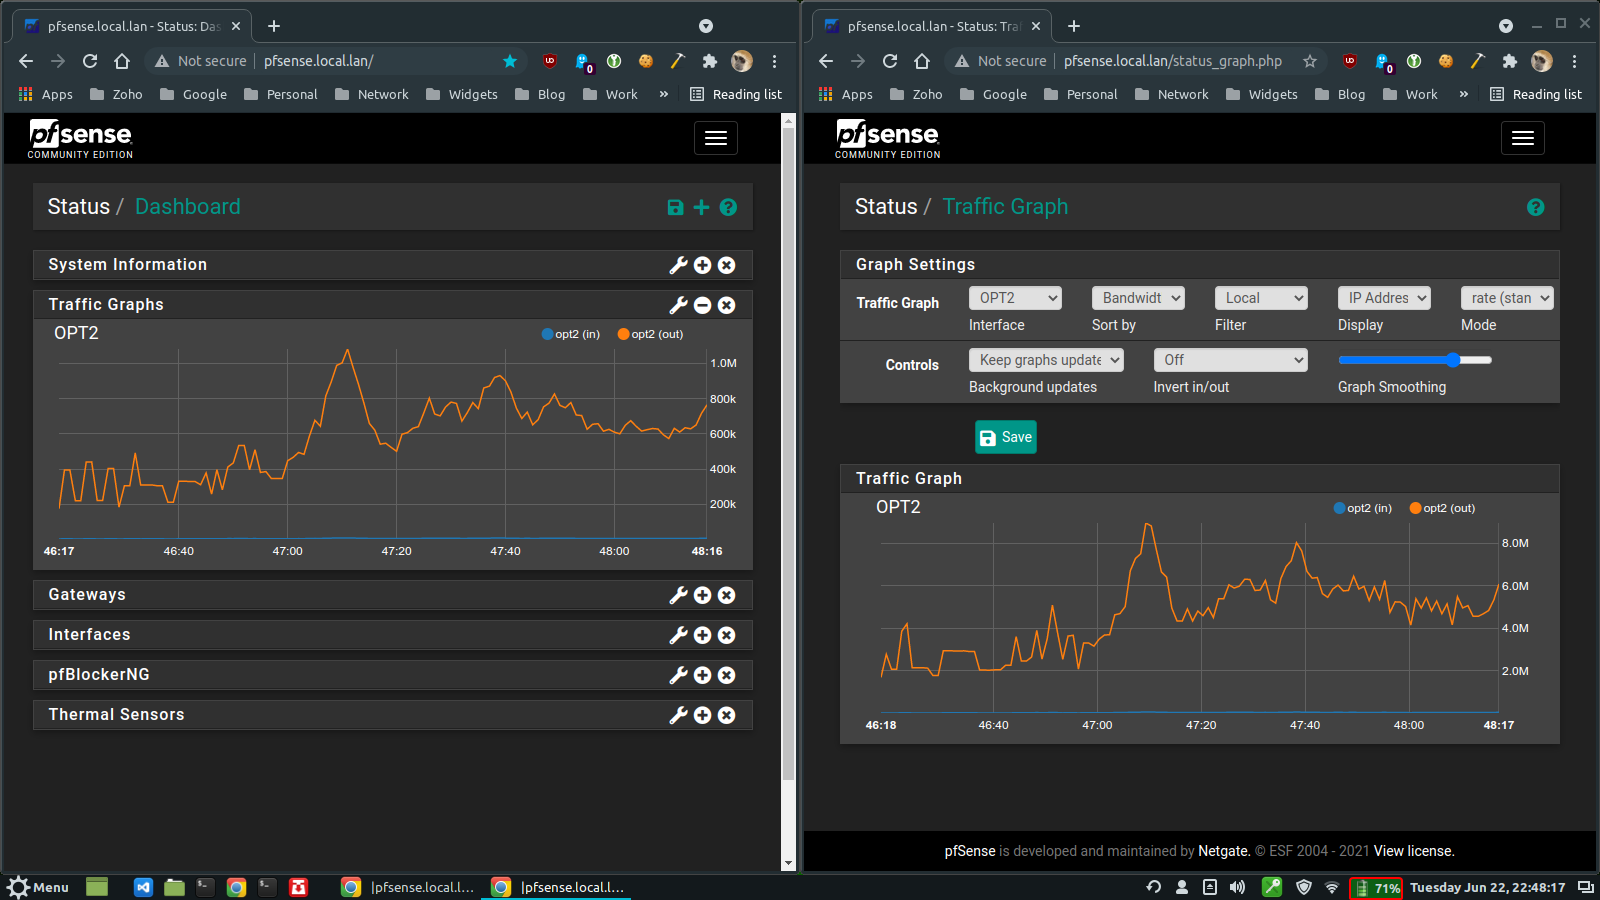
      Whilst setting up a traffic graph for one of my interfaces I noticed a difference in the reported throughput between what is shown in the dashboard traffic graph vs the same traffic graph setup in the status menu.

      As far as I can see the general trend tracks reasonably well between the two but the vertical scale seems to be off in the dashboard graph for the traffic that I imagine is going through this interface.

      Does anyone have any idea what I'm seeing here?

      Many thanks, Joe

      Screenshot from 2021-06-22 22-48-17.png

      johnpozJ 1 Reply Last reply Reply Quote 0
      • johnpozJ
        johnpoz LAYER 8 Global Moderator @ukhobo
        last edited by

        Smoothing can cause stuff like this for sure..

        Also filtering could come into play as well. And have not played much with the mode..

        An intelligent man is sometimes forced to be drunk to spend time with his fools
        If you get confused: Listen to the Music Play
        Please don't Chat/PM me for help, unless mod related
        SG-4860 24.11 | Lab VMs 2.7.2, 24.11

        1 Reply Last reply Reply Quote 0
        • First post
          Last post
        Copyright 2025 Rubicon Communications LLC (Netgate). All rights reserved.