Netgate Discussion Forum
    • Categories
    • Recent
    • Tags
    • Popular
    • Users
    • Search
    • Register
    • Login

    2.5.2 multi-WAN Traffic Graphs speeds shown x1/2

    General pfSense Questions
    3
    7
    622
    Loading More Posts
    • Oldest to Newest
    • Newest to Oldest
    • Most Votes
    Reply
    • Reply as topic
    Log in to reply
    This topic has been deleted. Only users with topic management privileges can see it.
    • M
      mikahe
      last edited by

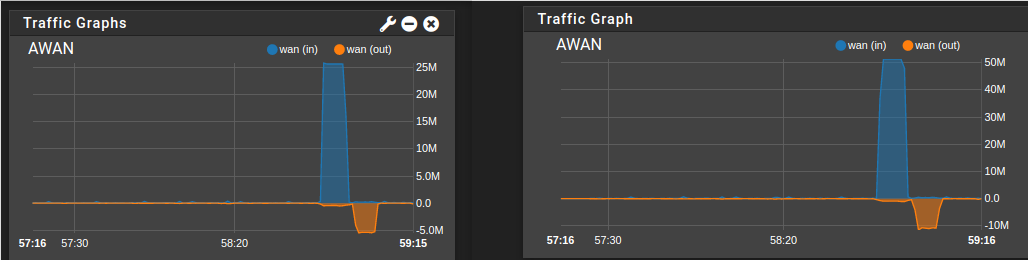
      Updated 2.4.5p1 to 2.5.2 with multi-WAN interfaces (3) and noticed Status / Dashboard Traffic Graphs showing 1/2 of true DL/UL speed (Inverse: On, Unit Size: Bits). This is not happening in LAN if.
      In screenshot: Left: Status/Dashboard (ng) Right: Status/Traffic Graph (ok)
      b9662e7e-213c-415a-b6d7-bc3132041548-image.png

      1 Reply Last reply Reply Quote 0
      • stephenw10S
        stephenw10 Netgate Administrator
        last edited by

        Is it a PPPoE connection?

        M 1 Reply Last reply Reply Quote 0
        • M
          mikahe @stephenw10
          last edited by

          @stephenw10 nope

          1 Reply Last reply Reply Quote 0
          • stephenw10S
            stephenw10 Netgate Administrator
            last edited by

            VLAN? Some other virtual interface type?

            M 1 Reply Last reply Reply Quote 0
            • M
              mikahe @stephenw10
              last edited by

              @stephenw10 Nothing special in WAN side. Issue was present in all WAN interfaces, even the most basic one with just IPv4 DHCP and absolutely nothing custom there.

              I noticed however in config, that there was some old junk from pfblockerng and suricata. Those packages have been removed long ago before the upgrade. I removed those and restored the config. Maybe it was that or just the extra related reboot due to config restore (after the 2.4.5p1->2.5.2 update I haven't done a single extra reboot manually) that did it, but now also Status / Dashboard Traffic Graphs are showing correct bitrates. Looks like case closed:
              7eea9242-6a46-4f91-af7a-c8fe6723dd50-image.png

              1 Reply Last reply Reply Quote 0
              • provelsP
                provels
                last edited by provels

                I had noticed similar performance on my vanilla single WAN cable setup. Page refresh would restore correct display. ¯\(ツ)/¯

                Old post here

                Peder

                MAIN - pfSense+ 24.11-RELEASE - Adlink MXE-5401, i7, 16 GB RAM, 64 GB SSD. 500 GB HDD for SyslogNG
                BACKUP - pfSense+ 23.01-RELEASE - Hyper-V Virtual Machine, Gen 1, 2 v-CPUs, 3 GB RAM, 8GB VHDX (Dynamic)

                M 1 Reply Last reply Reply Quote 1
                • M
                  mikahe @provels
                  last edited by

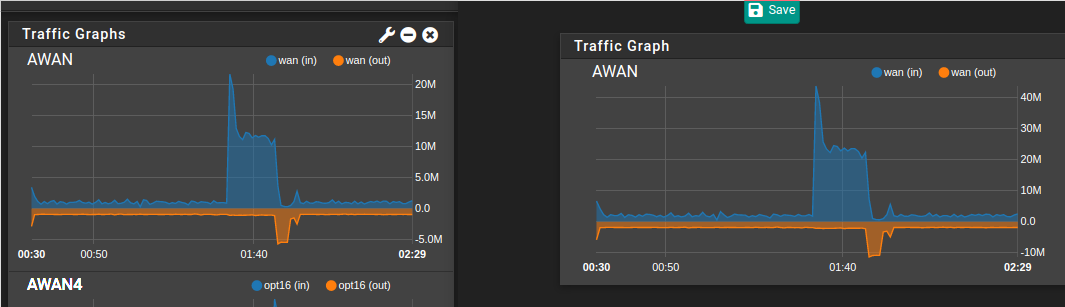
                  @provels You're right. I noticed the issue again. After reloading Dashboard tab the scale was back to correct again. Here's screenshot before that (Left: Dashboard, Right (ok): Status/Traffic graph)
                  fd08a016-fdb5-4465-90a3-c545ae435e38-image.png

                  1 Reply Last reply Reply Quote 0
                  • First post
                    Last post
                  Copyright 2025 Rubicon Communications LLC (Netgate). All rights reserved.