Netgate Discussion Forum
    • Categories
    • Recent
    • Tags
    • Popular
    • Users
    • Search
    • Register
    • Login

    Status/Queues page bar graph incorrect

    Scheduled Pinned Locked Moved Traffic Shaping
    1 Posts 1 Posters 374 Views
    Loading More Posts
    • Oldest to Newest
    • Newest to Oldest
    • Most Votes
    Reply
    • Reply as topic
    Log in to reply
    This topic has been deleted. Only users with topic management privileges can see it.
    • S
      SteveITS Galactic Empire
      last edited by SteveITS

      As I'm digging into my bandwidth issue more, I find myself confused about the bar graphs.

      When I first open the Status/Queues page it defaults to PPS I get this:
      483f4880-e4e5-47ab-8f41-e6e7f524360a-image.png

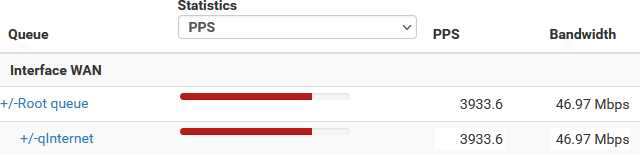
      If I change to bandwidth I get roughly the same:
      3a0e887b-d8d8-4206-ab36-182f078662f8-image.png
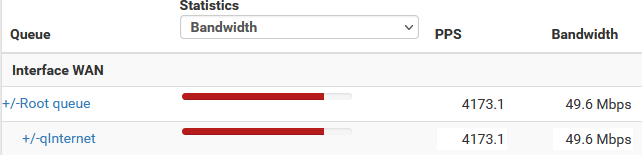
      ...except in the opposite direction of flow (WAN for downloading, LAN for uploading) the graphs shrink about 75%.
      However since Root and qInternet are both set to 100 Mbps shouldn't this graph be around 50% full? Or is something else throttling the overall connection so the pipe is appearing mostly full?

      If I change back to PPS the graphs all disappear/go to zero:
      b9159f0a-4694-420d-9f5f-f844ae3557bc-image.png

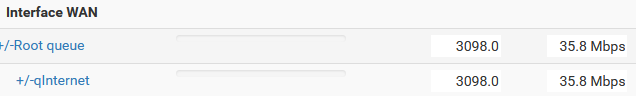
      Can reproduce on at least 4 routers with both 21.05 and a 2.5.2. Is the default actually showing Bandwidth not PPS? Is PPS supposed to graph anything?

      Pre-2.7.2/23.09: Only install packages for your version, or risk breaking it. Select your branch in System/Update/Update Settings.
      When upgrading, allow 10-15 minutes to restart, or more depending on packages and device speed.
      Upvote 👍 helpful posts!

      1 Reply Last reply Reply Quote 0
      • First post
        Last post
      Copyright 2025 Rubicon Communications LLC (Netgate). All rights reserved.