Traffic Graph x axis
-
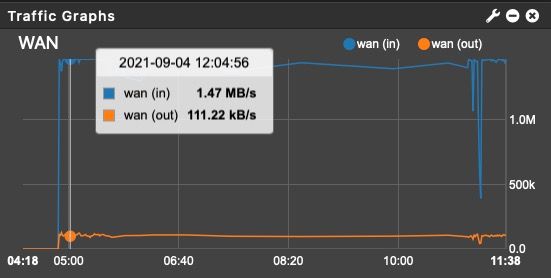
So im trying to find out what the x axis actually represents.
If I mouse over I can see the time which is what I would expect it to be and that looks fine but the numbers along the bottom of the graph mean nothing to me.
Anyone know what they are?
Thanks
Rob -
@hulleyrob Those are minutes and seconds.. Notice your time stamp 12:04:56, on the minute scale on X that is really close to your 5:00 mark..
Here
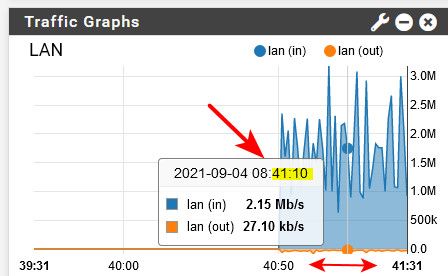
See where I highlight 2021-9-4 08:41:10
On the X that falls between 40 min 50 seconds and 41 min and 31 seconds..
-
@johnpoz got it thanks, never thought of that !
Copyright 2025 Rubicon Communications LLC (Netgate). All rights reserved.