Gateway WAN keeps on having packet lost
-
@cheapie408 said in Gateway WAN keeps on having packet lost:
When I ping a public dns there are lot of time outs.
What if that public dns is doing what it should do : answering DNS requests, and what if it has less free time to answer to reply on ping requests ?
What if the peering of your ISP to this dns is overloaded ? Guess what protocol gets dropped first ?
If 8.8.8.8 misses some ICMP replies, you will start to think your connection is bad.As @stephenw10 already proposed : use another motoring IP much -way more - closer to you.
You only to monitoring your access to the Internet, not the entire road to 8.8.8.8. -
How is the client connected to those things you are pinging locally? 192.168.1.1 and 192.168.1.100?
Because although there is no packet loss shown there they are spiking latency up to 26ms which is ridiculously high for a local device. And that appears to be at the same time you are seeing loss to the external IPs.
Which links are common to all 4 of those pings?
Steve
-
@stephenw10 said in Gateway WAN keeps on having packet lost:
Which links are common to all 4 of those pings?
@cheapie408 here's the problem, pay attention. to the common factor
-
@Gertjan I did change the monitoring IP to another with no success.
@stephenw10 All of the equipment are connected to the same switch in my office with cables no longer than 15ft.
Which links are common to all 4 of those pings?
Can you elaborate? -
You are seeing issues with pings to all 4 of those targets so what is shared?
It's the same client machine so same NIC, same cable, same switch port.
Then pfSense at 192.168.1.1 is on another switch port I assume and 192.168.1.100 is on a different port?
So the switch is common but pings to 192.168.1.100 probably do not go through pfSense at all yet are still jumping up to 26ms.....
-
@stephenw10 said in Gateway WAN keeps on having packet lost:
n pfSense at 192.168.1.1 is on another switch port I assume and 192.168.1.100 is on a different port?
So the switch is common but pings to 192.168.1.100 probably do not go through pfSense at all yet are still jumping up to 26ms192.168.1.100 is my NAS that is LAG enabled maybe why?
Something just came to mind, I was performing speed tests while it was pinging which may be the reason for the increase ping time
-
Is the client you are pinging from in the same 192.168.1.X subnet?
If so pings between there and the NAS don't go through pfSense at all but are still spiking up to 26ms at the same time. That implies some issue locally. Or maybe something flooding the switch?
A loop at the switch that it blocks and then re-enables could behave like this. The lagg incorrectly configured could do that. Try disconnecting one of the links.Steve
-
@stephanw10
I run everything on a 24 ports POE switch that also powers 16 IP cameras and the PC that I'm doing all this on is also the one Blue Iris resides.
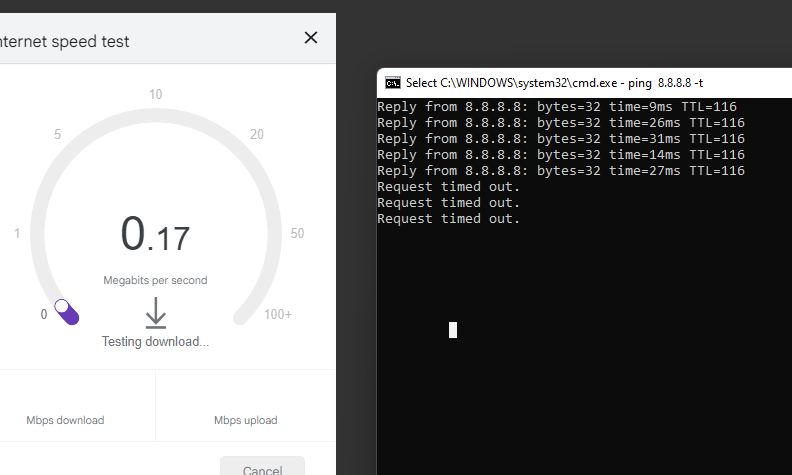
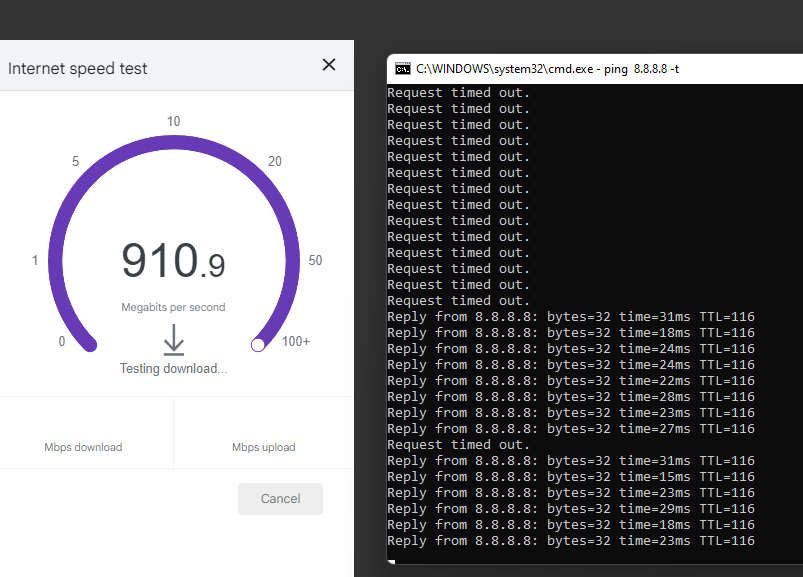
I just factory reset the Pfsense box. As I'm typing this, with no additional configuration. Took the switch out of the equation, basically this PC directly into the Pfsense box and nothing else attached to the pfsense box. This is what I'm getting while it's timing out and while it's responding
-
What hardware are you running pfSense on?
-
@stephenw10 said in Gateway WAN keeps on having packet lost:
What hardware are you running pfSense on?
T620 (i think)
AMD GX-420CA SOC with Radeon(tm) HD Graphics
16Gb ramIntel 4x NIC card don't remember the exact model
-
Hmm, and you're running 2.5.2?
And this just started happening? It was running without loss previously?
-
@stephenw10 said in Gateway WAN keeps on having packet lost:
Hmm, and you're running 2.5.2?
And this just started happening? It was running without loss previously?
Yes on 2.5.2. I can't say how long has this been going on. In fact for many months I don't log onto PFsense. I recently tried to add a MyQ garage opener and realised that it won't report online (I have another thread here on this subject). which triggered me to look at PFSense.
Now that I'm thinking of it, my kids play Roblox and they are constantly kicked out of their games. It's been quite some time now.
-
Ok can we assume that without any other traffic using the connection the WAN gateways show as up and without packet loss?
If you connect via ssh and run
top -aSHand the command line do you see any CPU cores being run at 100%? (idle processes at or close to 0%).That CPU appears to be well capable of 1Gbps but it's single thread performance is not fantastic and em NICs run with 1 queue. I still wouldn't expect anything like this though.
-
@stephenw10
The WAN interface never really get reported as being down which is very weird, but on the gateway status, it does show off. It also seems that IPv4 shows to be off more often than IPV6.With nothing else in the mix, I still experience packet loss.
top -aSH didn't pull up any CPU info.
Diagnostics/System activity it does show that the WCPU cores are all running at or close too 100%
11 root 155 ki31 0B 64K CPU0 0 87:04 98.88% [idle{idle: cpu0}]
11 root 155 ki31 0B 64K RUN 3 87:12 98.68% [idle{idle: cpu3}]
11 root 155 ki31 0B 64K CPU1 1 87:31 95.36% [idle{idle: cpu1}]
11 root 155 ki31 0B 64K CPU2 2 87:14 93.07% [idle{idle: cpu2}] -
top -aSHat the command line looks like:last pid: 89077; load averages: 0.35, 0.55, 0.54 up 0+01:13:06 19:15:26 179 threads: 3 running, 150 sleeping, 26 waiting CPU: 0.8% user, 0.0% nice, 1.4% system, 0.0% interrupt, 97.9% idle Mem: 55M Active, 976M Inact, 368M Wired, 195M Buf, 521M Free Swap: 1894M Total, 1894M Free PID USERNAME PRI NICE SIZE RES STATE C TIME WCPU COMMAND 11 root 155 ki31 0B 32K RUN 0 71:51 99.09% [idle{idle: cpu0}] 11 root 155 ki31 0B 32K CPU1 1 71:32 96.63% [idle{idle: cpu1}] 1720 root 52 0 132M 55M accept 1 0:05 0.16% php-fpm: pool nginx (php-fpm) 0 root -76 - 0B 464K - 1 0:05 0.09% [kernel{if_config_tqg_0}] 84138 root 20 0 13M 4028K CPU0 0 0:00 0.07% top -aSH 12 root -60 - 0B 416K WAIT 0 0:01 0.06% [intr{swi4: clock (0)}] 80075 root 20 0 28M 9636K kqread 0 0:01 0.02% nginx: worker process (nginx) 18 root -16 - 0B 16K pftm 1 0:01 0.02% [pf purge] 0 root -76 - 0B 464K - 0 0:00 0.01% [kernel{if_io_tqg_0}] 41729 root 20 0 11M 2840K select 1 0:00 0.01% /usr/sbin/syslogd -s -c -c -l /var/dhcpd/var/run/logYou can see both CPU cores are mostly idle there. If anything was using a lot of CPU it would show above that.
-
-
Hmm, that was whilst you are passing traffic? Like running a speedtest?
I expect to see far more CPU usage than that. Nothing there looks like an issue though.
-
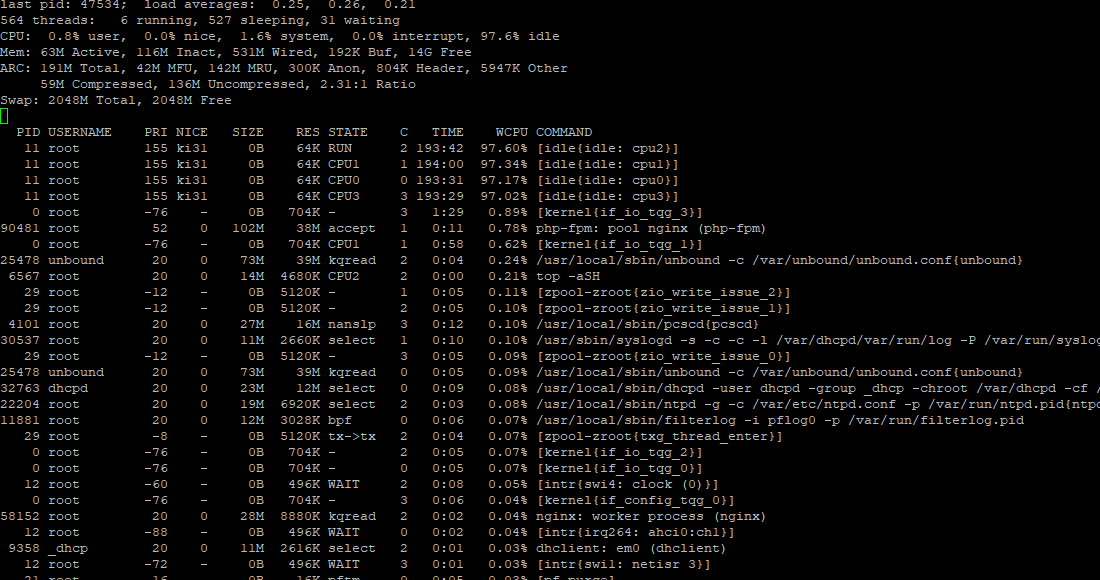
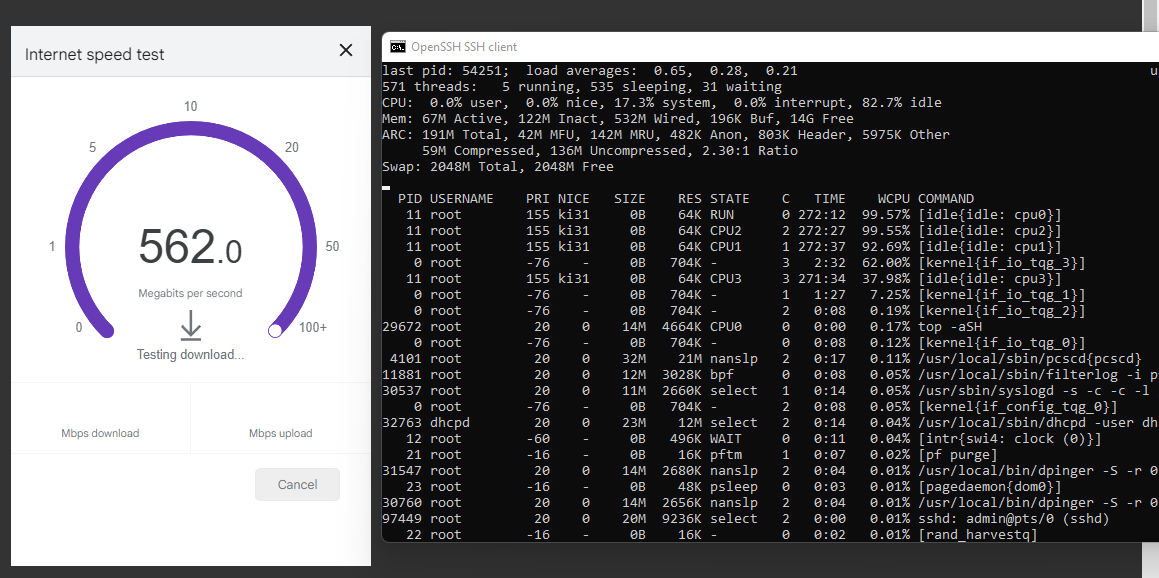
sorry that was it idling here's one while I'm running a speed test. Noticed how I drop to around 500Mbps now
-
Mmm, nothing unusual there either. No CPU core maxed out.
I guess I would be running a packet capture on the WAN at this point to see what's actually happening. Are there a load of retransmissions or packet fragments etc.
Steve
-
@stephenw10
i'll try to do that...how long should I be running the packet capture for?here's a screen capture of the entire speedtest process.
https://vimeo.com/manage/videos/661294436/f74c230e65