pfSense dropping connection every hour (XX:50)
-
I've had an issue for a while with FreePBX losing connection to trunks and not reconnecting, and re-connecting only when I clear the states for FreePBX's IP address.
I decided to look more into it and it looks like pfSense is causing the issue looking at the logs.
I'm not sure if pfSense freezes because when browsing the internet 'stops' during the same period.
Status/System/Logs/System/Gateways
Jan 29 17:50:35	dpinger	78542	WAN_DHCP 1.1.1.1: Clear latency 24693us stddev 8372us loss 5%
Jan 29 17:49:24	dpinger	78542	WAN_DHCP 1.1.1.1: Alarm latency 33117us stddev 2579us loss 22%
Jan 29 16:49:46	dpinger	78542	WAN_DHCP 1.1.1.1: Clear latency 33503us stddev 1587us loss 5%
Jan 29 16:48:34	dpinger	78542	WAN_DHCP 1.1.1.1: Alarm latency 36949us stddev 10080us loss 22%
Status/System/Logs/System/DNS Resolver
Jan 29 17:50:37	filterdns	55245	Adding Action: pf table: SIP_Trunks host: localphone.com
Jan 29 17:50:37	filterdns	55245	Adding Action: pf table: SIP_Trunks host: sipgate.co.uk
Jan 29 17:50:37	filterdns	55245	merge_config: configuration reload
Jan 29 17:49:26	filterdns	55245	Adding Action: pf table: SIP_Trunks host: localphone.com
Jan 29 17:49:26	filterdns	55245	Adding Action: pf table: SIP_Trunks host: sipgate.co.uk
Jan 29 17:49:26	filterdns	55245	merge_config: configuration reload
Jan 29 17:41:37	filterdns	55245	Adding Action: pf table: SIP_Trunks host: localphone.com
Jan 29 17:41:37	filterdns	55245	Adding Action: pf table: SIP_Trunks host: sipgate.co.uk
Jan 29 17:41:34	filterdns	55245	merge_config: configuration reload
Jan 29 17:41:29	filterdns	55245	Adding Action: pf table: SIP_Trunks host: localphone.com
Jan 29 17:41:29	filterdns	55245	Adding Action: pf table: SIP_Trunks host: sipgate.co.uk
Jan 29 17:41:29	filterdns	55245	merge_config: configuration reload
Jan 29 17:41:27	unbound	71449	[71449:0] info: start of service (unbound 1.12.0).
Jan 29 17:41:27	unbound	71449	[71449:0] notice: init module 0: iterator
Jan 29 17:41:25	unbound	17490	[17490:0] info: 64.000000 128.000000 1
Jan 29 17:41:25	unbound	17490	[17490:0] info: 32.000000 64.000000 1
Jan 29 17:41:25	unbound	17490	[17490:0] info: 16.000000 32.000000 4
And packet loss almost every hour at about 50 minutes past the hour.
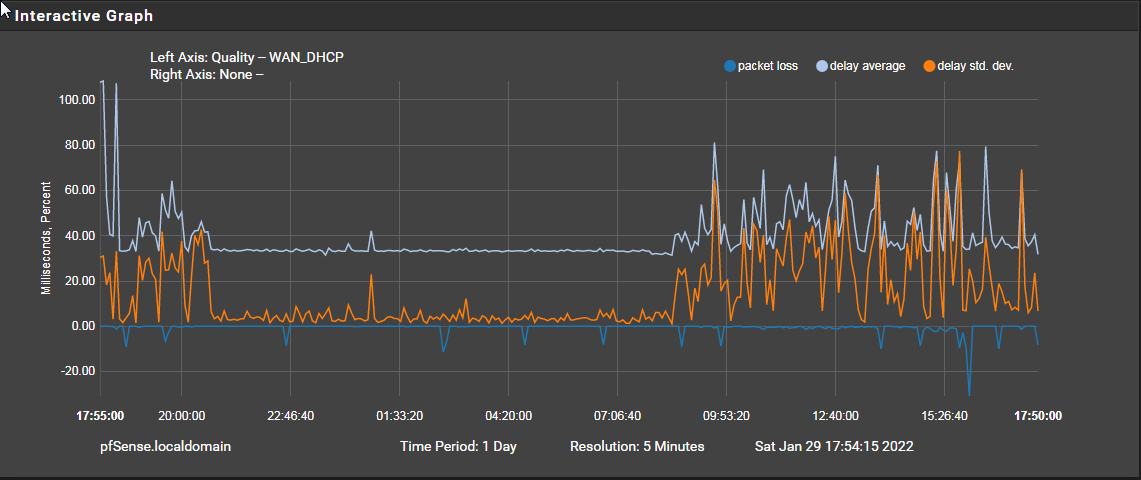
My modem and line appear to stay up during the periods of dropping with nothing my ISPs or modem logs
-
It looks like an issue with Unbound stopping ?
Jan 30 14:32:14 unbound 42937 [42937:0] info: start of service (unbound 1.12.0). Jan 30 14:32:14 unbound 42937 [42937:0] notice: init module 0: iterator Jan 30 14:31:57 unbound 42937 [42937:0] notice: Restart of unbound 1.12.0. Jan 30 14:31:57 unbound 42937 [42937:0] info: 64.000000 128.000000 1 Jan 30 14:31:57 unbound 42937 [42937:0] info: 32.000000 64.000000 15 Jan 30 14:31:57 unbound 42937 [42937:0] info: 16.000000 32.000000 3 Jan 30 14:31:57 unbound 42937 [42937:0] info: 8.000000 16.000000 6 Jan 30 14:31:57 unbound 42937 [42937:0] info: 4.000000 8.000000 8 Jan 30 14:31:57 unbound 42937 [42937:0] info: 2.000000 4.000000 4 Jan 30 14:31:57 unbound 42937 [42937:0] info: 1.000000 2.000000 23 Jan 30 14:31:57 unbound 42937 [42937:0] info: 0.524288 1.000000 54 Jan 30 14:31:57 unbound 42937 [42937:0] info: 0.262144 0.524288 94 Jan 30 14:31:57 unbound 42937 [42937:0] info: 0.131072 0.262144 208 Jan 30 14:31:57 unbound 42937 [42937:0] info: 0.065536 0.131072 23 Jan 30 14:31:57 unbound 42937 [42937:0] info: lower(secs) upper(secs) recursions Jan 30 14:31:57 unbound 42937 [42937:0] info: [25%]=0.185738 median[50%]=0.254897 [75%]=0.561728 Jan 30 14:31:57 unbound 42937 [42937:0] info: histogram of recursion processing times Jan 30 14:31:57 unbound 42937 [42937:0] info: average recursion processing time 2.425595 sec Jan 30 14:31:57 unbound 42937 [42937:0] info: server stats for thread 3: requestlist max 5 avg 0.553288 exceeded 0 jostled 0 Jan 30 14:31:57 unbound 42937 [42937:0] info: server stats for thread 3: 784 queries, 343 answers from cache, 441 recursions, 0 prefetch, 0 rejected by ip ratelimiting Jan 30 14:31:57 unbound 42937 [42937:0] info: 64.000000 128.000000 4 Jan 30 14:31:57 unbound 42937 [42937:0] info: 32.000000 64.000000 15 Jan 30 14:31:57 unbound 42937 [42937:0] info: 16.000000 32.000000 12 Jan 30 14:31:57 unbound 42937 [42937:0] info: 8.000000 16.000000 8 Jan 30 14:31:57 unbound 42937 [42937:0] info: 4.000000 8.000000 13 Jan 30 14:31:57 unbound 42937 [42937:0] info: 2.000000 4.000000 10 Jan 30 14:31:57 unbound 42937 [42937:0] info: 1.000000 2.000000 36 Jan 30 14:31:57 unbound 42937 [42937:0] info: 0.524288 1.000000 68 Jan 30 14:31:57 unbound 42937 [42937:0] info: 0.262144 0.524288 119 Jan 30 14:31:57 unbound 42937 [42937:0] info: 0.131072 0.262144 219 Jan 30 14:31:57 unbound 42937 [42937:0] info: 0.065536 0.131072 22 Jan 30 14:31:57 unbound 42937 [42937:0] info: 0.016384 0.032768 1 Jan 30 14:31:57 unbound 42937 [42937:0] info: 0.000000 0.000001 1 Jan 30 14:31:57 unbound 42937 [42937:0] info: lower(secs) upper(secs) recursions Jan 30 14:31:57 unbound 42937 [42937:0] info: [25%]=0.19571 median[50%]=0.308405 [75%]=0.762144 Jan 30 14:31:57 unbound 42937 [42937:0] info: histogram of recursion processing times Jan 30 14:31:57 unbound 42937 [42937:0] info: average recursion processing time 3.105196 sec Jan 30 14:31:57 unbound 42937 [42937:0] info: server stats for thread 2: requestlist max 6 avg 0.879017 exceeded 0 jostled 0 Jan 30 14:31:57 unbound 42937 [42937:0] info: server stats for thread 2: 1012 queries, 483 answers from cache, 529 recursions, 0 prefetch, 0 rejected by ip ratelimiting Jan 30 14:31:57 unbound 42937 [42937:0] info: 64.000000 128.000000 2 Jan 30 14:31:57 unbound 42937 [42937:0] info: 32.000000 64.000000 4 Jan 30 14:31:57 unbound 42937 [42937:0] info: 16.000000 32.000000 9 Jan 30 14:31:57 unbound 42937 [42937:0] info: 8.000000 16.000000 10 Jan 30 14:31:57 unbound 42937 [42937:0] info: 4.000000 8.000000 4 Jan 30 14:31:57 unbound 42937 [42937:0] info: 2.000000 4.000000 4 Jan 30 14:31:57 unbound 42937 [42937:0] info: 1.000000 2.000000 9 Jan 30 14:31:57 unbound 42937 [42937:0] info: 0.524288 1.000000 24 Jan 30 14:31:57 unbound 42937 [42937:0] info: 0.262144 0.524288 40 Jan 30 14:31:57 unbound 42937 [42937:0] info: 0.131072 0.262144 123 Jan 30 14:31:57 unbound 42937 [42937:0] info: 0.065536 0.131072 4 Jan 30 14:31:57 unbound 42937 [42937:0] info: lower(secs) upper(secs) recursions Jan 30 14:31:57 unbound 42937 [42937:0] info: [25%]=0.188882 median[50%]=0.250955 [75%]=0.677903 Jan 30 14:31:57 unbound 42937 [42937:0] info: histogram of recursion processing times Jan 30 14:31:57 unbound 42937 [42937:0] info: average recursion processing time 3.457023 sec Jan 30 14:31:57 unbound 42937 [42937:0] info: server stats for thread 1: requestlist max 2 avg 0.361702 exceeded 0 jostled 0 Jan 30 14:31:57 unbound 42937 [42937:0] info: server stats for thread 1: 350 queries, 115 answers from cache, 235 recursions, 0 prefetch, 0 rejected by ip ratelimiting Jan 30 14:31:57 unbound 42937 [42937:0] info: 64.000000 128.000000 1 Jan 30 14:31:57 unbound 42937 [42937:0] info: 32.000000 64.000000 15 Jan 30 14:31:57 unbound 42937 [42937:0] info: 16.000000 32.000000 11 Jan 30 14:31:57 unbound 42937 [42937:0] info: 8.000000 16.000000 16 Jan 30 14:31:57 unbound 42937 [42937:0] info: 4.000000 8.000000 12 Jan 30 14:31:57 unbound 42937 [42937:0] info: 2.000000 4.000000 15 Jan 30 14:31:57 unbound 42937 [42937:0] info: 1.000000 2.000000 36 Jan 30 14:31:57 unbound 42937 [42937:0] info: 0.524288 1.000000 100 Jan 30 14:31:57 unbound 42937 [42937:0] info: 0.262144 0.524288 160 Jan 30 14:31:57 unbound 42937 [42937:0] info: 0.131072 0.262144 314 Jan 30 14:31:57 unbound 42937 [42937:0] info: 0.065536 0.131072 43 Jan 30 14:31:57 unbound 42937 [42937:0] info: 0.032768 0.065536 1 Jan 30 14:31:57 unbound 42937 [42937:0] info: lower(secs) upper(secs) recursions Jan 30 14:31:57 unbound 42937 [42937:0] info: [25%]=0.188259 median[50%]=0.268698 [75%]=0.643216 Jan 30 14:31:57 unbound 42937 [42937:0] info: histogram of recursion processing times Jan 30 14:31:57 unbound 42937 [42937:0] info: average recursion processing time 2.094595 sec Jan 30 14:31:57 unbound 42937 [42937:0] info: server stats for thread 0: requestlist max 7 avg 1.03039 exceeded 0 jostled 0 Jan 30 14:31:57 unbound 42937 [42937:0] info: server stats for thread 0: 1301 queries, 577 answers from cache, 724 recursions, 0 prefetch, 0 rejected by ip ratelimiting Jan 30 14:31:57 unbound 42937 [42937:0] info: service stopped (unbound 1.12.0). -
It's being restarted because of the WAN gateway event, packet loss > 20%.
If you only have one WAN you can disable the gateway action since it never fails over.
In System > Routing > Gateways edit the WAN gateway and check:Disable Gateway Monitoring Action
Only that, do not disable gateway monitoring completely or you'll have no stats to see what's happening.You can also try setting a different monitor IP. It could just be the gateway IP dropping pings under load.
If you really are seeing 20% packet loss every hour you need to find out why.
Steve
-
@stephenw10 Thanks Steve, I was assuming it was something to do with CRON tasks and I turned off Snort thinking it was one of it's clearing task every hour causing the issue.
My gateway logs looks a mess with latency alarms -
Jan 30 16:14:48	dpinger	93244	send_interval 500ms loss_interval 2000ms time_period 60000ms report_interval 0ms data_len 1 alert_interval 1000ms latency_alarm 500ms loss_alarm 20% dest_addr 10.25.0.3 bind_addr 10.25.0.3 identifier "PROTONVPN_NL_VPNV4 "
Jan 30 16:14:48	dpinger	92888	send_interval 500ms loss_interval 2000ms time_period 60000ms report_interval 0ms data_len 1 alert_interval 1000ms latency_alarm 500ms loss_alarm 20% dest_addr 1.1.1.1 bind_addr 95.172.224.197 identifier "WAN_DHCP "
Jan 30 16:11:06	dpinger	62125	WAN_DHCP 1.1.1.1: Clear latency 36650us stddev 13715us loss 5%
Jan 30 16:09:53	dpinger	62125	WAN_DHCP 1.1.1.1: Alarm latency 22761us stddev 8864us loss 21%
Jan 30 15:10:18	dpinger	62125	WAN_DHCP 1.1.1.1: Clear latency 34044us stddev 2790us loss 5%
Jan 30 15:09:07	dpinger	62125	WAN_DHCP 1.1.1.1: Alarm latency 32782us stddev 7266us loss 22%
Jan 30 13:57:15	dpinger	62374	send_interval 500ms loss_interval 2000ms time_period 60000ms report_interval 0ms data_len 1 alert_interval 1000ms latency_alarm 500ms loss_alarm 20% dest_addr 10.25.0.3 bind_addr 10.25.0.3 identifier "PROTONVPN_NL_VPNV4 "
Jan 30 13:57:15	dpinger	62125	send_interval 500ms loss_interval 2000ms time_period 60000ms report_interval 0ms data_len 1 alert_interval 1000ms latency_alarm 500ms loss_alarm 20% dest_addr 1.1.1.1 bind_addr 95.172.224.197 identifier "WAN_DHCP "
Jan 30 12:06:40	dpinger	78542	WAN_DHCP 1.1.1.1: Clear latency 33406us stddev 965us loss 6%
Jan 30 12:05:30	dpinger	78542	WAN_DHCP 1.1.1.1: Alarm latency 45450us stddev 35793us loss 21%
Jan 30 10:04:17	dpinger	78542	WAN_DHCP 1.1.1.1: Clear latency 27470us stddev 8759us loss 5%
Jan 30 10:03:05	dpinger	78542	WAN_DHCP 1.1.1.1: Alarm latency 38152us stddev 18275us loss 21%
Jan 30 09:04:02	dpinger	78542	WAN_DHCP 1.1.1.1: Clear latency 33917us stddev 6029us loss 5%
Jan 30 09:02:41	dpinger	78542	WAN_DHCP 1.1.1.1: Alarm latency 52262us stddev 44016us loss 22%
Jan 30 08:03:03	dpinger	78542	WAN_DHCP 1.1.1.1: Clear latency 33318us stddev 275us loss 6%
Jan 30 08:01:51	dpinger	78542	WAN_DHCP 1.1.1.1: Alarm latency 54793us stddev 35239us loss 22%
Jan 30 07:02:17	dpinger	78542	WAN_DHCP 1.1.1.1: Clear latency 33292us stddev 410us loss 5%
Jan 30 07:01:06	dpinger	78542	WAN_DHCP 1.1.1.1: Alarm latency 17105us stddev 2230us loss 22%
Jan 30 06:00:44	dpinger	78542	WAN_DHCP 1.1.1.1: Clear latency 33548us stddev 2374us loss 5%
Jan 30 05:58:43	dpinger	78542	WAN_DHCP 1.1.1.1: Alarm latency 33444us stddev 3965us loss 21%
Jan 30 03:59:15	dpinger	78542	WAN_DHCP 1.1.1.1: Clear latency 33242us stddev 416us loss 5%
Jan 30 03:58:04	dpinger	78542	WAN_DHCP 1.1.1.1: Alarm latency 32853us stddev 3544us loss 21%
Jan 30 01:58:10	dpinger	78542	WAN_DHCP 1.1.1.1: Clear latency 33781us stddev 5139us loss 5%
Jan 30 01:56:58	dpinger	78542	WAN_DHCP 1.1.1.1: Alarm latency 33210us stddev 3804us loss 21%
Jan 30 00:57:35	dpinger	78542	WAN_DHCP 1.1.1.1: Clear latency 33298us stddev 427us loss 5%
Jan 30 00:56:22	dpinger	78542	WAN_DHCP 1.1.1.1: Alarm latency 23335us stddev 8280us loss 21%
Jan 30 00:56:07	dpinger	78542	WAN_DHCP 1.1.1.1: Clear latency 24385us stddev 8422us loss 5%
Jan 30 00:54:53	dpinger	78542	WAN_DHCP 1.1.1.1: Alarm latency 82937us stddev 85001us loss 21%
Jan 29 23:56:46	dpinger	78542	WAN_DHCP 1.1.1.1: Clear latency 33331us stddev 284us loss 5%
Jan 29 23:55:34	dpinger	78542	WAN_DHCP 1.1.1.1: Alarm latency 23615us stddev 9275us loss 21%
Jan 29 22:54:47	dpinger	78542	WAN_DHCP 1.1.1.1: Clear latency 33420us stddev 319us loss 5%
Jan 29 22:53:35	dpinger	78542	WAN_DHCP 1.1.1.1: Alarm latency 32657us stddev 3438us loss 21%
Jan 29 19:52:14	dpinger	78542	WAN_DHCP 1.1.1.1: Clear latency 26039us stddev 16170us loss 5%
Jan 29 19:51:15	dpinger	78542	WAN_DHCP 1.1.1.1: Alarm latency 52668us stddev 70776us loss 22%
I'll try a different monitor IP and see if that makes a difference and tick the gateway action Disable Gateway Monitoring Action .
-
I've also set the default gateway from Automatic to WAN_DHCP and restarted Snort. Unbound still appears to stop but system/gateways isn't showing anything new - as yet. FreePBX's trunks are staying connected, before only reconnecting with a FreePBX restart or killing FreePBX's states in Pfsense.
As to why Unbound is stopping I can't figure that out, as I said before I assumed it was a cron job 'messing' with Unbound.
1,31 0-5 * * * root /usr/bin/nice -n20 adjkerntz -a 1 3 * * 0 root /usr/bin/nice -n20 /etc/rc.update_bogons.sh 1 1 * * * root /usr/bin/nice -n20 /etc/rc.dyndns.update */60 * * * * root /usr/bin/nice -n20 /usr/local/sbin/expiretable -v -t 3600 virusprot 30 12 * * * root /usr/bin/nice -n20 /etc/rc.update_urltables 1 0 * * * root /usr/bin/nice -n20 /etc/rc.update_pkg_metadata 1 7 * * * root /usr/local/bin/php -q /root/pkg_check.php */1 * * * * root /usr/sbin/newsyslog 1 3 * * * root /etc/rc.periodic daily 15 4 * * 6 root /etc/rc.periodic weekly 30 5 1 * * root /etc/rc.periodic monthly 1 0 * * 1 root pkg update && pkg upgrade -y 51 04 * * 2,4,6 root /usr/bin/nice -n20 /usr/local/bin/php /usr/local/sbin/execacb.php 14 0 */1 * * root /usr/bin/nice -n20 /usr/local/bin/php -f /usr/local/pkg/snort/snort_check_for_rule_updates.php 0 7 4-10 * * root /usr/local/bin/php /usr/local/www/pfblockerng/pfblockerng.php dcc >> /var/log/pfblockerng/extras.log 2>&1 15 0,12 * * * root /usr/local/bin/php /usr/local/www/pfblockerng/pfblockerng.php cron >> /var/log/pfblockerng/pfblockerng.log 2>&1 */5 * * * * root /usr/bin/nice -n20 /usr/local/bin/php -f /usr/local/pkg/snort/snort_check_cron_misc.inc */2 * * * * root /usr/bin/nice -n20 /sbin/pfctl -q -t snort2c -T expire 900 -
Unbound is restarted by the gateway down/up scripts along with a bunch of other things that don't need to happen on a single WAN system. So the first thing is to disable the gateway action which will stop all that.
The next place I would look is in the traffic graphs. Do you have something uploading a load of stuff at that time? Saturating the WAN upload can produce latency spike like that.
Steve
-
@stephenw10 Things now seem a lot better than previously but Unbound is still restarting, FreePBX's trunks has stayed connected so far. I had no idea that lots of things can restart Unbound, the WAN isn't very loaded but I do have a poor ADSL line, which, could be causing the issue? my speeds are currently connected at 835 / 2.723 kbps/kbps up and down
 I have pfSense running on an mini-itx board Intel DQ77KB with a i5-2390T CPU @ 2.70GHz and 3GB of ram and dual onboard Intel NIC's (Intel 82579LM & Intel 82574L). Could saturating my slow line be causing an issue just a thought.
Thanks Steve for all your suggestions and help
Dave.
-
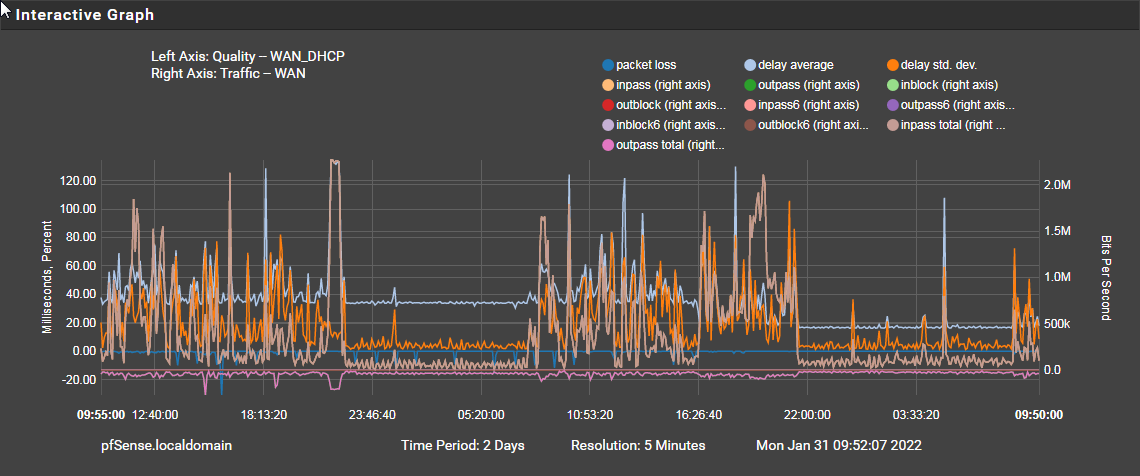
Hmm, well it doesn't look like the packet loss is dircetly correlated with upload from that but it's hard to say fro that graph.
Try de-selecting all but Latency, Packet Loss, Inpass Total and Outpass Total.With that sort of connection (I assume you mean 2.7Mbps down and 0.8Mbps up?) it would be very easy to saturate it and induce latency spikes though DSL is generally better at managing it. YMMV!
Steve
-
@stephenw10 Yes, sorry I should have made that clearer 2.7Mbps down and 0.8 up very slow but I'm ~2.5 miles from the exchange with a poor line with some aluminium wires I've been told. I didn't realise staturating my line speeds would have an effect on pfSense I thought more alone the lines of staurating pfSense which I would think it should be good for a gig or two's bandwidth.
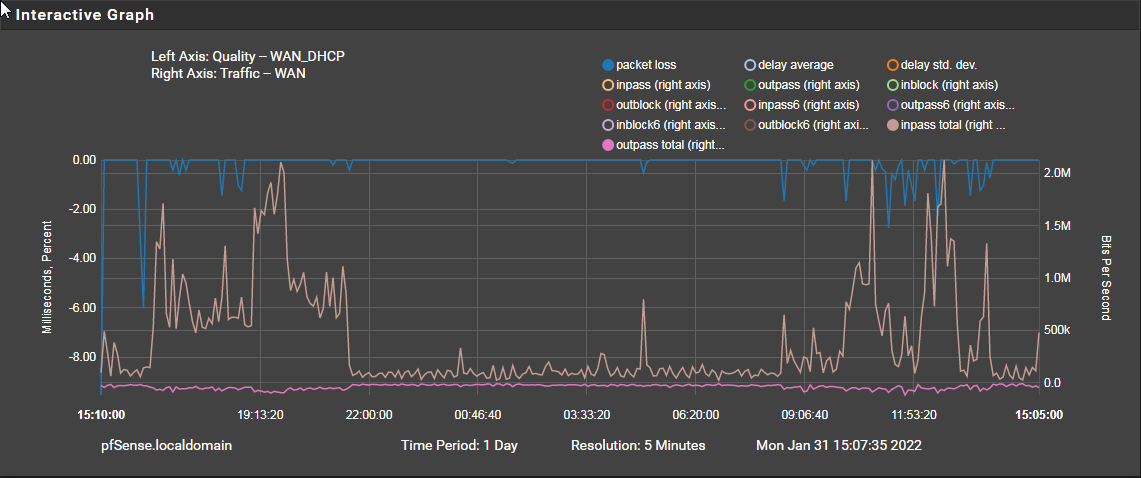
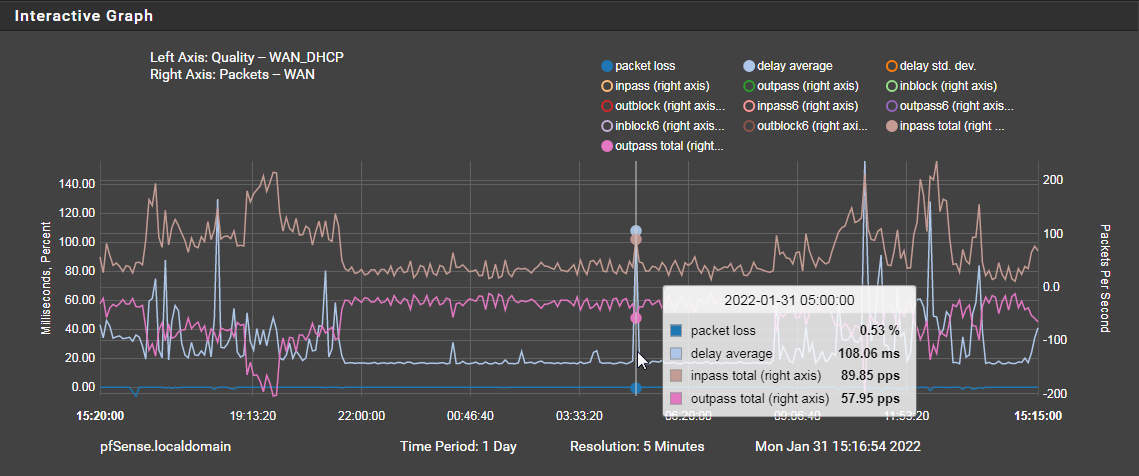
I redraw the graph zoomed in and fewer options selected
-
Mmm, so it does appear to be spiking but with with download peaks. At least on bps terms.
That is the nature of your connection, actual packet loss is pretty ugly though. You should tune your monitoring values to reflect that.
You might want to experiment with fq_codel to mitigate upload saturation:
https://docs.netgate.com/pfsense/en/latest/recipes/codel-limiters.htmlThat doesn't really help much with download though.
Steve
-
@stephenw10
I've added an upload limiter from the guide and results aren't goodhttps://www.waveform.com/tools/bufferbloat?test-id=cd305f29-d16d-4843-9b3c-bef4820eaaf8
Ah, that would explain why with speed tests the upload is not steady with the needle very spiky, and a limiter would limit the upload floow speed so the 'line' could handle it better?
I went from and 'F' to a 'D' result !
Wahey ! when I followed the guide properly... I've gone from a 'F' to an 'A+'
https://www.waveform.com/tools/bufferbloat?test-id=c01f5e80-3629-44bc-b19d-fbac720eb9b4Wow pfSense is such a cool thing.
-
Wow that's awesome! Nice.
-
@stephenw10 Maybe spoke to soon, another test or few now a 'D' or 'F' with nothing changed.
As you mentioned I think it needs a bit of fine tuning especially with the bandwidth settings
-
_ _ToXIc_ referenced this topic on