vnstat makes weird stats on my pppoe0 interface
-
Hello everybody,
I fount an interesting "Bug" on my pfSense 2.5.2:
Running here on a dual-WAN Setup I have igb0 --> Which uses DHCP and gets WAN and then I have PPPoE0 which logically dials in.Since I'm a monitoring freak I setup a grafana board and I'm finally able to export my traffic stats to an influxdb (asked this question on this board aswell, solution will be posted shortly.)
But now here is the funny part: My ISP of my PPPoE disconnects me forcefully every 24h. Therefore I setup my pfsense to forcefully disconnect at 4am every morning. Here is the strange part: vnStat thinks, that when I'm reconnecting I have a traffic of 4 GB:
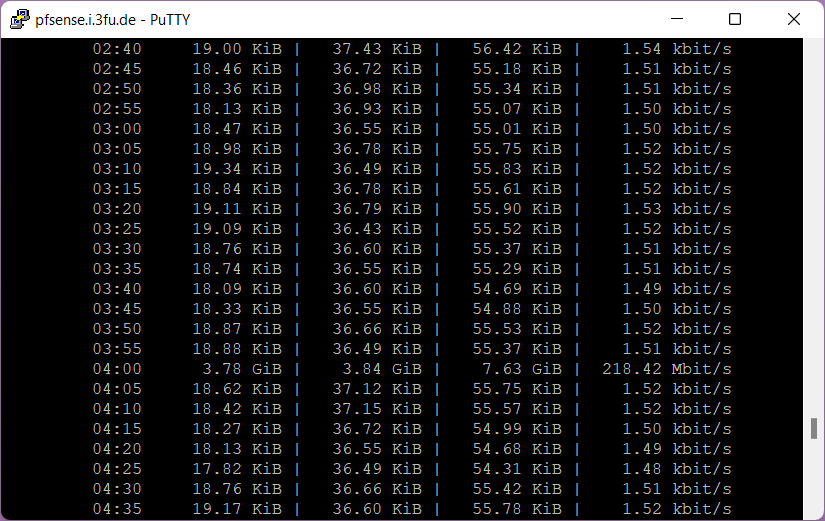
Does anybody has an idea why? I mean, that shouldn't be normal.
Cheers,
Gamie -
Hmm, never seen that. Not something I would ever normally have running though.
Feels like a 32bit integer overrun.... -
I'm debugging it with the vnstat developer too. The only problem I got atm ist: where are the config files? I only find
/usr/local/etc/vnstat.confBut there looks like are not all information needed :/
-
What info are you looking for besides that?
-
See the Github Issue what he needs for information:
Could you list the values for the following options from the configuration file: BandwidthDetection MaxBandwidth MaxBWpppoe0 (or that may also be MaxBWppp0 depending on how the interface is really named) UpdateInterval PollInterval + the information how fast the actual connection for that PPPoE interface is. -
Mmm, those are not specifically defined. That is the correct file though, you can see where the process is started here: /usr/local/etc/rc.d/vnstatd.sh