Memory Usage High in 22.01?
-
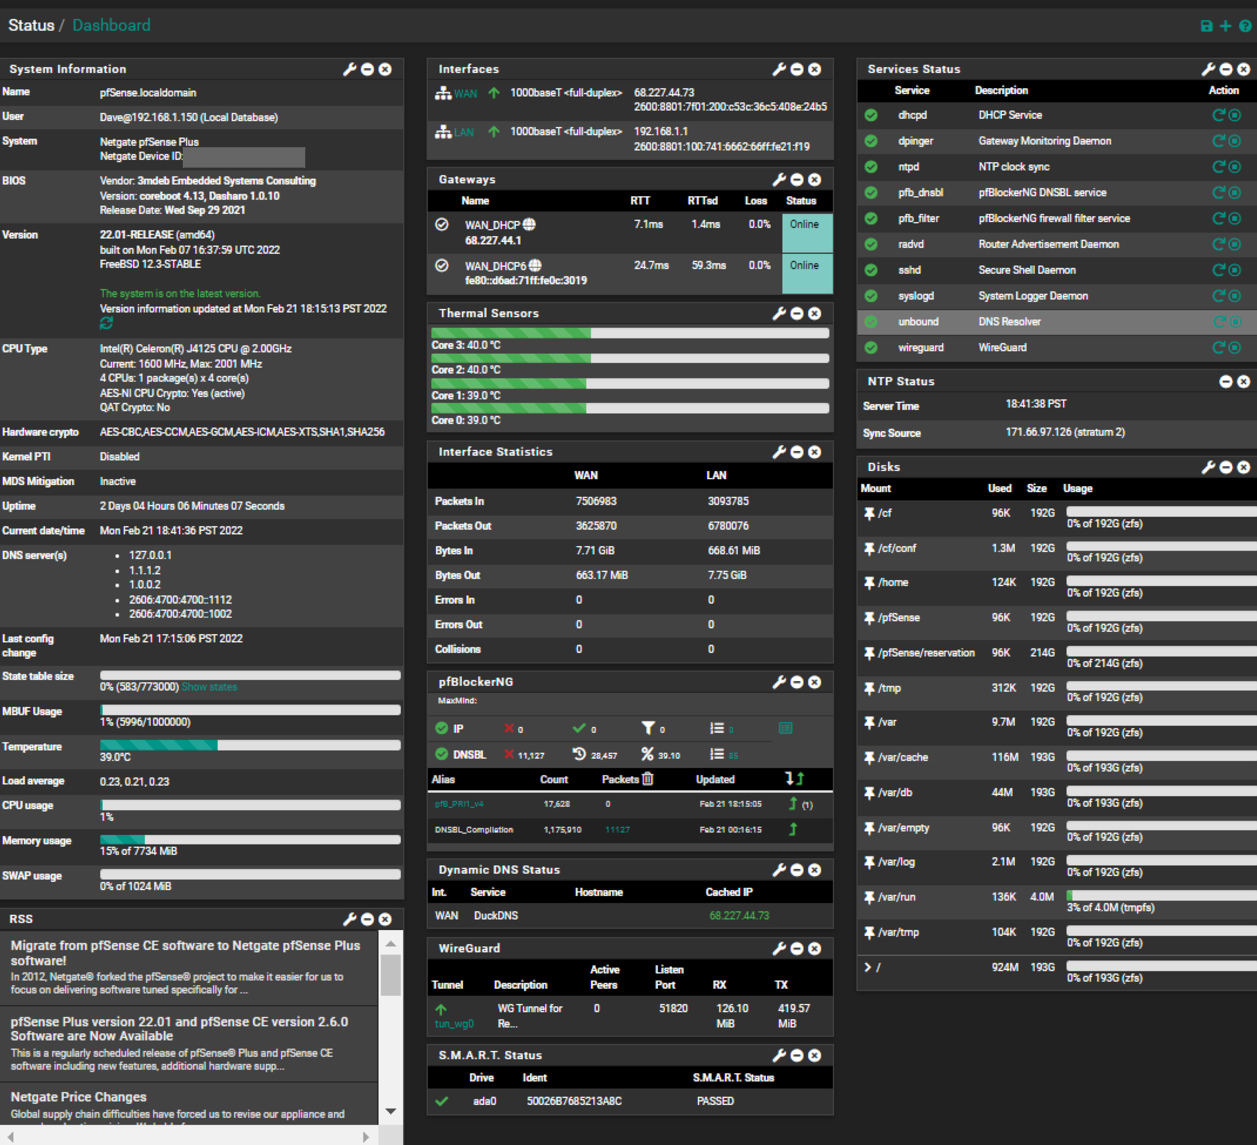
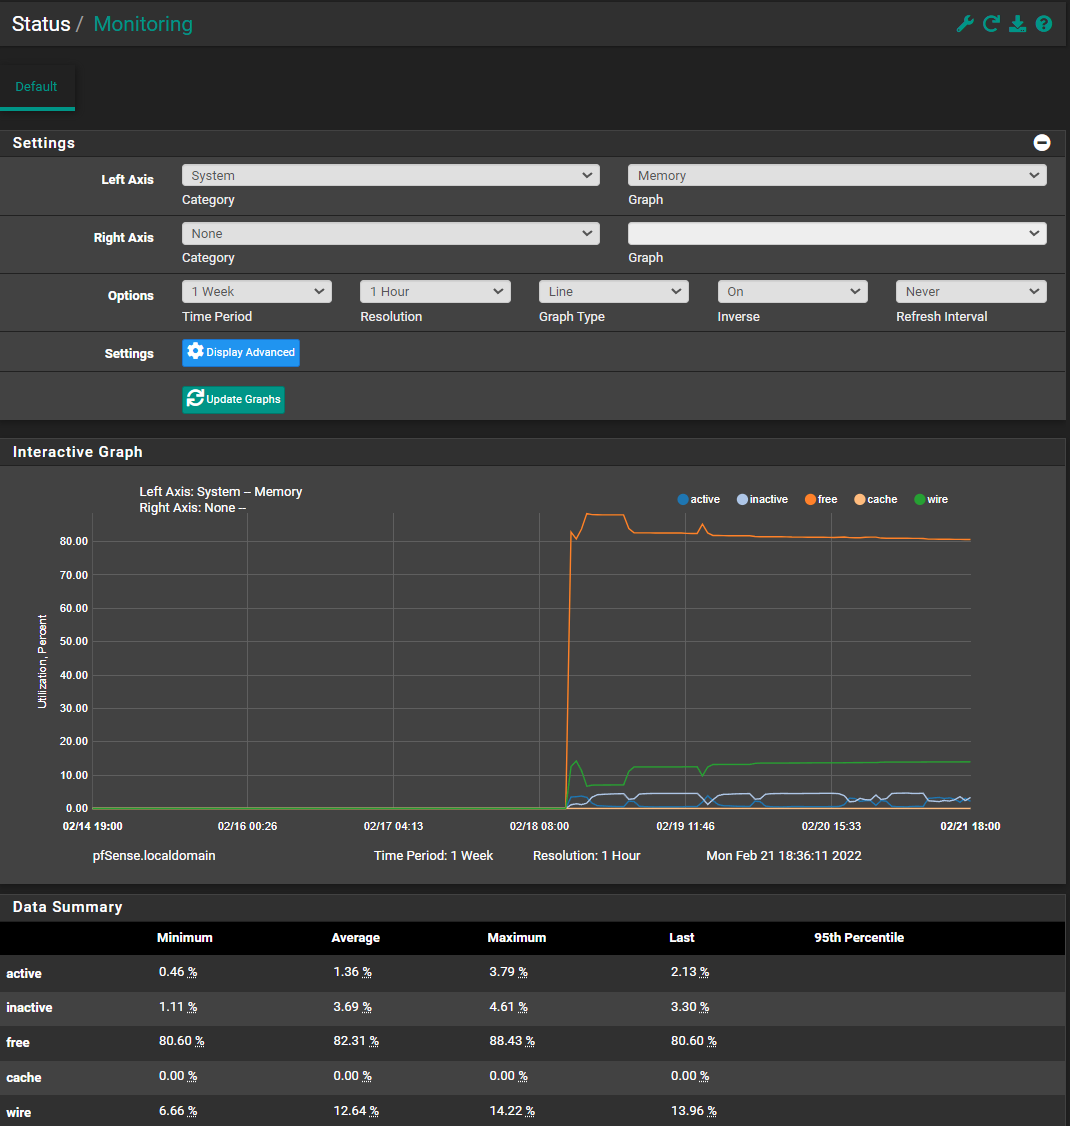
This isn't the end of the world, but since I've updated to 22.01 (fresh install), the memory usage on the dashboard has been bothering me. On this ProtectLi VP2410, I've got 8GB of memory and memory usage has very slowly inched up to about 15%. Again, it's not a huge amount, but that's a bit over 1GB.
If I run top from the command line, I get:
Shell Output - top
last pid: 64516;  load averages:  0.29,  0.37,  0.31  up 2+03:55:50    18:31:19
60 processes:  1 running, 59 sleeping
CPU:  0.2% user,  0.2% nice,  0.4% system,  0.0% interrupt, 99.2% idle
Mem: 87M Active, 318M Inact, 1044M Wired, 6029M Free
ARC: 323M Total, 151M MFU, 165M MRU, 33K Anon, 1271K Header, 5799K Other
     114M Compressed, 346M Uncompressed, 3.03:1 Ratio
Swap: 1024M Total, 1024M Free
And, while I'm at it, why does 22.01 show just 3 of the 4 cores on this device for cpu utilization (see the dashboard and top)? 2.5.2 showed all 4. And, the dashboard shows the temperatures for all four.
EDIT: I'd forget my own head .... I'm running pfBlockerNG-devel and WireGuard. During my upgrade process, I also switched to ZFS.
I'm just a home user with pfSense 23.09-RELEASE (amd64) on a Protecli VP2410
-
@areckethennu said in Memory Usage High in 22.01?:
why does 22.01 show just 3 of the 4 cores on this device for cpu utilization (see the dashboard and top)?
You mean the load average values?
Those are not per core they are averages over 1, 5 and 15mins. It was the same in 2.5.2.Have a look at what's using that RAM. Using Diag > Sysetm Activity or
ps -auxat the command line. Though 15% is hardly concerning really as you say.Steve
-
@stephenw10 Well, my face is red. Yep, I was looking at the load average. I had the totally wrong impression.
ps -aux gives me (sorted by %mem and only showing non-zero values):
 USER PID %CPU %MEM VSZ RSS TT STAT STARTED TIME COMMAND unbound 62448 0 2.5 230812 194184 - Ss 12:16:00 AM 01:20.34 /usr/local/sbin/unbound -c /var/unbound/unbound.conf root 381 0 0.8 136748 63240 - I Sat14 01:49.11 php-fpm: pool nginx (php-fpm) root 382 0 0.8 136572 62784 - I Sat14 01:50.57 php-fpm: pool nginx (php-fpm) root 21177 0 0.8 136680 63044 - S Sun06 01:43.73 php-fpm: pool nginx (php-fpm) root 9525 0 0.5 59288 41452 - I 05:15:00 PM 00:00.13 /usr/local/bin/php_pfb -f /usr/local/pkg/pfblockerng/pfblockerng.inc filterlog root 58820 0 0.5 59540 41680 - Ss 09:05:00 AM 00:24.02 php_wg: WireGuard service (php_wg) root 380 0 0.3 102784 27520 - Ss Sat14 00:04.89 php-fpm: master process (/usr/local/lib/php-fpm.conf) (php-fpm) root 32 0 0.1 0 5120 - DL Sat14 08:14.31 [zpool-pfSense] root 1074 0 0.1 17436 5440 - IC 08:15:00 PM 00:00.00 /usr/local/libexec/sshg-parser root 16918 0 0.1 19788 8136 - Is Sat14 00:00.00 /usr/sbin/sshd root 18580 0 0.1 17764 7852 - S Sun16 04:01.04 /usr/local/sbin/lighttpd_pfb -f /var/unbound/pfb_dnsbl_lighty.conf root 29567 0 0.1 19108 7100 - Ss Sat14 00:12.89 /usr/local/sbin/ntpd -g -c /var/etc/ntpd.conf -p /var/run/ntpd.pid root 30328 0 0.1 28388 7932 - Is Sat14 00:00.00 nginx: master process /usr/local/sbin/nginx -c /var/etc/nginx-webConfigurator.conf (nginx) root 30561 0 0.1 29716 10268 - I Sat14 00:11.10 nginx: worker process (nginx) root 30727 0 0.1 29244 9860 - S Sat14 00:09.47 nginx: worker process (nginx) dhcpd 70931 0 0.1 23400 11852 - Ss 07:42:00 PM 00:03.24 /usr/local/sbin/dhcpd -user dhcpd -group _dhcp -chroot /var/dhcpd -cf /etc/dhcpd.conf -pf /var/run/dhcpd.pid igb1 dhcpd 73106 0 0.1 20444 9100 - Ss 07:42:00 PM 00:02.83 /usr/local/sbin/dhcpd -6 -user dhcpd -group _dhcp -chroot /var/dhcpd -cf /etc/dhcpdv6.conf -pf /var/run/dhcpdv6.pid igb1That only gives me a total of 7.2% memory use, while the dashboard and top claim 15% (it's almost all Wired and looks to add up to about that number).
Here's a similar table for System Activity:
 PID USERNAME PRI NICE SIZE RES STATE C TIME WCPU COMMAND 11 root 155 ki31 0B 64K CPU3 3 66.1H 100.00% [idle{idle: cpu3 ] 11 root 155 ki31 0B 64K CPU1 1 66.0H 100.00% [idle{idle: cpu1 ] 11 root 155 ki31 0B 64K CPU0 0 65.9H 100.00% [idle{idle: cpu0 ] 11 root 155 ki31 0B 64K RUN 2 66.0H 99.85% [idle{idle: cpu2 ] 58820 root 21 0 58M 41M nanslp 3 12:24:00 AM 0.00% php_wg: WireGuard service (php_wg) 30561 root 20 0 29M 10M kqread 0 12:11:00 AM 0.00% nginx: worker process (nginx) 30727 root 20 0 29M 9860K kqread 1 12:10:00 AM 0.00% nginx: worker process (nginx) 30328 root 31 0 28M 7932K pause 0 12:00:00 AM 0.00% nginx: master process /usr/local/sbin/nginx -c /var/etc/nginx-webConfigurator.conf (nginx) 70931 dhcpd 20 0 23M 12M select 2 12:03:00 AM 0.00% /usr/local/sbin/dhcpd -user dhcpd -group _dhcp -chroot /var/dhcpd -cf /etc/dhcpd.conf -pf /var/run/dhcpd.pid igb1 62448 unbound 20 0 225M 190M kqread 3 12:31:00 AM 0.00% /usr/local/sbin/unbound -c /var/unbound/unbound.conf{unbound 62448 unbound 20 0 225M 190M kqread 2 12:24:00 AM 0.00% /usr/local/sbin/unbound -c /var/unbound/unbound.conf{unbound 62448 unbound 20 0 225M 190M kqread 2 12:16:00 AM 0.00% /usr/local/sbin/unbound -c /var/unbound/unbound.conf{unbound 62448 unbound 20 0 225M 190M kqread 3 12:11:00 AM 0.00% /usr/local/sbin/unbound -c /var/unbound/unbound.conf{unbound 73106 dhcpd 20 0 20M 9100K select 3 12:03:00 AM 0.00% /usr/local/sbin/dhcpd -6 -user dhcpd -group _dhcp -chroot /var/dhcpd -cf /etc/dhcpdv6.conf -pf /var/run/dhcpdv6.pid igb1 29567 root 20 0 19M 7100K select 1 12:13:00 AM 0.00% /usr/local/sbin/ntpd -g -c /var/etc/ntpd.conf -p /var/run/ntpd.pid{ntpd 16918 root 20 0 19M 8136K select 0 12:00:00 AM 0.00% /usr/sbin/sshd 18580 root 20 0 17M 7852K kqread 3 04:02:00 AM 0.00% /usr/local/sbin/lighttpd_pfb -f /var/unbound/pfb_dnsbl_lighty.conf 11663 root 23 0 13M 3808K CPU2 2 12:00:00 AM 0.00% /usr/bin/top -baHS 999 21177 root 22 0 133M 62M piperd 0 01:44:00 AM 0.20% php-fpm: pool nginx (php-fpm){php-fpm 12639 root 52 20 12M 3116K wait 0 12:16:00 AM 0.00% /bin/sh /var/db/rrd/updaterrd.sh 27230 root 20 0 12M 3008K bpf 2 12:03:00 AM 0.00% /usr/local/sbin/filterlog -i pflog0 -p /var/run/filterlog.pid 57455 root 48 0 12M 2996K wait 1 12:00:00 AM 0.00% -sh (sh) 57499 root 52 0 12M 3024K wait 2 12:00:00 AM 0.00% -sh (sh) 66867 root 20 0 11M 2208K select 0 12:30:00 AM 0.00% /usr/sbin/powerd -b hadp -a hadp -n hadp 57569 root 20 0 11M 2396K select 2 12:11:00 AM 0.00% /usr/local/sbin/radvd -p /var/run/radvd.pid -C /var/etc/radvd.conf -m syslog 28710 root 23 0 11M 2528K nanslp 1 12:03:00 AM 0.00% /usr/sbin/cron -s 22792 _dhcp 20 0 11M 2652K select 3 12:02:00 AM 0.00% dhclient: igb0 (dhclient) 39698 root 20 0 11M 2444K select 1 12:00:00 AM 0.00% /usr/local/sbin/dhcp6c -d -c /var/etc/dhcp6c_wan.conf -p /var/run/dhcp6c_igb0.pid igb0 19612 root 4 0 11M 2540K select 1 12:00:00 AM 0.00% dhclient: igb0 [priv] (dhclient) 55338 root 52 0 11M 2728K wait 2 12:00:00 AM 0.00% login [pam] (login) 56975 root 52 0 11M 2728K wait 3 12:00:00 AM 0.00% login [pam] (login) 89641 root 52 0 11M 2900K ttyin 1 12:00:00 AM 0.00% /bin/sh /etc/rc.initial 59186 root 52 0 11M 2900K ttyin 0 12:00:00 AM 0.00% /bin/sh /etc/rc.initial 55697 root 52 0 11M 2236K ttyin 0 12:00:00 AM 0.00% /usr/libexec/getty Pc ttyv2 55512 root 52 0 11M 2236K ttyin 3 12:00:00 AM 0.00% /usr/libexec/getty Pc ttyv1 56214 root 52 0 11M 2236K ttyin 2 12:00:00 AM 0.00% /usr/libexec/getty Pc ttyv4 56559 root 52 0 11M 2236K ttyin 0 12:00:00 AM 0.00% /usr/libexec/getty Pc ttyv6 55951 root 52 0 11M 2236K ttyin 3 12:00:00 AM 0.00% /usr/libexec/getty Pc ttyv3 56267 root 52 0 11M 2236K ttyin 2 12:00:00 AM 0.00% /usr/libexec/getty Pc ttyv5 56879 root 52 0 11M 2236K ttyin 1 12:00:00 AM 0.00% /usr/libexec/getty Pc ttyv7 73385 root 29 0 10M 2072K kqread 2 12:00:00 AM 0.00% /usr/local/sbin/dhcpleases6 -c /usr/local/bin/php-cgi -f /usr/local/sbin/prefixes.php -l /var/dhcpd/var/db/dhcpd6.leases 29 root 16 - 0B 16K syncer 1 12:03:00 AM 0.00% [syncer]But, beats me how to read that.
Again, nothing looks bad here. It just seems like a higher number than I remember. I'll keep an eye out to see if the memory utilization keeps creeping up and reaches something unreasonable.
-
@areckethennu Well, the last sentence should read ... NOTHING looks bad.... But, when I try to edit it, I get a popup that some service (Akimet?) thinks it's spam.
-
Fixed it.

Yeah, nothing looks unusually high there. Unbound always uses quite a bit.
Steve
-
@areckethennu said in Memory Usage High in 22.01?:
I also switched to ZFS.
That alone will cause the system to use more RAM than it would with UFS.