pfsense 2.6.0 sshguard @ web gui bug/crash
-
Ah, OK so something you have on your dashboard is taking an age to timeout before even rendering.
We can't see what widgets you have showing there but can I assume it's the disks widget causing it? If you remove it then the dash displays in the expected time?
And does that only happen with user 'Jack'? If you login as admin do you still see the delay?Steve
-
@stephenw10 Hi, it happens on both users, admin and jack, Widgets i have on the home page I have also removed them then tested again but issue is still there, disabling ssh does not fix the problem, but there is loads of php-fpm in the logs.
Picture,
System Information,
Interfaces,
Services Status,
Installed Packages,
NTP Status,
pfBlockerNG,
Gateways,
UPS Status,
Firewall Logs,
Interface Statistics,
Thermal Sensors,
SMART Status,
Haproxy,
Snort Alerts,
Traffic Graphs.I have notice a something though, when this happens it's always from 12am to 5:30am when this happens. But i can trigger it though, false logins via SSH. But there's nothing in the logs about Brute Force attacks but there is something triggering it though because sshguard is being triggered and logs are full of sshguard every few minutes, disabling ssh in general does not fix the problem neither so it is either maybe a bug? or maybe someones inside the network.
Saying the time when this happens, I have noticed it's being triggered again but the Web Gui is still working, the logs are full of,
Apr 20 15:59:00 sshguard 84660 Now monitoring attacks. Apr 20 15:59:00 sshguard 11578 Exiting on signal. Apr 20 16:33:00 sshguard 85149 Now monitoring attacks. Apr 20 16:33:00 sshguard 84660 Exiting on signal. Apr 20 17:12:00 sshguard 57530 Now monitoring attacks. Apr 20 17:12:00 sshguard 85149 Exiting on signal. Apr 20 17:51:00 sshguard 26088 Now monitoring attacks. Apr 20 17:51:00 sshguard 57530 Exiting on signal. Apr 20 17:54:00 sshguard 34895 Now monitoring attacks. Apr 20 17:54:00 sshguard 26088 Exiting on signal. -
When you see this happen though the symptoms are that the dashboard takes a very long time to load but does eventually load. Other pages in the webgui load as expected?
Hitting the system with bad logins triggers sshguard but that prevents you accessing the firewall entirely for length of the block.
The sshguard entries you see in in the system log are the service restarting because your logs are rotating. Nothing is being blocked there.
This is unrelated to sshguard as far as I can see. It just produces similar symptoms.
Did you see which log is rotating at 3min intervals? What's in it?
Something is causing both a lot of logging and one of the dashboard widgets to load very slowly.
Some of those widgets include logs so that could be related. Or they could both be symptoms of something else.What made you think this was the disks widget at one time?
Steve
-
@stephenw10 Other tabs work except for the home page even removing the widget don't fix it, reason why i though it could of been the disk widget is that's when it stopped acting up when i removed it from the homepage,
I just find it weird how it happens only in the early hours of the night i noticed it because that's when i do my maintenance, upgrades etc on a weekend as it's not just me that uses the network.
I did some packet tracing not long ago but have not found anything unusual on the Network but i will run another tonight early hours of the morning and keep it running too see if i find anything obscure happening.
As for the logs rotating I just find it strange all the years I have been running pfSense I have not seen this activity until now which is why I think that there could be someone lurking in the network I might just be paranoid but it's always good to know what is going on with a network that is publicly exposed. As for the logs I have not checked which would you recommend to go with?
Not mentioned this but the zpool was not updated so i did that last night so ZFS is now running the latest update but I have noticed a ton of ZFS Write Errors in the System log but zpool status does not show any problems.
Thanks.
Jack.
-
You only see those sshguard logs since 2.6 because the logging was changed from circular logs to the standard FreeBSD logs. In previous versions the syslog service never restarted so sshguard did not.
-
@stephenw10 I see, could the Gui be kinda broken after upgrades ? Because this is a old install from 2.4 maybe that could be causing the problem ? It is strange though right?
-
I can't imagine anything that would have come over from the old config that would cause this.
The fact it only happens some of the time implies something external that's changing. It's going to be something that's trying to parse some huge file for some reason. Probably some log file given the sshguard logs.
I think you checked the Monitoring graphs for the incoming blocked traffic? That's what I expect to be the most likely cause.Steve
-
@violetdragon said in pfsense 2.6.0 sshguard @ web gui bug/crash:
Heres the output of,
( see above your /var/log/* files )
@violetdragon said in pfsense 2.6.0 sshguard @ web gui bug/crash:
21 -rw------- 1 root wheel 129542 Apr 14 16:07 system.log
41 -rw------- 1 root wheel 40644 Apr 14 01:49 system.log.0.bz2
33 -rw------- 1 root wheel 30645 Apr 11 20:35 system.log.1.bz2
33 -rw------- 1 root wheel 30312 Apr 9 07:00 system.log.2.bz2
41 -rw------- 1 root wheel 37309 Apr 6 22:58 system.log.3.bz2So, in less then one day, 15 hours, your system.log grows from nothing (it was rotated) to 130 Kbytes.
Mine is 10 Kbytes and it was created (rotated last February) !All you logs file are "big", you could set up, if you have the space for it, log files that are 10 times bigger;
There will be less rotation == syslog restating.
But keep in mind that the GUI - and other process, like sshguard, process (track) and read log files. Big files means more processing time.
PHP is nice for building web pages, but having it go through 'huge' files just to put a line with info on a screen wasn't its goal, and its not good at doing so. It becomes slow.Btw : this is me just thinking out loud.
I have just a small company behind my pfSense.
And a captive portal where hotel visitors use our Internet connection.Most of the sub folders like nginx, nut ntp are empty.
/pfblockerng/ has some files, nothing huge.Did you look into /snort/ ? This one, I don't like, as it can be set up to kill a system really fast, by 'eating' all disk and cpu resources.
No "help me" PM's please. Use the forum, the community will thank you.
Edit : and where are the logs ?? -
I had originally thought that sshguard reads the log files, and it can be setup to do that, but in pfSense it doesn't. Instead the syslog daemon pipes all authentication log entries to it directly.
But that still means sshguard is restarted whenever syslog does and that happens whenever any log rotates.Steve
-
@stephenw10 I am wondering if it could be pfBlockerNG as i have Geoblocking enabled for Country Blocking, now the logs for that is constantly updating just like with Snort but if that was pegging the system down why isn't the CPU or RAM pegged, it is strange.
-
@gertjan Here's what the snort and pfblockerng log files show,
drwxr-xr-x   3 root  wheel       5 Feb 17  2021 .
drwxr-xr-x  10 root  wheel     101 Apr 21 14:30 ..
-rw-rw----   1 root  wheel       0 Apr 21 00:10 WAN_disabled_preproc_rules.log
drw-rw----   3 root  wheel      32 Apr 21 00:15 snort_pppoe042749
-rw-rw----   1 root  wheel  686309 Apr 21 00:10 snort_rules_update.log
-rw------- 1 unbound unbound 0 Apr 21 14:06 dns_reply.log -rw------- 1 unbound unbound 2878942 Apr 21 14:32 dnsbl.log -rw------- 1 root wheel 1679749 Apr 21 14:06 dnsbl_parsed_error.log -rw------- 1 root wheel 606415 Apr 21 14:06 error.log -rw------- 1 root wheel 11867 Apr 21 14:06 extras.log -rw------- 1 root wheel 3295190 Apr 21 14:48 ip_block.log -rw------- 1 root wheel 27482 Apr 21 14:06 ip_permit.log -rw-r--r-- 1 root wheel 120 Apr 7 23:00 maxmind_ver -rw------- 1 root wheel 742001 Apr 21 14:06 pfblockerng.log -rw------- 1 unbound unbound 3353660 Apr 21 14:48 unified.log -
It could be one of the widgets having to wait to access the logs, or some other file. If pfBlocker got stuck in a loop continually updating for example it probably locks some files during that process and that could cause loading issues.
-
@stephenw10 I did try removing the pfblockerng widget and still had that problem weird that it started in 2.6.0 though. Maybe a fresh install would help?
-
It might but there's nothing to really indicate filesystem issue.
What widgets did you actually try removing? All of them?
-
@stephenw10 all of them, I also tried rebooting but still the same happens. I have noticed some zfs write warnings though in the system logs but not sure if it's related.
-
Well if it really was unable to read a file for some reason that might do it.
With no widgets at all the dashboard was still slow to open? And only the dashboard?
If you're able to reinstall easily then you may as well try that.
Steve
-
@stephenw10 Yeah it's slow with no Widgets but the weird thing is it always does it from 12am to around 5:30am in the day it is fine, maybe theres a Cron job causing it. I can do a fresh install but that is going to be a lot of work due to pfblockerng and Snort and the certs with Acme.
-
You can restore your existing config at least as a first test. You are only testing of it's a filesystem issue.
Do you have any scheduled firewall rules that might be preventing pfSense itself connecting out at that time?
If you have literally no widgets on the dash that shouldn't really matter though.Steve
-
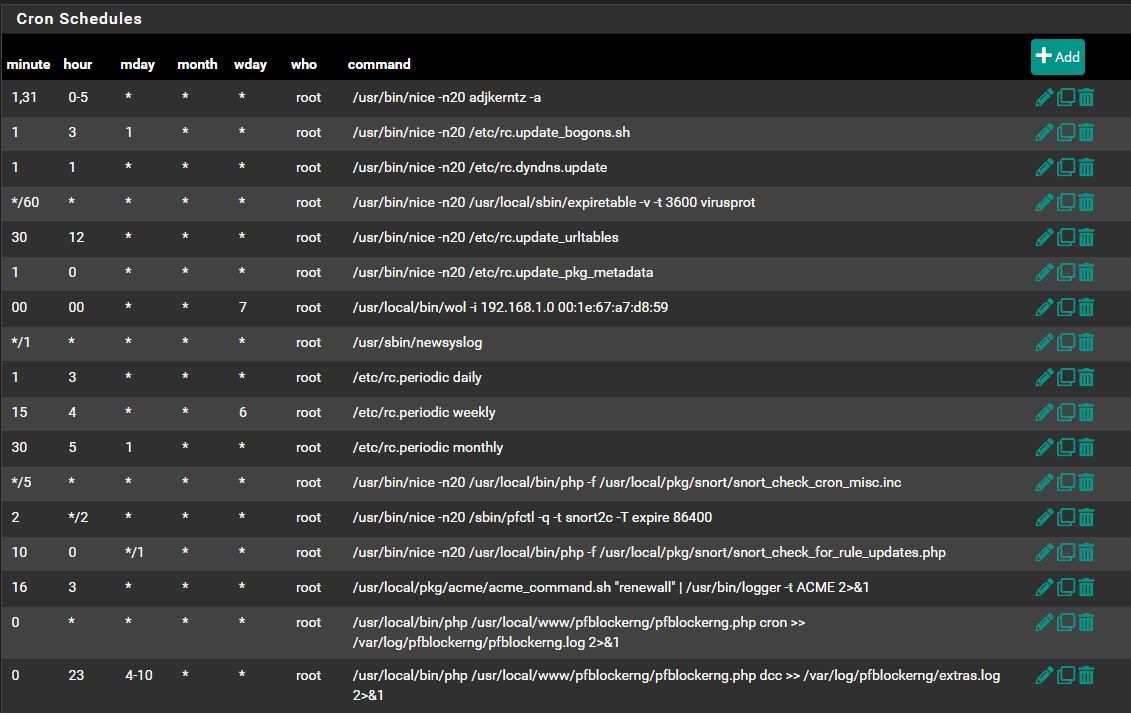
@stephenw10 Nope no scheduled Firewall rules, Here is what i have for cron jobs though,
-
@stephenw10 But the log is full of this not sure if it is related though,
   32 root        -12    -     0B  5120K -        0   0:43   0.00% [zpool-zroot{zio_write_issue_0}]
   32 root        -12    -     0B  5120K -        2   0:43   0.00% [zpool-zroot{zio_write_issue_1}]
   32 root        -12    -     0B  5120K -        1   0:43   0.00% [zpool-zroot{zio_write_issue_2}]
32 root -16 - 0B 5120K - 3 0:02 0.00% [zpool-zroot{zio_write_intr_2_10}] 32 root -16 - 0B 5120K - 0 0:02 0.00% [zpool-zroot{zio_write_intr_1_8}] 32 root -16 - 0B 5120K - 2 0:02 0.00% [zpool-zroot{zio_write_intr_0_7}] 32 root -16 - 0B 5120K - 3 0:02 0.00% [zpool-zroot{zio_write_intr_7_7}] 32 root -16 - 0B 5120K - 1 0:02 0.00% [zpool-zroot{zio_write_intr_4_0}] 32 root -16 - 0B 5120K - 3 0:02 0.00% [zpool-zroot{zio_write_intr_0_2}] 32 root -16 - 0B 5120K - 2 0:02 0.00% [zpool-zroot{zio_write_intr_6_8}] 32 root -16 - 0B 5120K - 1 0:02 0.00% [zpool-zroot{zio_write_intr_4_4}] 32 root -16 - 0B 5120K - 2 0:02 0.00% [zpool-zroot{zio_write_intr_7_9}] 32 root -16 - 0B 5120K - 0 0:02 0.00% [zpool-zroot{zio_write_intr_4_2}] 32 root -16 - 0B 5120K - 3 0:02 0.00% [zpool-zroot{zio_write_intr_1_6}] 32 root -16 - 0B 5120K - 2 0:01 0.00% [zpool-zroot{zio_write_intr_2_5}] 32 root -16 - 0B 5120K - 3 0:01 0.00% [zpool-zroot{zio_write_intr_6_2}] 32 root -16 - 0B 5120K - 1 0:01 0.00% [zpool-zroot{zio_write_intr_5_3}] 32 root -16 - 0B 5120K - 3 0:01 0.00% [zpool-zroot{zio_write_intr_0_5}] 32 root -16 - 0B 5120K - 1 0:01 0.00% [zpool-zroot{zio_write_intr_1_5}] 32 root -16 - 0B 5120K - 1 0:01 0.00% [zpool-zroot{zio_write_intr_6_7}] 32 root -16 - 0B 5120K - 0 0:01 0.00% [zpool-zroot{zio_write_intr_2_7}] 32 root -16 - 0B 5120K - 3 0:01 0.00% [zpool-zroot{zio_write_intr_6_5}] 32 root -16 - 0B 5120K - 0 0:01 0.00% [zpool-zroot{zio_write_intr_1_10}] 32 root -16 - 0B 5120K - 3 0:01 0.00% [zpool-zroot{zio_write_intr_5_8}] 32 root -16 - 0B 5120K - 1 0:01 0.00% [zpool-zroot{zio_write_intr_3_10}] 32 root -16 - 0B 5120K - 0 0:01 0.00% [zpool-zroot{zio_write_intr_3_6}] 32 root -16 - 0B 5120K - 1 0:01 0.00% [zpool-zroot{zio_write_intr_0_8}] 32 root -16 - 0B 5120K - 2 0:01 0.00% [zpool-zroot{zio_write_intr_1_1}] 32 root -16 - 0B 5120K - 2 0:01 0.00% [zpool-zroot{zio_write_intr_2_8}] 32 root -16 - 0B 5120K - 1 0:01 0.00% [zpool-zroot{zio_write_intr_7_11}] 32 root -16 - 0B 5120K - 3 0:01 0.00% [zpool-zroot{zio_write_intr_1_0}] 32 root -16 - 0B 5120K - 0 0:01 0.00% [zpool-zroot{zio_write_intr_4_8}] 32 root -16 - 0B 5120K - 3 0:01 0.00% [zpool-zroot{zio_write_intr_6_4}] 32 root -16 - 0B 5120K - 2 0:01 0.00% [zpool-zroot{zio_write_intr_6_11}] 32 root -16 - 0B 5120K - 3 0:01 0.00% [zpool-zroot{zio_write_intr_5_6}] 32 root -16 - 0B 5120K - 0 0:01 0.00% [zpool-zroot{zio_write_intr_3_3}] 32 root -16 - 0B 5120K - 2 0:01 0.00% [zpool-zroot{zio_write_intr_7_8}] 32 root -16 - 0B 5120K - 0 0:01 0.00% [zpool-zroot{zio_write_intr_1_2}] 32 root -16 - 0B 5120K - 2 0:01 0.00% [zpool-zroot{zio_write_intr_5_5}] 32 root -16 - 0B 5120K - 1 0:01 0.00% [zpool-zroot{zio_write_intr_5_9}] 32 root -16 - 0B 5120K - 0 0:01 0.00% [zpool-zroot{zio_write_intr_3_11}] 32 root -16 - 0B 5120K - 1 0:01 0.00% [zpool-zroot{zio_write_intr_3_2}] 16 root -76 - 0B 160K - 3 0:01 0.00% [usb{usbus1}] 32 root -16 - 0B 5120K - 3 0:01 0.00% [zpool-zroot{zio_write_intr_7_5}] 32 root -16 - 0B 5120K - 1 0:01 0.00% [zpool-zroot{zio_write_intr_3_4}] 32 root -16 - 0B 5120K - 3 0:01 0.00% [zpool-zroot{zio_write_intr_2_6}] 32 root -16 - 0B 5120K - 1 0:01 0.00% [zpool-zroot{zio_write_intr_7_3}] 32 root -16 - 0B 5120K - 1 0:01 0.00% [zpool-zroot{zio_write_intr_6_1}] 32 root -16 - 0B 5120K - 3 0:01 0.00% [zpool-zroot{zio_write_intr_6_0}] 32 root -16 - 0B 5120K - 0 0:01 0.00% [zpool-zroot{zio_write_intr_0_10}] 32 root -16 - 0B 5120K - 2 0:01 0.00% [zpool-zroot{zio_write_intr_0_6}] 32 root -16 - 0B 5120K - 2 0:01 0.00% [zpool-zroot{zio_write_intr_2_2}] 32 root -16 - 0B 5120K - 3 0:01 0.00% [zpool-zroot{zio_write_intr_2_4}] 32 root -16 - 0B 5120K - 2 0:01 0.00% [zpool-zroot{zio_write_intr_6_6}] 32 root -16 - 0B 5120K - 2 0:01 0.00% [zpool-zroot{zio_write_intr_2_0}] 32 root -16 - 0B 5120K - 1 0:01 0.00% [zpool-zroot{zio_write_intr_4_9}] 32 root -16 - 0B 5120K - 0 0:01 0.00% [zpool-zroot{zio_write_intr_3_9}] 32 root -16 - 0B 5120K - 3 0:01 0.00% [zpool-zroot{zio_write_intr_5_4}] 32 root -16 - 0B 5120K - 3 0:01 0.00% [zpool-zroot{zio_write_intr_0_1}] 32 root -16 - 0B 5120K - 2 0:01 0.00% [zpool-zroot{zio_write_intr_7_4}] 32 root -16 - 0B 5120K - 1 0:01 0.00% [zpool-zroot{zio_write_intr_5_0}] 32 root -16 - 0B 5120K - 3 0:01 0.00% [zpool-zroot{zio_write_intr_2_9}] 32 root -16 - 0B 5120K - 1 0:01 0.00% [zpool-zroot{zio_write_intr_4_10}] 32 root -16 - 0B 5120K - 0 0:01 0.00% [zpool-zroot{zio_write_intr_2_3}] 32 root -16 - 0B 5120K - 2 0:01 0.00% [zpool-zroot{zio_write_intr_4_7}] 32 root -16 - 0B 5120K - 2 0:01 0.00% [zpool-zroot{zio_write_intr_1_11}] 32 root -16 - 0B 5120K - 2 0:01 0.00% [zpool-zroot{zio_write_intr_3_7}] 32 root -16 - 0B 5120K - 2 0:01 0.00% [zpool-zroot{zio_write_intr_4_11}] 32 root -16 - 0B 5120K - 3 0:01 0.00% [zpool-zroot{zio_write_intr_3_0}] 32 root -16 - 0B 5120K - 0 0:01 0.00% [zpool-zroot{zio_write_intr_0_3}] 32 root -16 - 0B 5120K - 1 0:01 0.00% [zpool-zroot{zio_write_intr_7_2}] 32 root -16 - 0B 5120K - 1 0:01 0.00% [zpool-zroot{zio_write_intr_7_6}] 32 root -16 - 0B 5120K - 0 0:01 0.00% [zpool-zroot{zio_write_intr_5_7}] 32 root -16 - 0B 5120K - 1 0:01 0.00% [zpool-zroot{zio_write_intr_1_9}] 32 root -16 - 0B 5120K - 0 0:01 0.00% [zpool-zroot{zio_write_intr_0_9}] 32 root -16 - 0B 5120K - 0 0:01 0.00% [zpool-zroot{zio_write_intr_0_4}] 32 root -16 - 0B 5120K - 0 0:01 0.00% [zpool-zroot{zio_write_intr_5_1}] 32 root -16 - 0B 5120K - 0 0:01 0.00% [zpool-zroot{zio_write_intr_6_10}] 32 root -16 - 0B 5120K - 3 0:01 0.00% [zpool-zroot{zio_write_intr_4_6}] 32 root -16 - 0B 5120K - 1 0:01 0.00% [zpool-zroot{zio_write_intr_5_11}] 32 root -16 - 0B 5120K - 3 0:01 0.00% [zpool-zroot{zio_write_intr_7_1}] 32 root -16 - 0B 5120K - 1 0:01 0.00% [zpool-zroot{zio_write_intr_0_11}] 12 root -60 - 0B 304K WAIT 3 0:01 0.00% [intr{swi4: clock (1)}] 32 root -16 - 0B 5120K - 2 0:01 0.00% [zpool-zroot{zio_write_intr_1_4}] 32 root -16 - 0B 5120K - 2 0:01 0.00% [zpool-zroot{zio_write_intr_3_1}] 12 root -88 - 0B 304K WAIT 2 0:01 0.00% [intr{irq16: ehci0}] 32 root -16 - 0B 5120K - 0 0:01 0.00% [zpool-zroot{zio_write_intr_0_0}]