e6000sw tick kproc
-
What is [e6000sw tick kproc] and why is it taking up 5-6%?
This is occurring on both HA's Netgate 7100 running 22.01-RELEASE. I didn;t notice this process before.
PID USERNAME PRI NICE SIZE RES STATE C TIME WCPU COMMAND 8 root -16 - 0B 16K e6000s 2 7:05 5.47% [e6000sw tick kproc] -
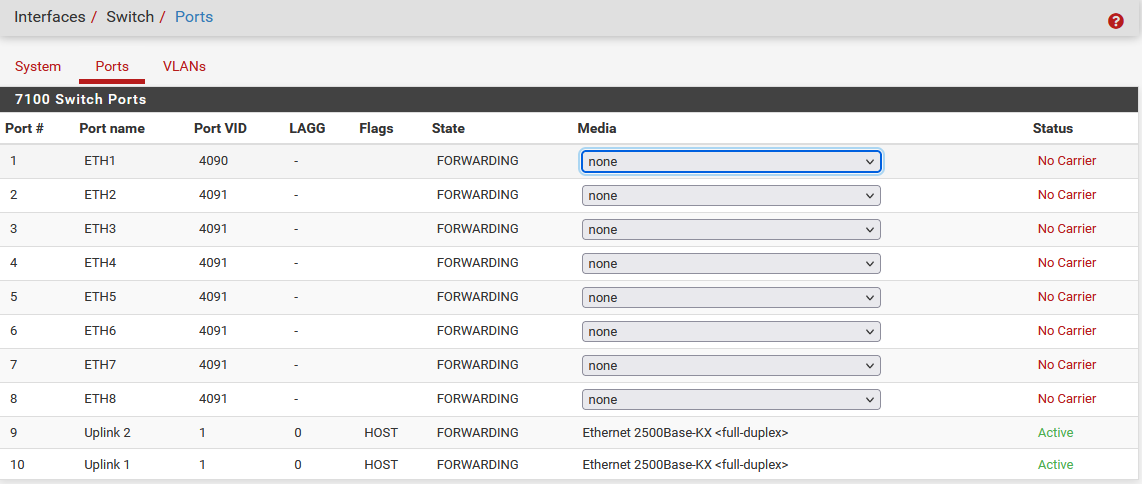
It's the process that monitors the switch (Marvel e6000 series). It's expected on the 7100.
Steve
-
@stephenw10 Is it expected to be that high (granted so low, too) when none of those 8 ports are being used? Does it still monitor with the the two 10g ports and/or the PCI 4-port NIC are used instead?
-
Yes, ~5% is typical usage:
[22.01-RELEASE][admin@7100.stevew.lan]/root: top -aSH
last pid: 66887;  load averages:  0.16,  0.16,  0.08                                                                                                                                  up 0+00:03:03  12:54:54
579 threads:   5 running, 547 sleeping, 27 waiting
CPU:  0.0% user,  0.0% nice,  1.8% system,  0.0% interrupt, 98.2% idle
Mem: 99M Active, 62M Inact, 398M Wired, 7302M Free
ARC: 175M Total, 30M MFU, 142M MRU, 32K Anon, 597K Header, 2248K Other
     48M Compressed, 125M Uncompressed, 2.61:1 Ratio
Swap: 1024M Total, 1024M Free

  PID USERNAME    PRI NICE   SIZE    RES STATE    C   TIME    WCPU COMMAND
   11 root        155 ki31     0B    64K CPU0     0   2:53  99.77% [idle{idle: cpu0}]
   11 root        155 ki31     0B    64K CPU2     2   2:54  99.73% [idle{idle: cpu2}]
   11 root        155 ki31     0B    64K CPU3     3   3:00  98.26% [idle{idle: cpu3}]
   11 root        155 ki31     0B    64K RUN      1   3:04  93.52% [idle{idle: cpu1}]
    8 root        -16    -     0B    16K e6000s   1   0:11   6.37% [e6000sw tick kproc]
65687 root         20    0    14M  4668K CPU1     1   0:00   0.16% top -aSH
The process polls the switch IC for the port status once a second. It does so using the MDIO bus via ix2 but that process is slow in the ix driver so it ends up using significant CPU time.
The same process in the 2100 or 3100 is faster via the mvneta driver so it appears to use less CPU time there.Steve