• Categories
  • Recent
  • Tags
  • Popular
  • Users
  • Search
  • Register
  • Login
Netgate Discussion Forum
  • Categories
  • Recent
  • Tags
  • Popular
  • Users
  • Search
  • Register
  • Login

Continuously increasing memory usage since the update to 2.6

Scheduled Pinned Locked Moved General pfSense Questions
42 Posts 9 Posters 12.3k Views 9 Watching
Loading More Posts
  • Oldest to Newest
  • Newest to Oldest
  • Most Votes
Reply
  • Reply as topic
Log in to reply
This topic has been deleted. Only users with topic management privileges can see it.
  • T Offline
    Techniker_ctr @stephenw10
    last edited by Apr 22, 2022, 3:54 PM

    @stephenw10

    Thats a good question. I will see if i can find the answer, why the telegraf need more on one system than on the others.

    To your question:
    We have not yet run any of our productive 2.6 pfSensen so long without reboot that the memory would be completely used up. However, I have deployed a few test systems, one of which is at about 93% after 31 days. I will run these until I can determine a failure.

    I have to play it safe with the others.

    S 1 Reply Last reply Apr 22, 2022, 4:47 PM Reply Quote 0
    • S Offline
      stephenw10 Netgate Administrator @Techniker_ctr
      last edited by Apr 22, 2022, 4:47 PM

      @techniker_ctr said in Continuously increasing memory usage since the update to 2.6:

      I will run these until I can determine a failure.

      It may well not fail, just start freeing unused memory when it gets close.
      It would be interesting to see.

      Steve

      1 Reply Last reply Reply Quote 1
      • B Offline
        bingo600
        last edited by bingo600 Apr 22, 2022, 4:56 PM Apr 22, 2022, 4:55 PM

        I think i can see (On pfSense+)

        A continuous slow growth too , i have 8GB Ram , and am now on 36% used.
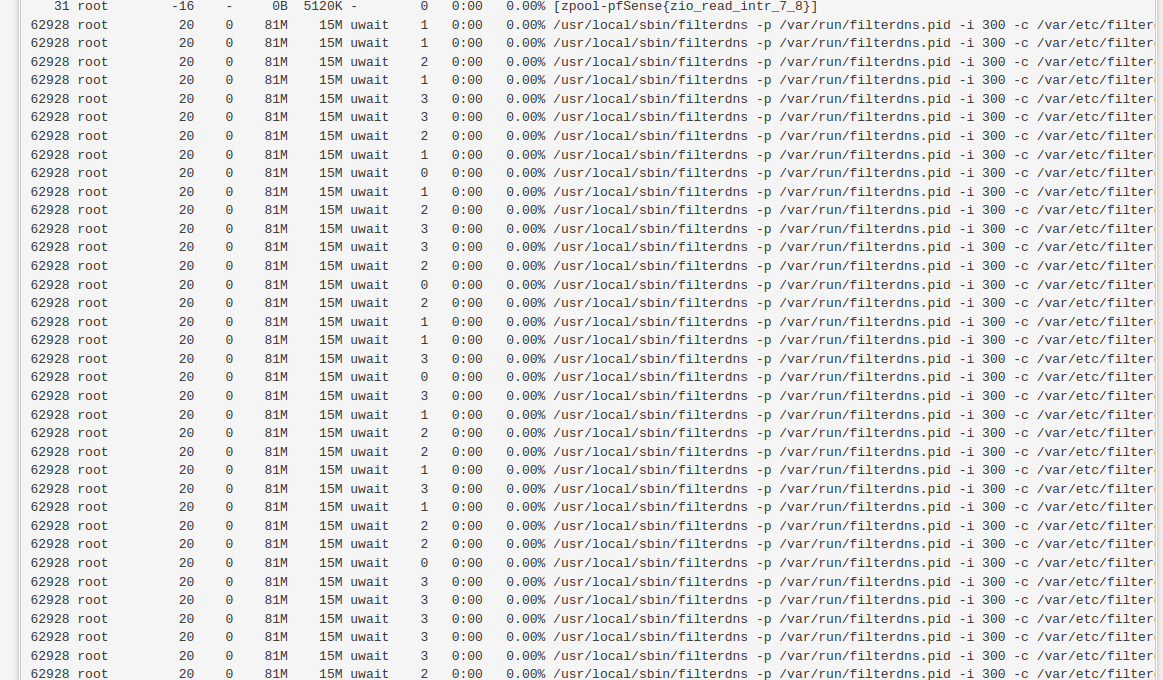
        I tried to stop ntopng, and wait a few minutes ... It fell to 34%

        I noticed a kazillion filterdns processes in Diagnostic --> System Activity

        2db3b0bd-1dd2-41f7-982a-93f96c3427b7-image.png

        I tried to see the in a CLI with : ps -aux (i'm a linux guy) - But they're not shown with that command.

        What cli command will show those filterdns processes And the many ntopng's i see too.

        Edit:
        I have a DOH blocklist loaded via web , does that create a filterdns per "host" or ??

        /Bingo

        If you find my answer useful - Please give the post a 👍 - "thumbs up"

        pfSense+ 23.05.1 (ZFS)

        QOTOM-Q355G4 Quad Lan.
        CPU  : Core i5 5250U, Ram : 8GB Kingston DDR3LV 1600
        LAN  : 4 x Intel 211, Disk  : 240G SAMSUNG MZ7L3240HCHQ SSD

        1 Reply Last reply Reply Quote 0
        • S Offline
          stephenw10 Netgate Administrator
          last edited by Apr 22, 2022, 5:26 PM

          Yes, it can create a lot of filterdns processes. Especially if some things are failing to resolve.
          Check the Resolver logs for errors. Prune any old entries that no longer resolve if you can.

          B 1 Reply Last reply Apr 22, 2022, 5:58 PM Reply Quote 0
          • B Offline
            bingo600 @stephenw10
            last edited by Apr 22, 2022, 5:58 PM

            @stephenw10
            I see no resolver errors
            Everything is resolvable.

            How does that resolverstuff work ?
            Is it a timed job that spawns a resolver for every entry ?

            Is it run every 10 min ?

            /Bingo

            If you find my answer useful - Please give the post a 👍 - "thumbs up"

            pfSense+ 23.05.1 (ZFS)

            QOTOM-Q355G4 Quad Lan.
            CPU  : Core i5 5250U, Ram : 8GB Kingston DDR3LV 1600
            LAN  : 4 x Intel 211, Disk  : 240G SAMSUNG MZ7L3240HCHQ SSD

            1 Reply Last reply Reply Quote 0
            • S Offline
              stephenw10 Netgate Administrator
              last edited by Apr 22, 2022, 6:23 PM

              Every 5mins by default:
              https://docs.netgate.com/pfsense/en/latest/config/advanced-firewall-nat.html#aliases-hostnames-resolve-interval

              1 Reply Last reply Reply Quote 0
              • B Offline
                bingo600
                last edited by bingo600 Apr 23, 2022, 5:45 AM Apr 23, 2022, 5:37 AM

                Well to reply (to my self) on how to list the filterdns processes threads (process number is the same)

                jimp gave a hint here
                https://redmine.pfsense.org/issues/8758

                Use

                ps uxHaww | grep filterdns
                
                root    62928   0.0  0.2  82100  14760  -  Is   Wed16      0:00.00 /usr/local/sbin/filterdns -p /var/run/filterdns.pid -i 300 -c /var/etc/filterdns.conf -d 1
                root    62928   0.0  0.2  82100  14760  -  Is   Wed16      0:00.00 /usr/local/sbin/filterdns -p /var/run/filterdns.pid -i 300 -c /var/etc/filterdns.conf -d 1
                root    62928   0.0  0.2  82100  14760  -  Is   Wed16      0:00.00 /usr/local/sbin/filterdns -p /var/run/filterdns.pid -i 300 -c /var/etc/filterdns.conf -d 1
                root    62928   0.0  0.2  82100  14760  -  Is   Wed16      0:00.00 /usr/local/sbin/filterdns -p /var/run/filterdns.pid -i 300 -c /var/etc/filterdns.conf -d 1
                root    62928   0.0  0.2  82100  14760  -  Is   Wed16      0:00.00 /usr/local/sbin/filterdns -p /var/run/filterdns.pid -i 300 -c /var/etc/filterdns.conf -d 1
                root    62928   0.0  0.2  82100  14760  -  Is   Wed16      0:00.00 /usr/local/sbin/filterdns -p /var/run/filterdns.pid -i 300 -c /var/etc/filterdns.conf -d 1
                root    62928   0.0  0.2  82100  14760  -  Is   Wed16      0:00.00 /usr/local/sbin/filterdns -p /var/run/filterdns.pid -i 300 -c /var/etc/filterdns.conf -d 1
                [22.01-RELEASE][admin@..]/root: ps uxHaww | grep filterdns | wc
                     132    2501   20780


                Sending the output to wc shows 132 line matches , that seems to be in (Is) "Idle state"

                The file : /var/etc/filterdns.conf seems to contain my DNS resolvable aliases , and i have 66 of these.

                [22.01-RELEASE][admin@..../root: cat /var/etc/filterdns.conf | wc
                      66     198    2832
                

                Strange that the # of filterdns processes threads are excactly the double of the DNS entries in /var/etc/filterdns.conf
                But i suppose there is a tech (OS) reason for that , since it's excactly double, and i just don't know enough of the inner work.

                Now to find out how Netgate gets the "filterdns" DNS name shown in the Diagnostics --> System Activity

                ps uxHaww | grep filterdns
                

                Doesn't show the DNS name to be resolved.
                @jimp - Any hint here ?

                
                62928 root         20    0    80M    14M uwait    0   0:00   0.00% /usr/local/sbin/filterdns -p /var/run/filterdns.pid -i 300 -c /var/etc/filterdns.conf -d 1{bigdata.adsunflower}
                62928 root         20    0    80M    14M uwait    2   0:00   0.00% /usr/local/sbin/filterdns -p /var/run/filterdns.pid -i 300 -c /var/etc/filterdns.conf -d 1{choice.microsoft.co}


                Well beside the filterdns processes threads being the double # of the /var/etc/filterdns.conf entries , I see no increase in processes threads etc. So my guess is that the filterdns stuff is behaving as expected , and not causing memory growth , unless you add more entries to resolve.

                /Bingo

                If you find my answer useful - Please give the post a 👍 - "thumbs up"

                pfSense+ 23.05.1 (ZFS)

                QOTOM-Q355G4 Quad Lan.
                CPU  : Core i5 5250U, Ram : 8GB Kingston DDR3LV 1600
                LAN  : 4 x Intel 211, Disk  : 240G SAMSUNG MZ7L3240HCHQ SSD

                1 Reply Last reply Reply Quote 0
                • S Offline
                  stephenw10 Netgate Administrator
                  last edited by Apr 23, 2022, 11:13 AM

                  That output is from top -aSH you should be able to see them there. Though you are limited by the terminal size.

                  Steve

                  1 Reply Last reply Reply Quote 0
                  • T Offline
                    Techniker_ctr
                    last edited by May 5, 2022, 11:49 AM

                    @stephenw10

                    Greetings,

                    I ran our test systems for a while and it seems that the RAM has settled at around 90%. This is not optimal, as we cannot use our monitoring effectively with such high values.

                    So far, I have not been able to detect any failure due to the increase in RAM consumption.

                    I have now deployed a test system with 2 GB RAM to see whether the RAM increase settles back at 90% or whether it remains at around 50%. After the deployment, the RAM on the test system is at 26%. I would provide feedback if I have any further information on this.

                    In the meantime, do you have any other ideas about the reason for the continuous increase in RAM?

                    1 Reply Last reply Reply Quote 0
                    • S Offline
                      stephenw10 Netgate Administrator
                      last edited by May 5, 2022, 1:35 PM

                      Still no obvious process with increasing usage?

                      T 1 Reply Last reply May 5, 2022, 2:52 PM Reply Quote 0
                      • T Offline
                        Techniker_ctr @stephenw10
                        last edited by May 5, 2022, 2:52 PM

                        @stephenw10

                        Not that i can see, here is the same system output side by side:

                        System as posted before:
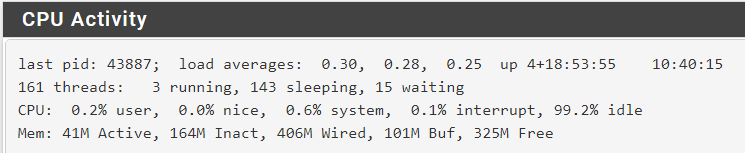
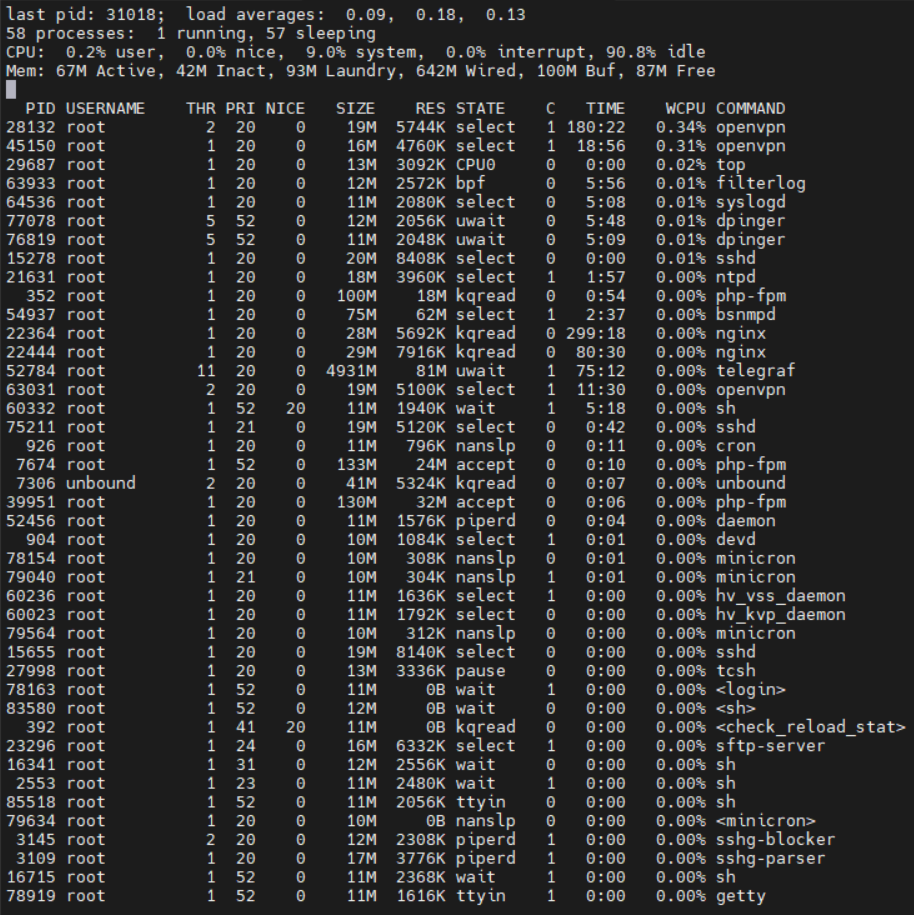
                        top:
                        Before:
                        1650552872093-top_pfsense_img1_10743_cen.png

                        Today:
                        htop_pfsense_img2_10743_wired_new.png

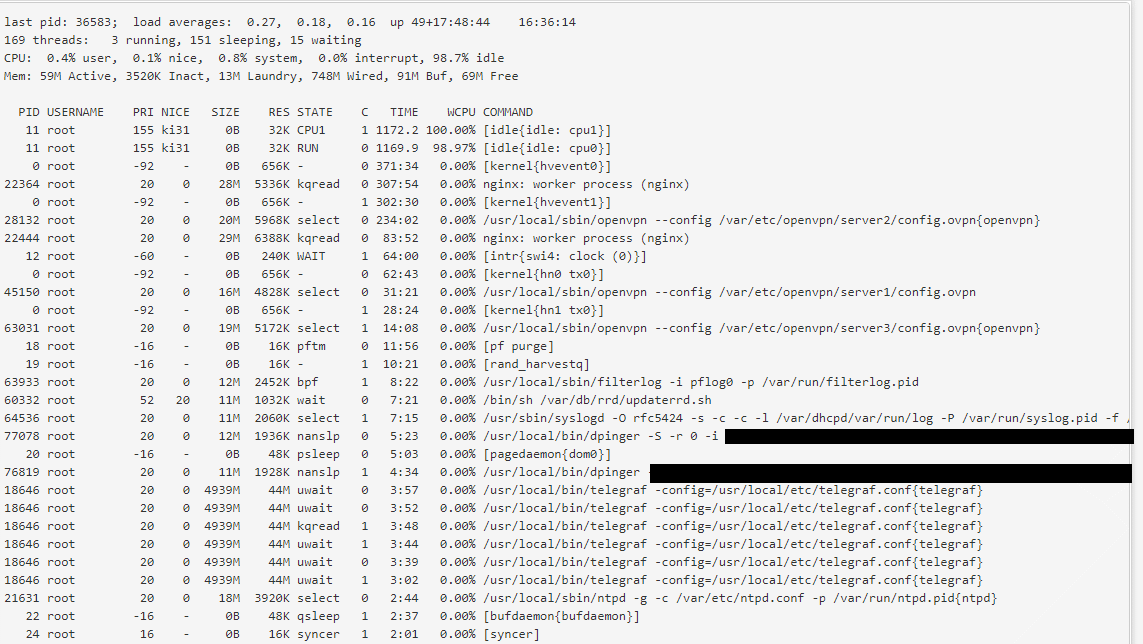
                        All I see is an increase in the "wired" memory
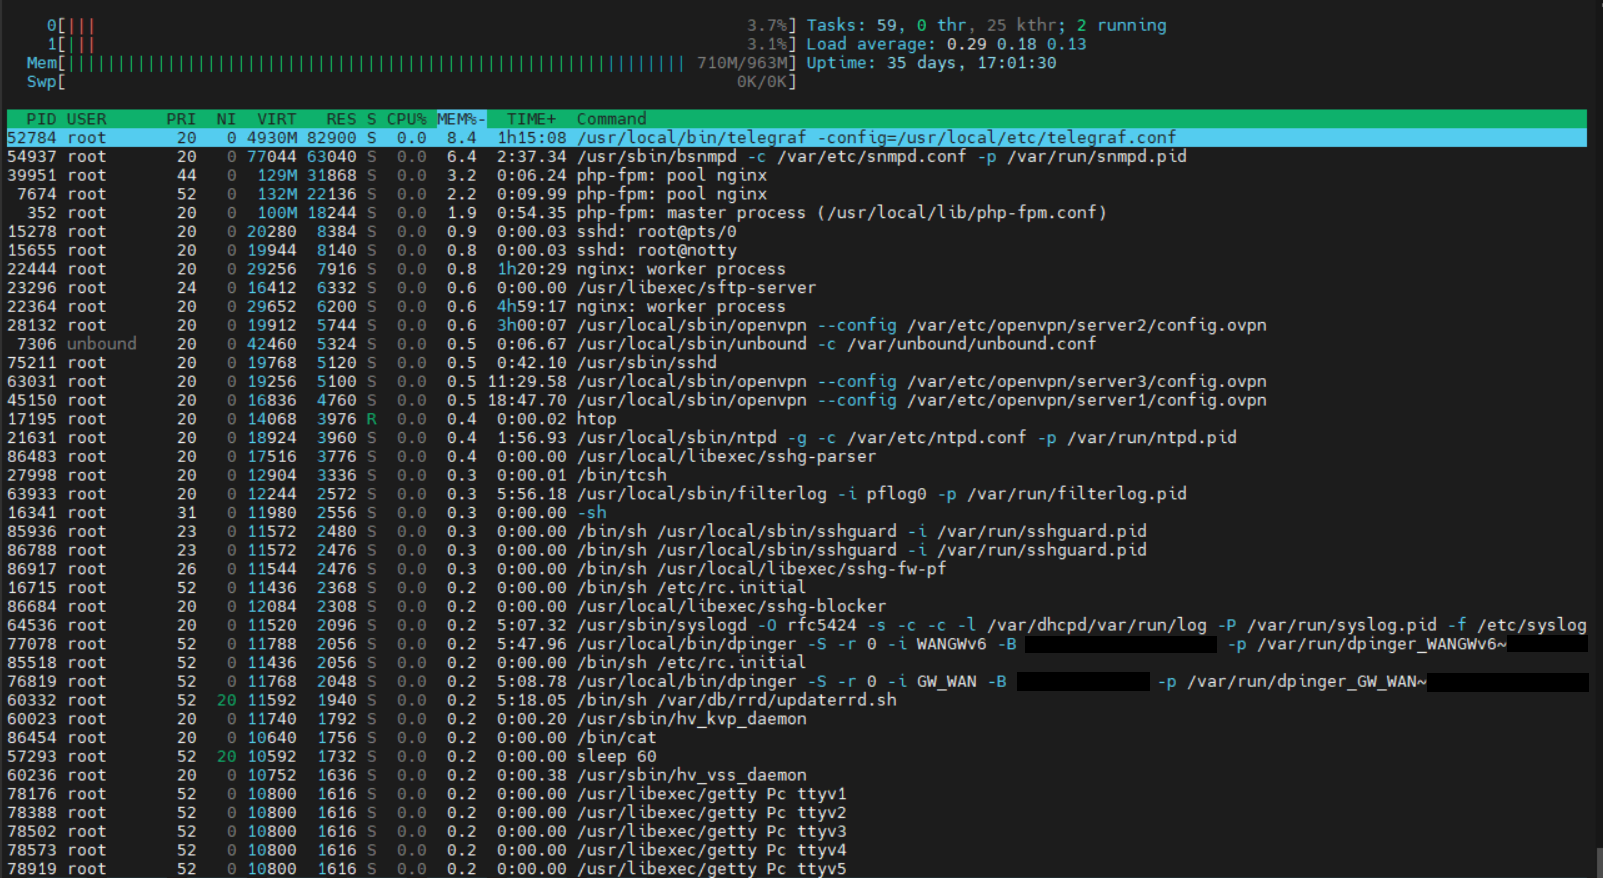
                        htop:
                        Before:
                        1650552914748-htop_pfsense_img1_10743_cen.png

                        Today:
                        htop_pfsense_img1_10743_telegraf_on_new_cen.png

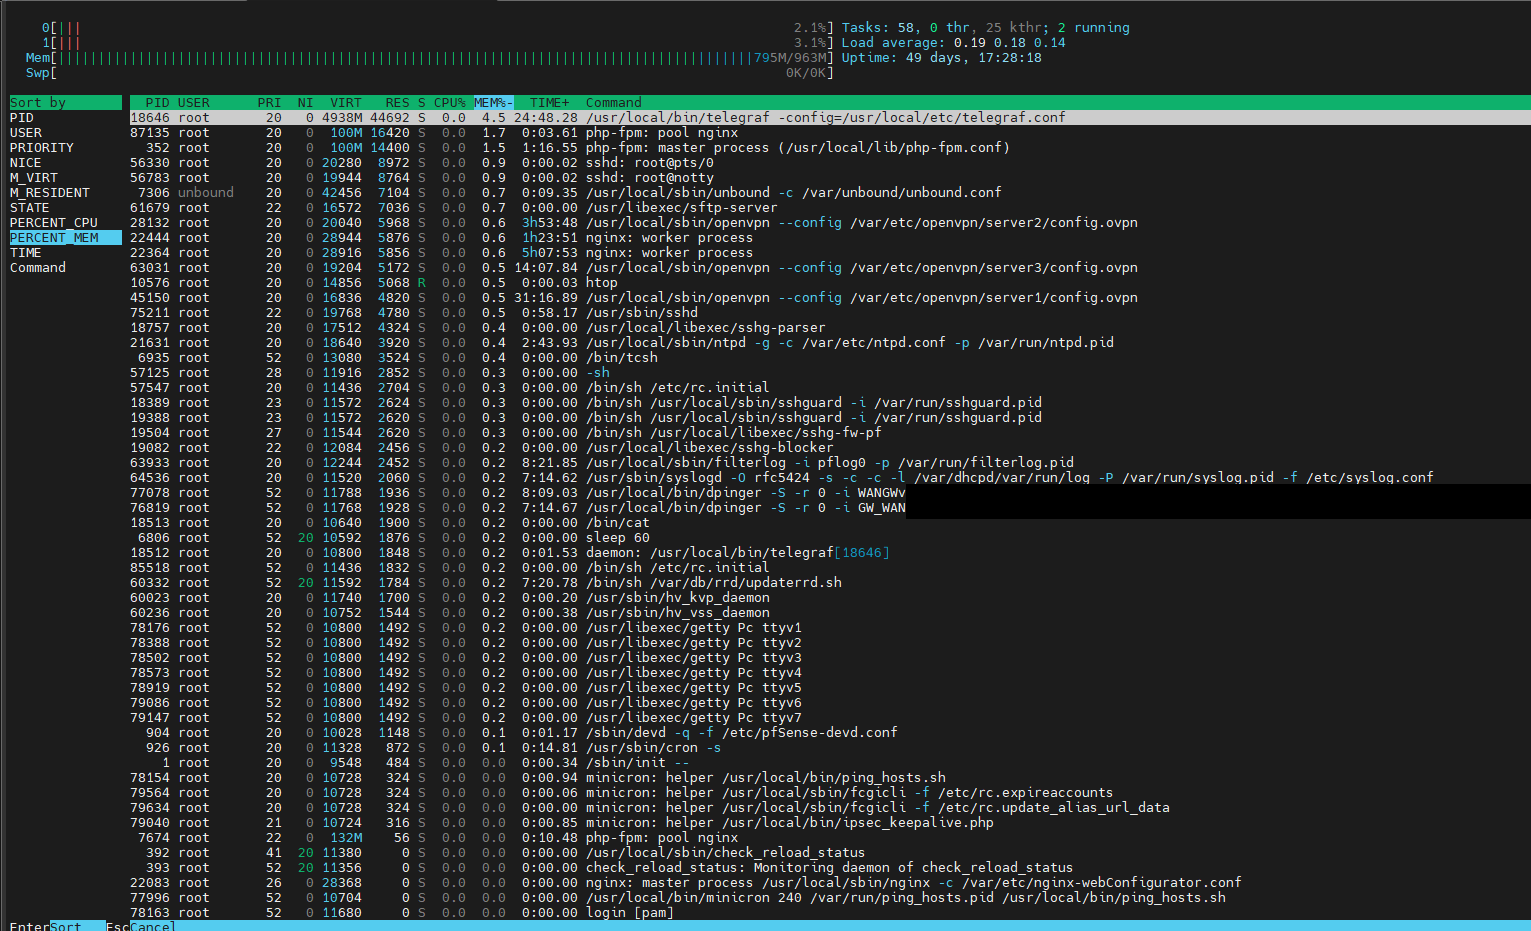
                        telegraf needs even less RAM than in the last analysis, I suspect that telegraf did just not compiled any data at this point.

                        Therefore, I do not see any really meaningful indications as to why the RAM is rising.

                        1 Reply Last reply Reply Quote 0
                        • S Offline
                          stephenw10 Netgate Administrator
                          last edited by May 5, 2022, 3:59 PM

                          What does that usage look like in the pfSense monitoring graphs?

                          On my own 22.01 system I see wired use increase but that's not necessarily a problem. The is no need for the kernel to release RAM until the available free ram becomes too low for the requests using it.

                          Steve

                          fireodoF 1 Reply Last reply May 5, 2022, 4:11 PM Reply Quote 0
                          • fireodoF Online
                            fireodo @stephenw10
                            last edited by fireodo May 5, 2022, 5:36 PM May 5, 2022, 4:11 PM

                            @Techniker_ctr
                            @stephenw10 said in Continuously increasing memory usage since the update to 2.6:

                            On my own 22.01 system I see wired use increase but that's not necessarily a problem. The is no need for the kernel to release RAM until the available free ram becomes too low for the requests using it.

                            Is it possible that this is a discussion of an old missunderstanding of memory usage in unix systems?

                            Kettop Mi4300YL CPU: i5-4300Y @ 1.60GHz RAM: 8GB Ethernet Ports: 4
                            SSD: SanDisk pSSD-S2 16GB (ZFS) WiFi: WLE200NX
                            pfsense 2.8.0 CE
                            Packages: Apcupsd, Cron, Iftop, Iperf, LCDproc, Nmap, pfBlockerNG, RRD_Summary, Shellcmd, Snort, Speedtest, System_Patches.

                            1 Reply Last reply Reply Quote 0
                            • S Offline
                              stephenw10 Netgate Administrator
                              last edited by May 5, 2022, 5:09 PM

                              Well kinda. But also what changed between 2.5.2 and 2.6.0 to cause the differing usage pattern. And is it a problem.

                              T 1 Reply Last reply May 6, 2022, 9:48 AM Reply Quote 1
                              • T Offline
                                Techniker_ctr @stephenw10
                                last edited by May 6, 2022, 9:48 AM

                                @stephenw10

                                Hey Steve thanks for your help,

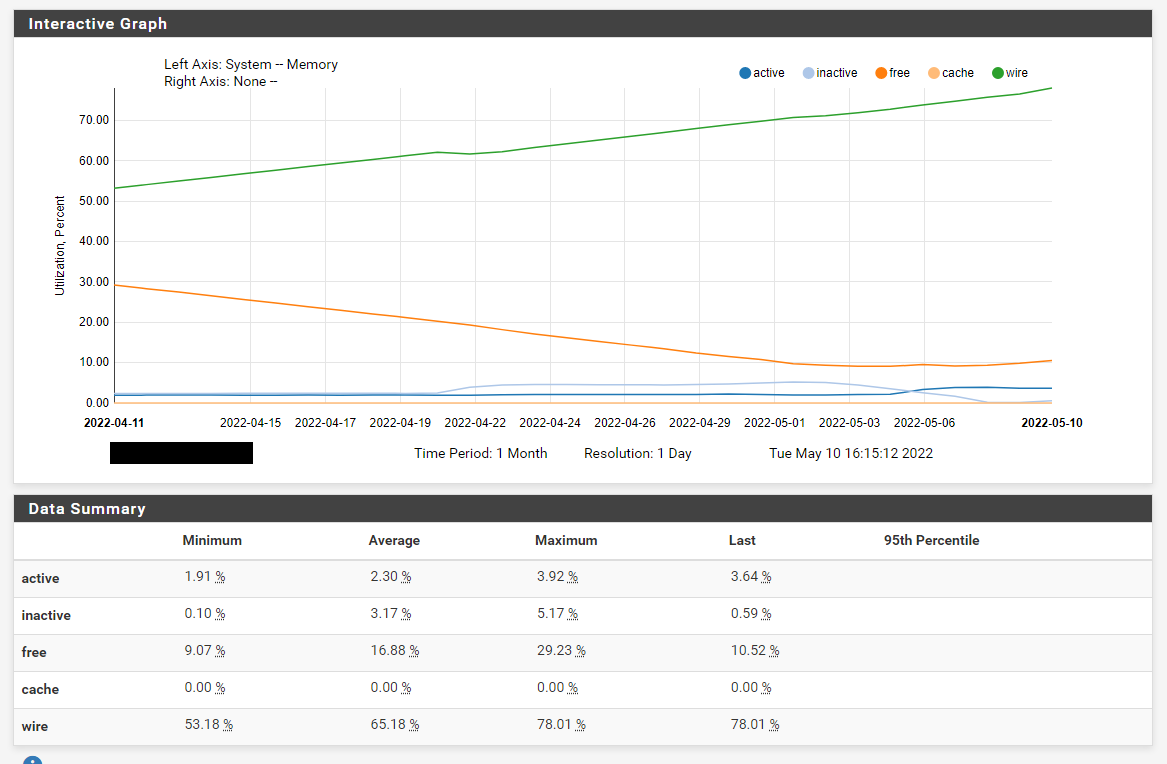
                                here are the requested pfSense monitoring pages:

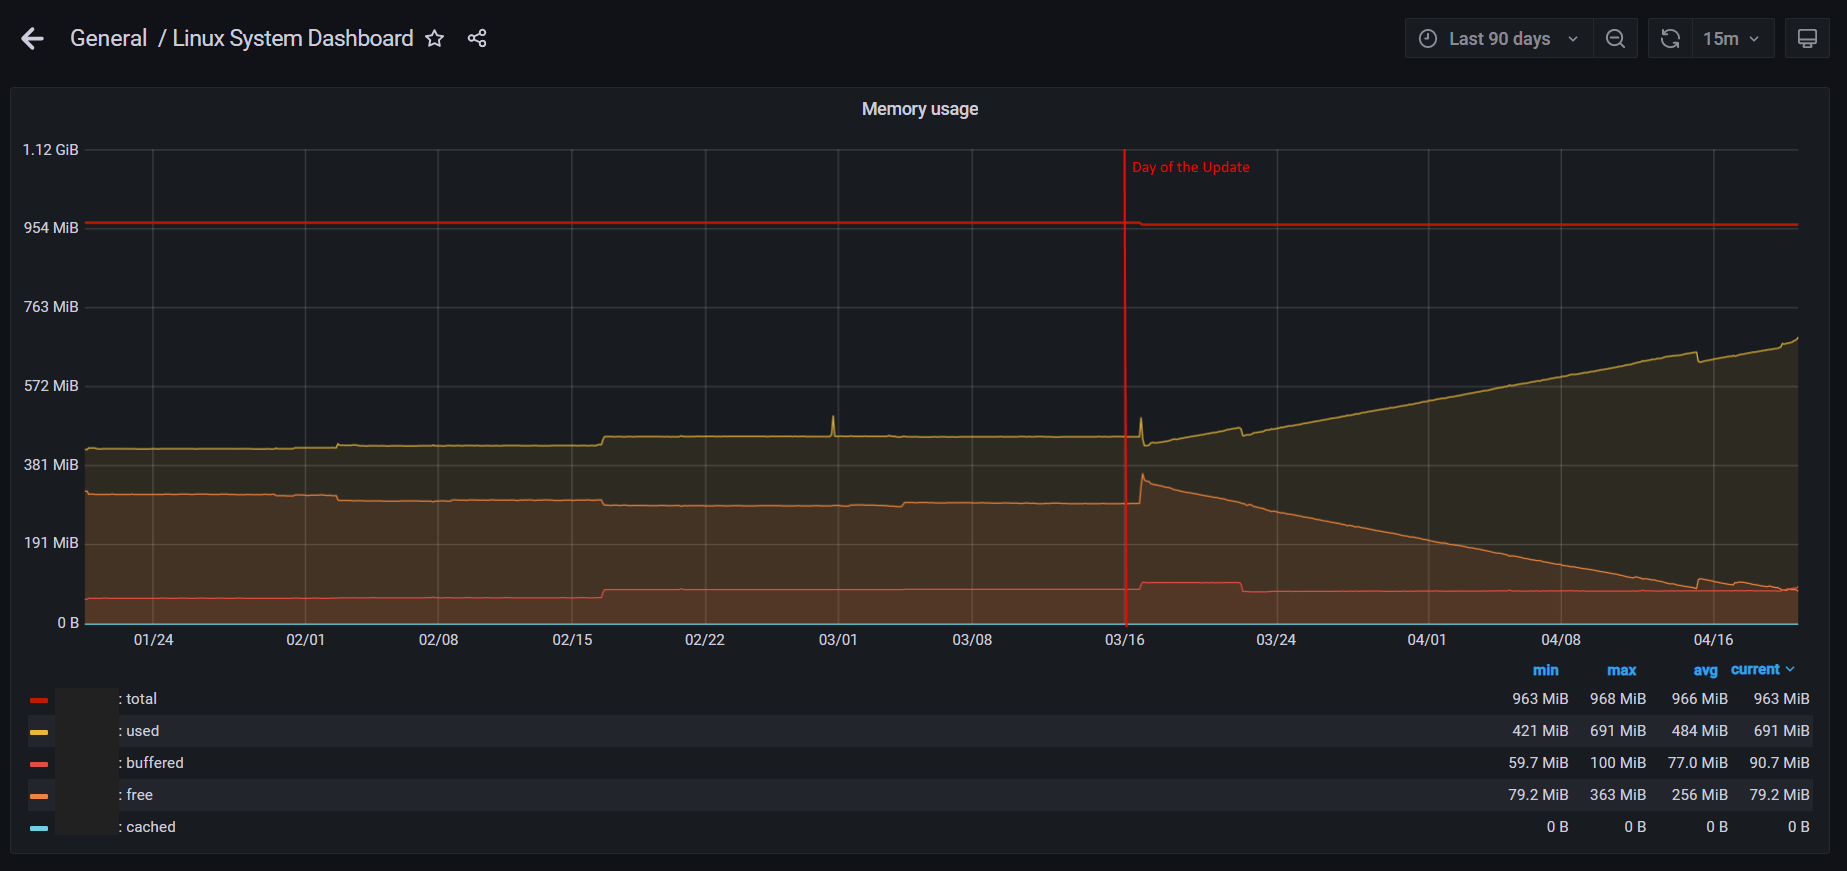
                                Here in a 3 month view:
                                3_month_10743_Status_Monitoring.png

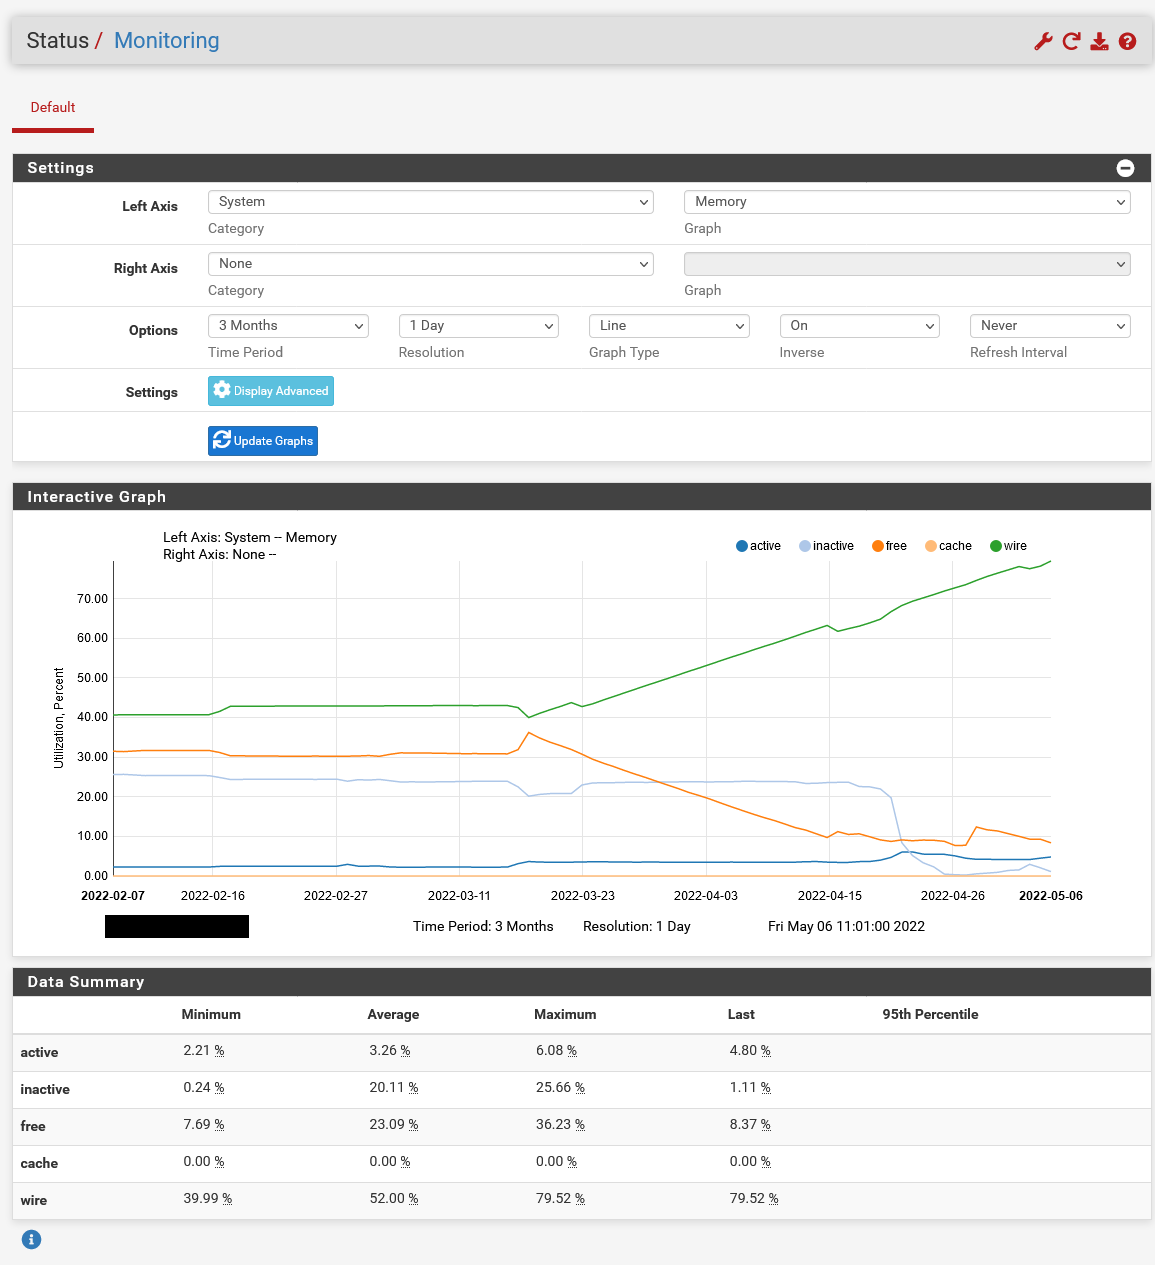
                                The Day we applied the update is graphically very well visible.

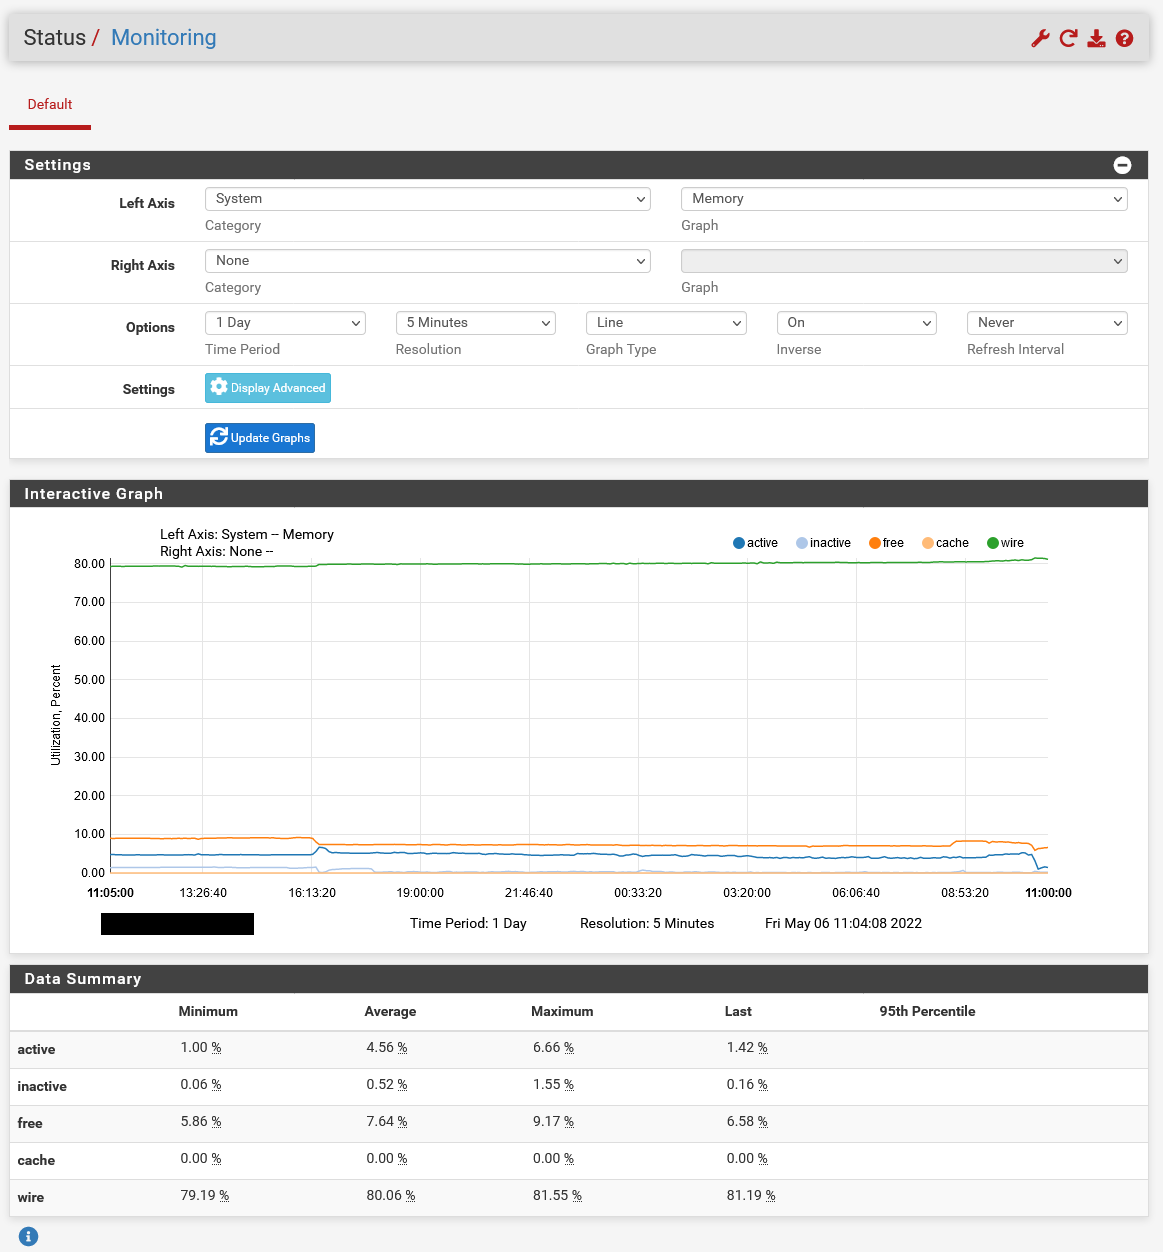
                                Here in a 1 day view:
                                1_day_10743_Status_Monitoring.png

                                We also had our first outage today which was clearly due to the increased RAM levels:

                                May  6 08:31:54 xxxx:xxxx:xxxx:xxxx::xxxx 1 2022-05-06T08:31:54.435677+02:00 xxxxxxx.xxxxxxxxx.xx kernel - - - pid 7306 (unbound), jid 0, uid 59, was killed: out of swap space 
                                

                                Because of the error the systems behind the pfSense were without DNS resolution. Therefore it seems that the RAM is not released for new processes. The system is currently at 94% RAM usage according to our monitoring.

                                Any Suggestion?

                                1 Reply Last reply Reply Quote 0
                                • S Offline
                                  stephenw10 Netgate Administrator
                                  last edited by May 6, 2022, 12:30 PM

                                  Not immediately. Let me see what I can find...

                                  It's interesting that you have not exhausted free memory and the system appears to be releasing inactive memory once free hits 10% which is what I expect.

                                  T 1 Reply Last reply May 6, 2022, 2:11 PM Reply Quote 0
                                  • T Offline
                                    Techniker_ctr @stephenw10
                                    last edited by May 6, 2022, 2:11 PM

                                    @stephenw10

                                    a small addendum:

                                    we just had a second system with the same failure.

                                    <3>1 2022-05-06T14:57:46.424812+02:00 xxxxxx.xxxxxxxx.xx kernel - - - pid 52014 (unbound), jid 0, uid 59, was killed: out of swap space
                                    

                                    Here is the output of the monitoring:
                                    2_month_12966_Status_Monitoring.png

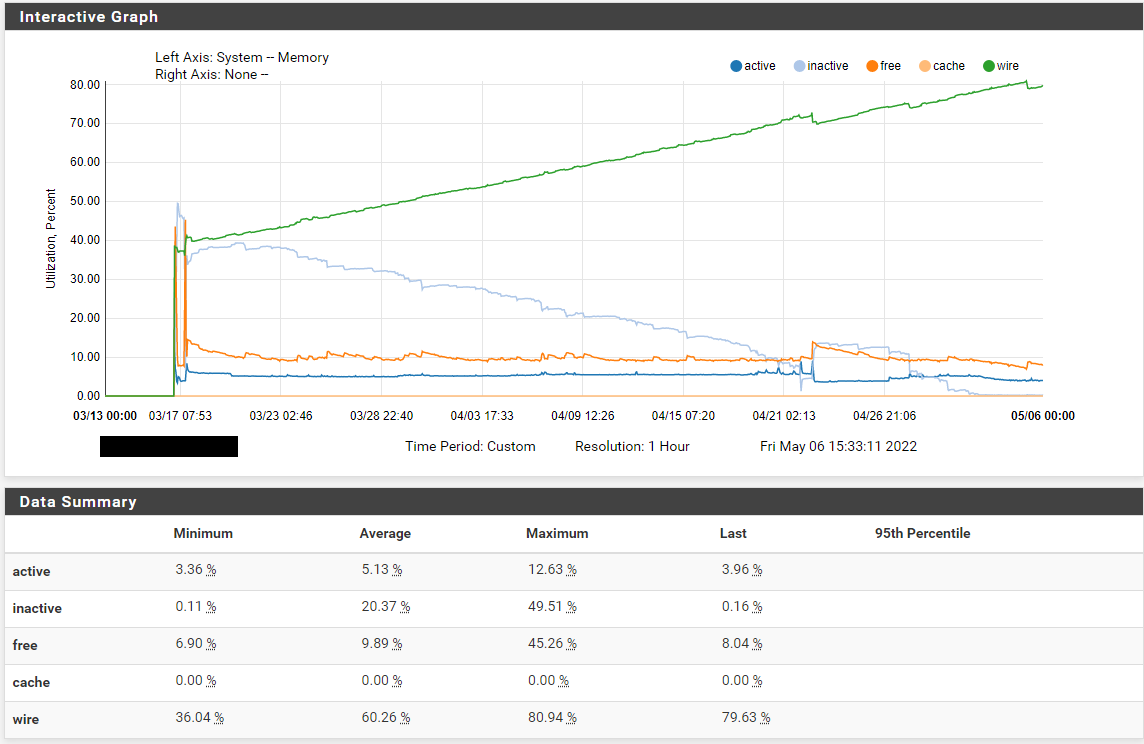
                                    This is a fairly new system uptime 50 days. 03/17 was the deploy so the Data is a bit messy that day.

                                    A rough pattern seems to be slowly emerging:
                                    I am currently monitoring 11 (2.6) systems, following is the uptime along with RAM usage:

                                    VM1: 43 Days 90% (no failure yet)
                                    VM2: 44 Days 90% (no failure yet)
                                    VM3: 01 Days 26% (2GB RAM Testsystem)
                                    VM4: 34 Days 94% (no failure yet)
                                    VM5: 50 Days 93% (first failure)
                                    VM6: 50 Days 93% (second failure)
                                    VM7: 20 Days 61%
                                    VM8: 22 Days 66%
                                    VM9: 22 Days 65%
                                    VM10: 25 days 68%
                                    VM11: 43 Days 89%

                                    VM4 stands out a bit, but there is also a bit more going on than with the others, but it seems that at 50 days the critical mass is reached.

                                    Maybe this information will help with your investigations, if you need more information just ask.

                                    1 Reply Last reply Reply Quote 0
                                    • S Offline
                                      stephenw10 Netgate Administrator
                                      last edited by May 6, 2022, 2:51 PM

                                      And they are all configured the same; 1G RAM, VMs in Hyper-V?

                                      Same package loads?

                                      T 2 Replies Last reply May 6, 2022, 3:47 PM Reply Quote 0
                                      • T Offline
                                        Techniker_ctr @stephenw10
                                        last edited by Techniker_ctr May 6, 2022, 3:48 PM May 6, 2022, 3:47 PM

                                        @stephenw10

                                        yes that is correct. Some have 1 or 2 IPsec-Tunnels or ovpn setups. But the fundation is the same

                                        2 Core CPU
                                        1 GB RAM
                                        5 GB SSD
                                        Filesystem: ufs
                                        HV: Hyper-V

                                        Installed Packages:
                                        Cron 0.3.7_5
                                        openvpn-client-export 1.6_4
                                        sudo 0.3_6
                                        Telegraf net-0.9_6

                                        except VM3, which is a new test system with 2 GB RAM

                                        1 Reply Last reply Reply Quote 0
                                        • T Offline
                                          Techniker_ctr @stephenw10
                                          last edited by Techniker_ctr May 10, 2022, 2:47 PM May 10, 2022, 2:18 PM

                                          @stephenw10

                                          We just had another failure on VM1 due to the RAM usage:

                                          There were error(s) loading the rules: /tmp/rules.debug:19: cannot define table bogonsv6: Cannot allocate memory - The line in question reads [19]: table <bogonsv6> persist file "/etc/bogonsv6"
                                          @ 2022-05-10 16:06:25

                                          1_month_12780_Status_Monitoring.png

                                          K 1 Reply Last reply May 10, 2022, 2:34 PM Reply Quote 0
                                          • First post
                                            Last post
                                          Copyright 2025 Rubicon Communications LLC (Netgate). All rights reserved.
                                            This community forum collects and processes your personal information.
                                            consent.not_received