Continuously increasing memory usage since the update to 2.6
-
Not that i can see, here is the same system output side by side:
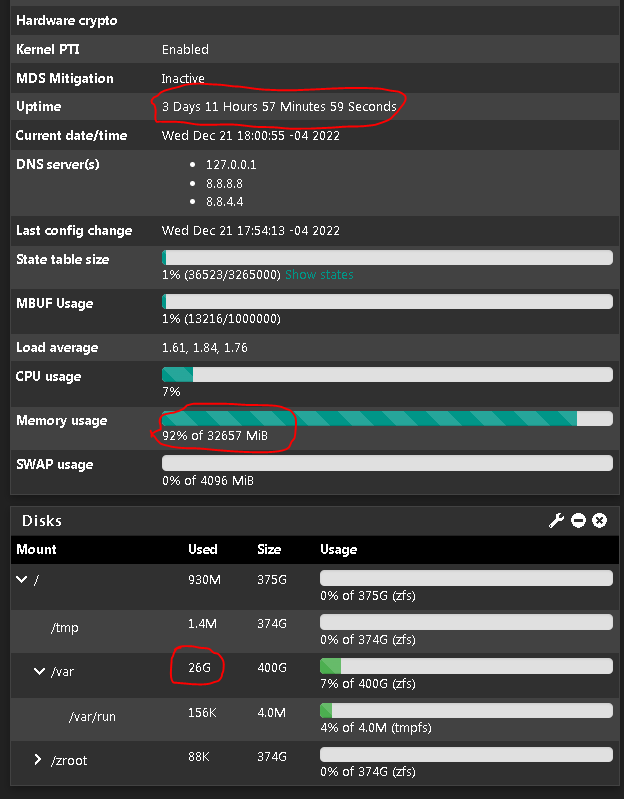
System as posted before:
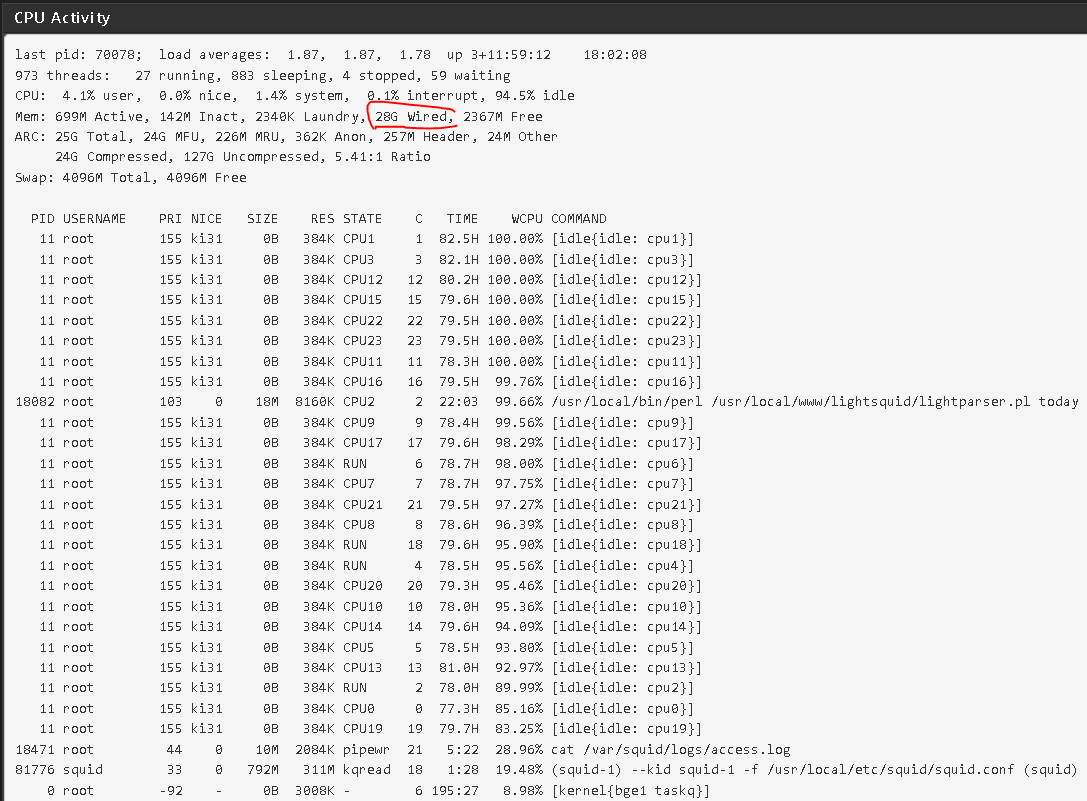
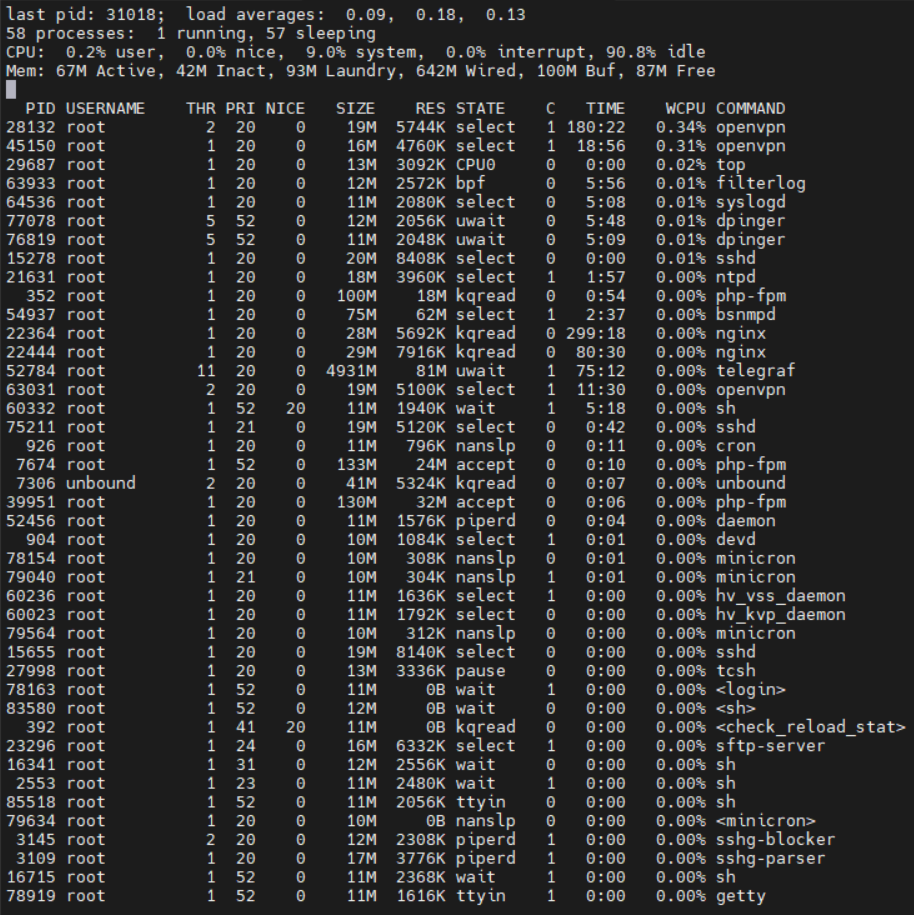
top:
Before:
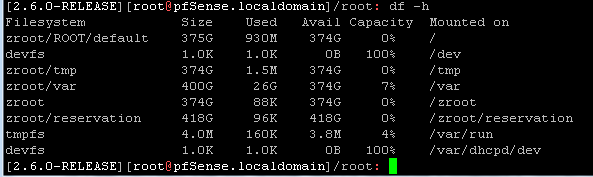
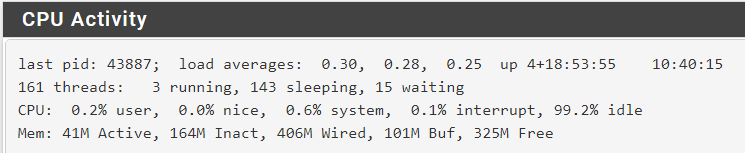
Today:
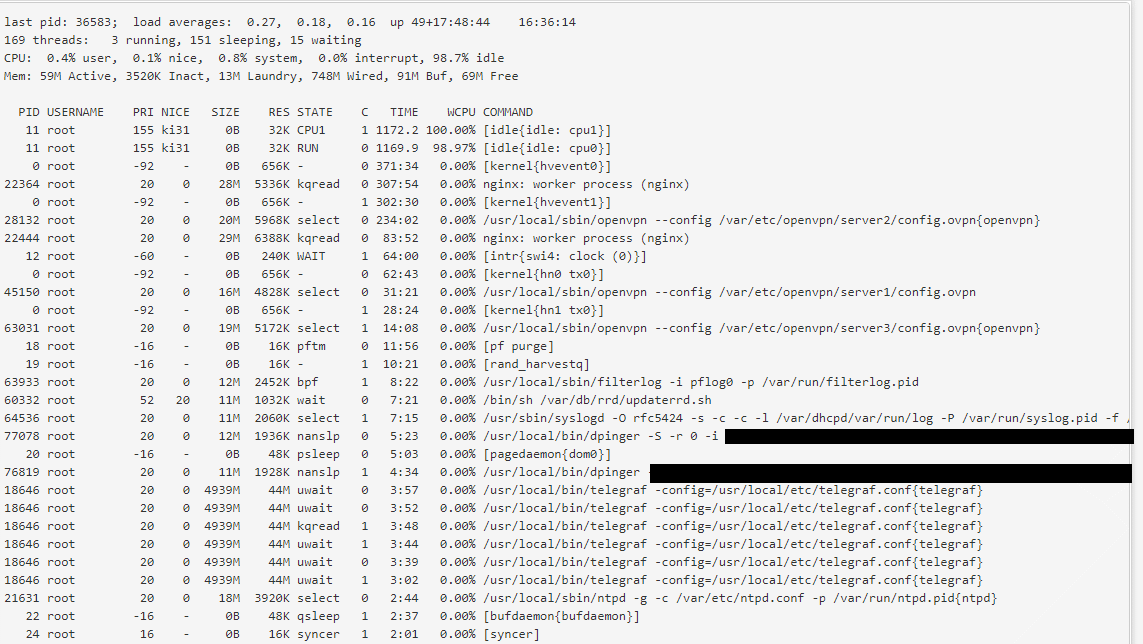
All I see is an increase in the "wired" memory
htop:
Before:
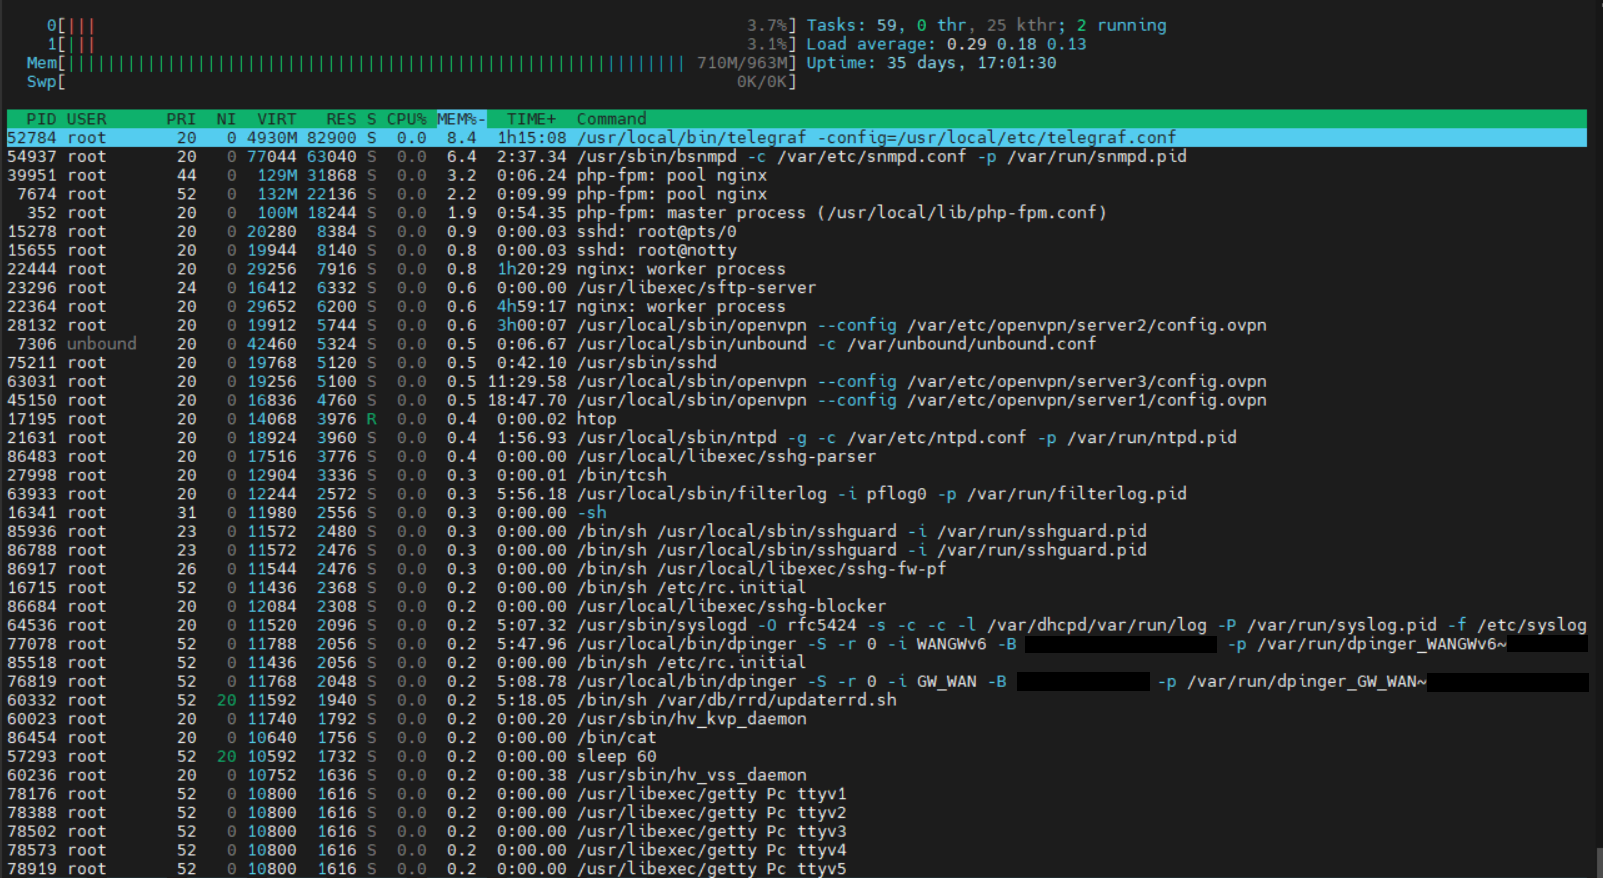
Today:
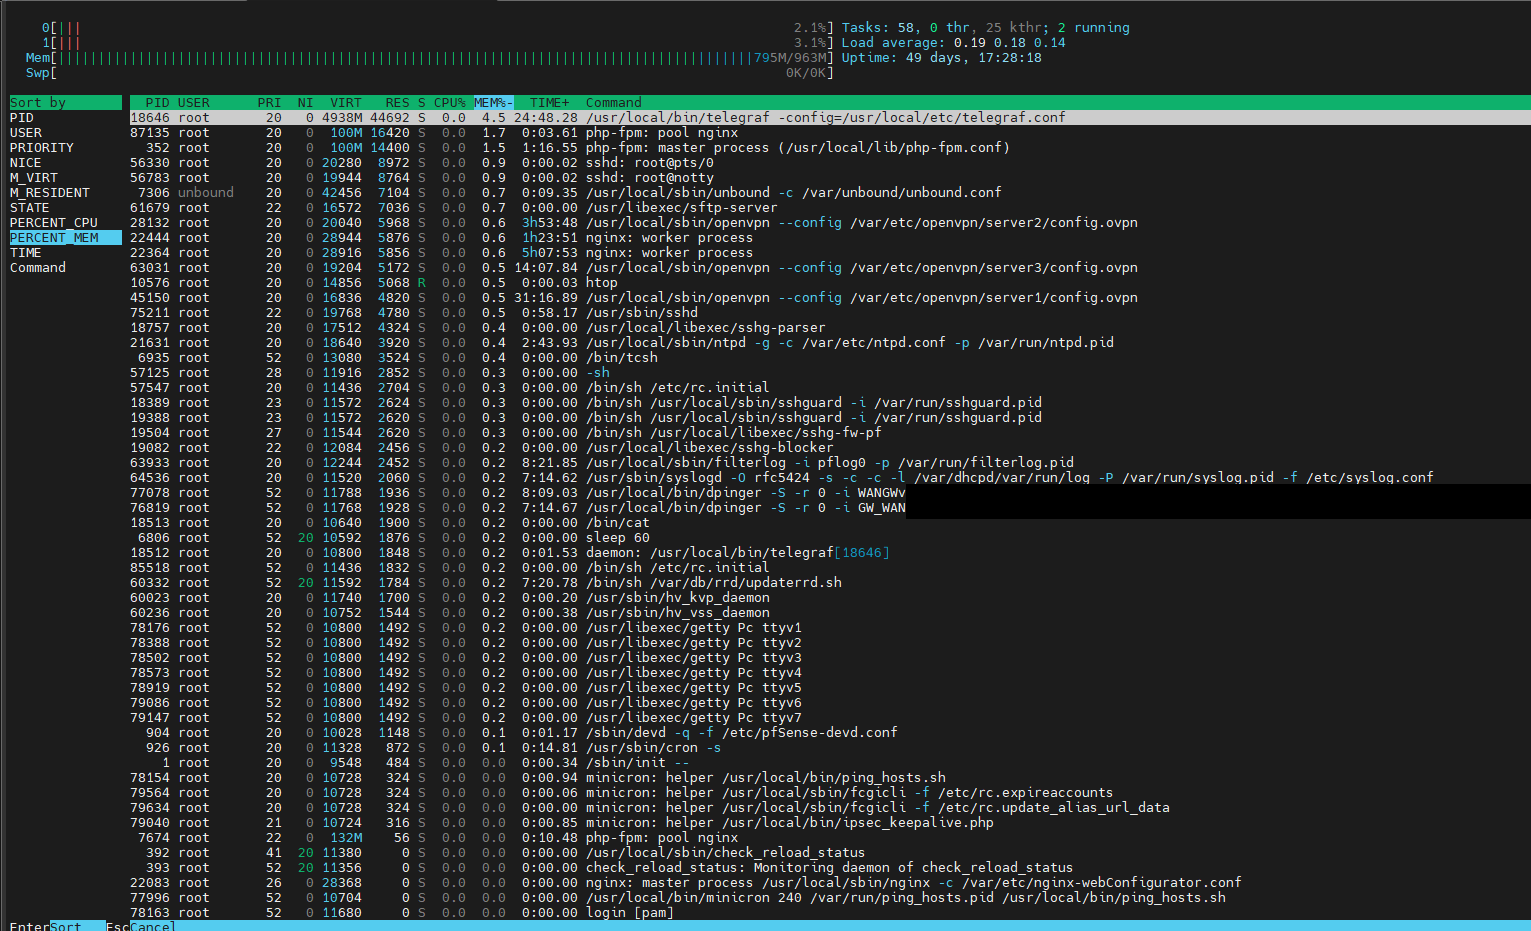
telegraf needs even less RAM than in the last analysis, I suspect that telegraf did just not compiled any data at this point.
Therefore, I do not see any really meaningful indications as to why the RAM is rising.
-
What does that usage look like in the pfSense monitoring graphs?
On my own 22.01 system I see wired use increase but that's not necessarily a problem. The is no need for the kernel to release RAM until the available free ram becomes too low for the requests using it.
Steve
-
@Techniker_ctr
@stephenw10 said in Continuously increasing memory usage since the update to 2.6:On my own 22.01 system I see wired use increase but that's not necessarily a problem. The is no need for the kernel to release RAM until the available free ram becomes too low for the requests using it.
Is it possible that this is a discussion of an old missunderstanding of memory usage in unix systems?
-
Well kinda. But also what changed between 2.5.2 and 2.6.0 to cause the differing usage pattern. And is it a problem.
-
Hey Steve thanks for your help,
here are the requested pfSense monitoring pages:
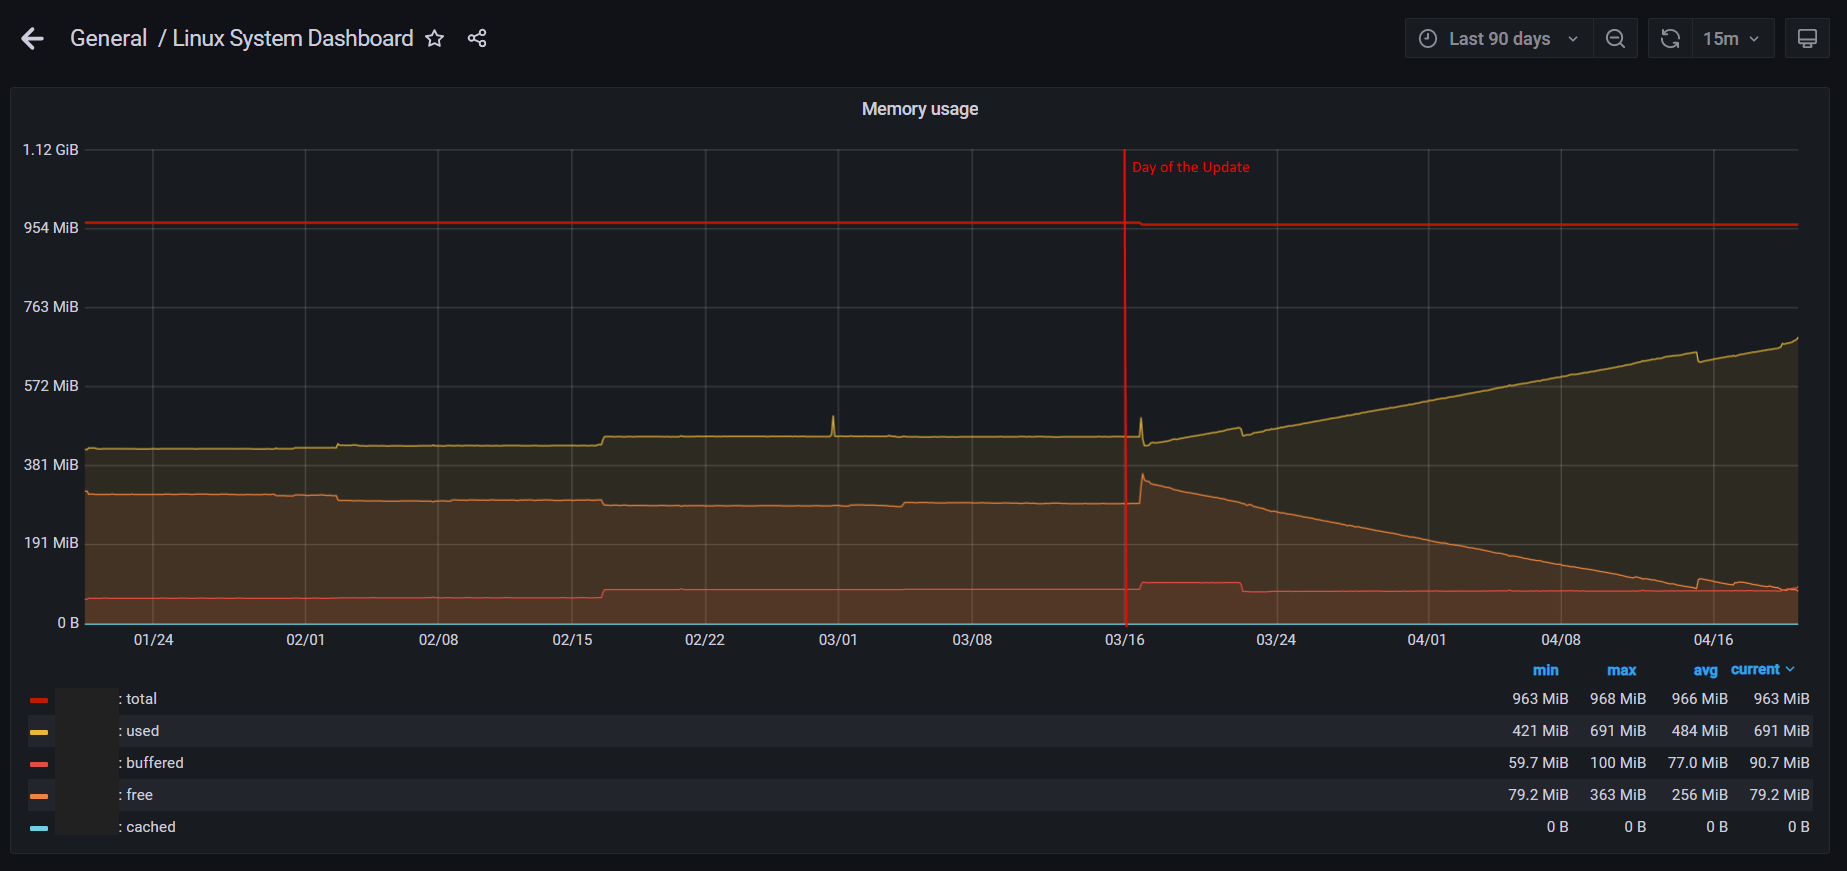
Here in a 3 month view:
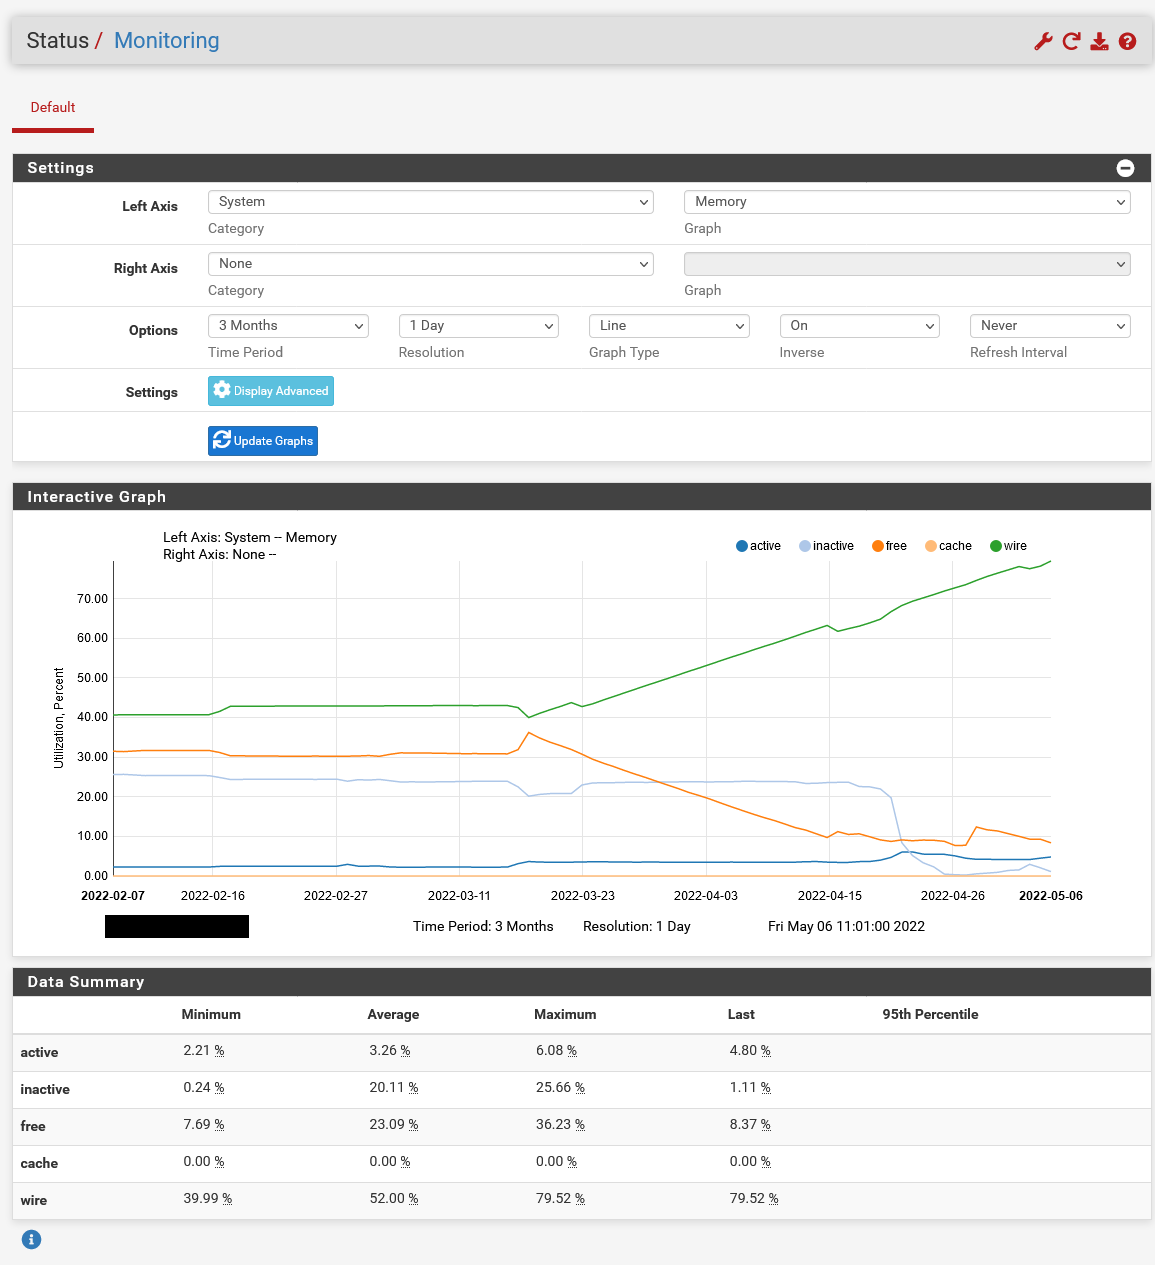
The Day we applied the update is graphically very well visible.
Here in a 1 day view:
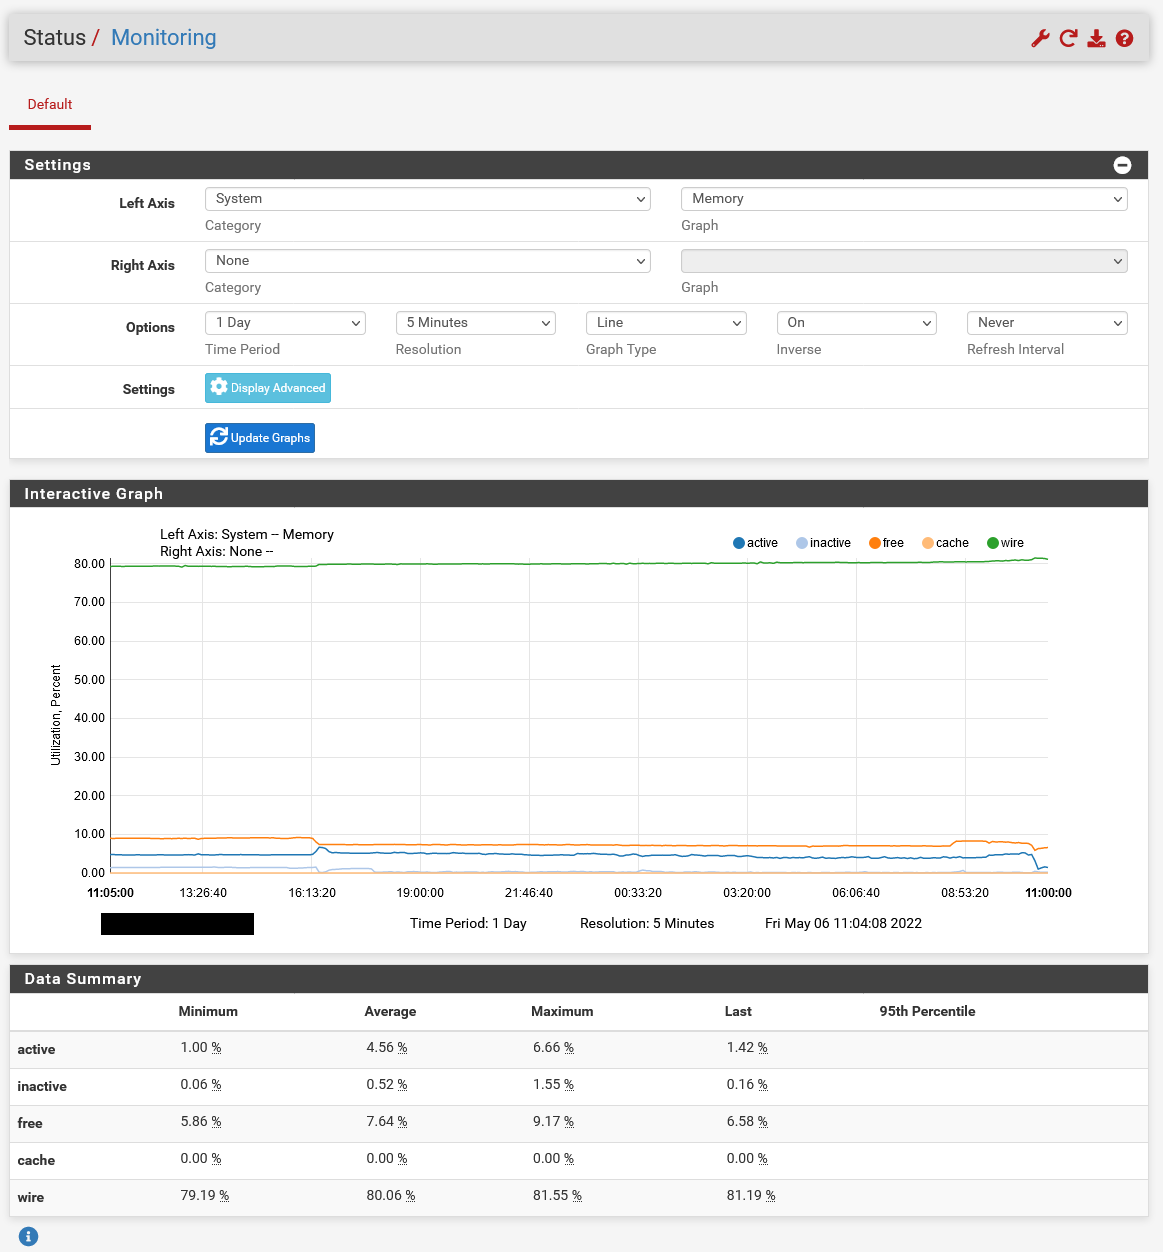
We also had our first outage today which was clearly due to the increased RAM levels:
May 6 08:31:54 xxxx:xxxx:xxxx:xxxx::xxxx 1 2022-05-06T08:31:54.435677+02:00 xxxxxxx.xxxxxxxxx.xx kernel - - - pid 7306 (unbound), jid 0, uid 59, was killed: out of swap spaceBecause of the error the systems behind the pfSense were without DNS resolution. Therefore it seems that the RAM is not released for new processes. The system is currently at 94% RAM usage according to our monitoring.
Any Suggestion?
-
Not immediately. Let me see what I can find...
It's interesting that you have not exhausted free memory and the system appears to be releasing inactive memory once free hits 10% which is what I expect.
-
a small addendum:
we just had a second system with the same failure.
<3>1 2022-05-06T14:57:46.424812+02:00 xxxxxx.xxxxxxxx.xx kernel - - - pid 52014 (unbound), jid 0, uid 59, was killed: out of swap spaceHere is the output of the monitoring:
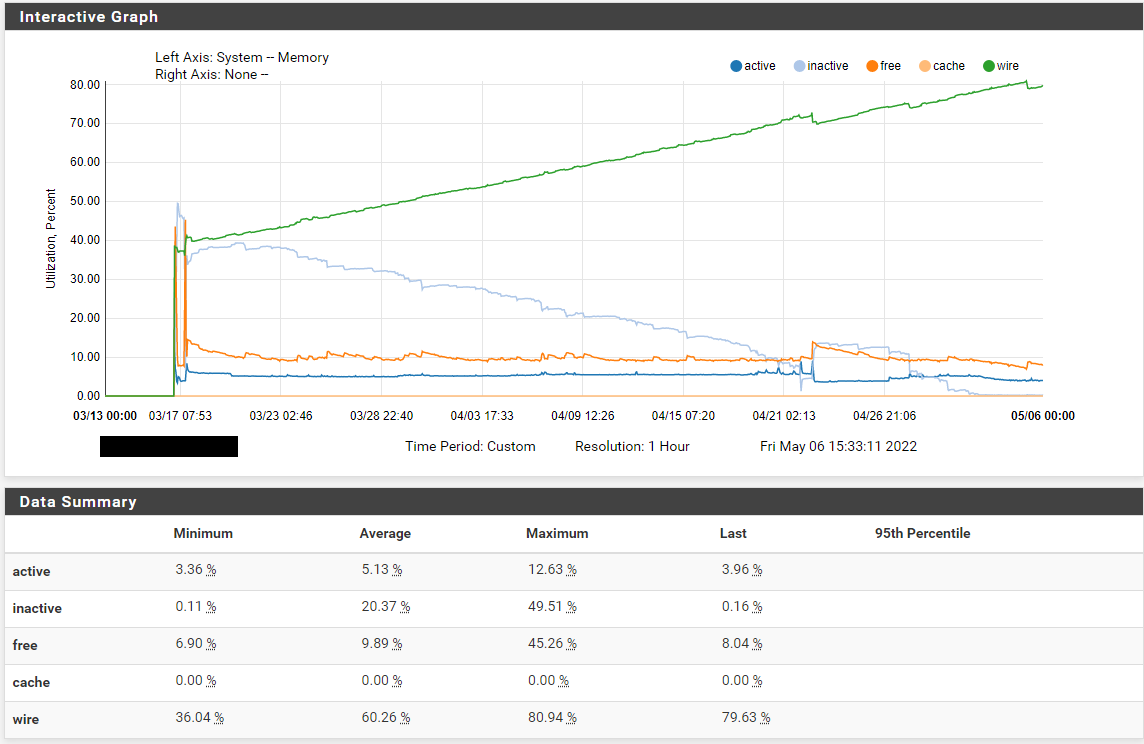
This is a fairly new system uptime 50 days. 03/17 was the deploy so the Data is a bit messy that day.
A rough pattern seems to be slowly emerging:
I am currently monitoring 11 (2.6) systems, following is the uptime along with RAM usage:VM1: 43 Days 90% (no failure yet)
VM2: 44 Days 90% (no failure yet)
VM3: 01 Days 26% (2GB RAM Testsystem)
VM4: 34 Days 94% (no failure yet)
VM5: 50 Days 93% (first failure)
VM6: 50 Days 93% (second failure)
VM7: 20 Days 61%
VM8: 22 Days 66%
VM9: 22 Days 65%
VM10: 25 days 68%
VM11: 43 Days 89%VM4 stands out a bit, but there is also a bit more going on than with the others, but it seems that at 50 days the critical mass is reached.
Maybe this information will help with your investigations, if you need more information just ask.
-
And they are all configured the same; 1G RAM, VMs in Hyper-V?
Same package loads?
-
yes that is correct. Some have 1 or 2 IPsec-Tunnels or ovpn setups. But the fundation is the same
2 Core CPU
1 GB RAM
5 GB SSD
Filesystem: ufs
HV: Hyper-VInstalled Packages:
Cron 0.3.7_5
openvpn-client-export 1.6_4
sudo 0.3_6
Telegraf net-0.9_6except VM3, which is a new test system with 2 GB RAM
-
We just had another failure on VM1 due to the RAM usage:
There were error(s) loading the rules: /tmp/rules.debug:19: cannot define table bogonsv6: Cannot allocate memory - The line in question reads [19]: table <bogonsv6> persist file "/etc/bogonsv6"
@ 2022-05-10 16:06:25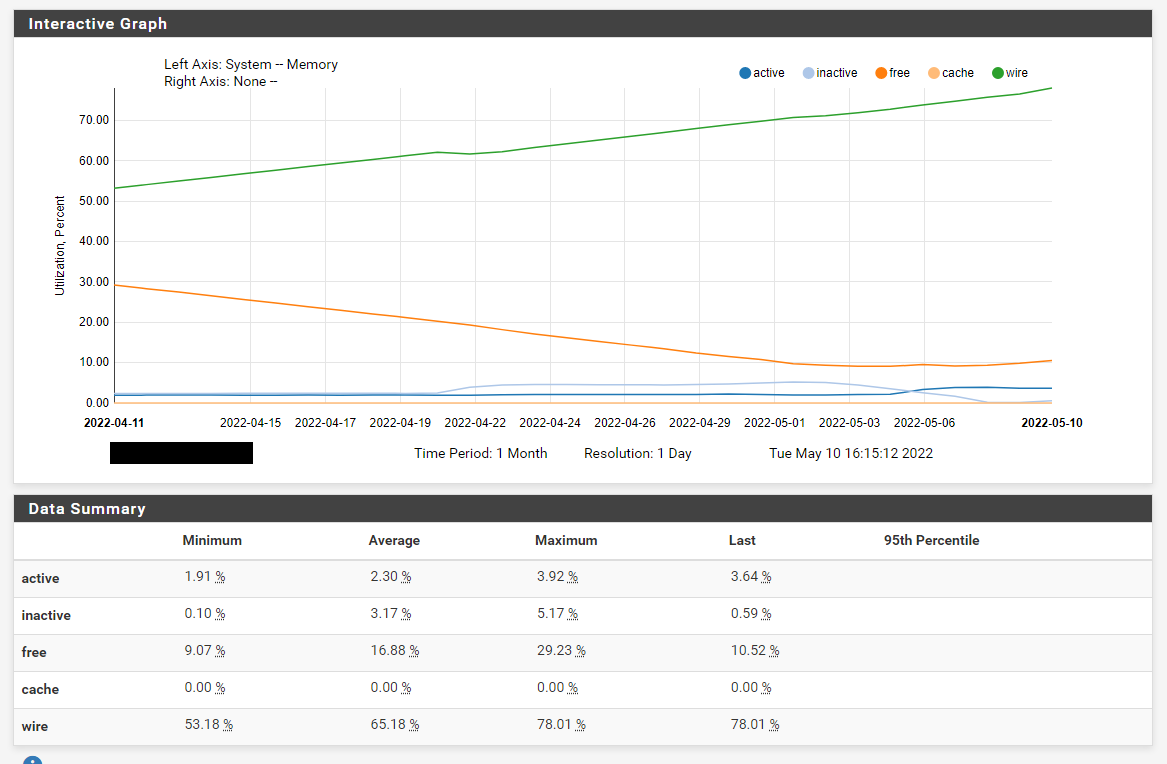
-
Can you post the output of
vmstat -z, ideally on a machine that's using most of its memory? If there's a memory leak in the kernel there may be some indication of it there. -
Following the output on VM1
ITEM SIZE LIMIT USED FREE REQ FAIL SLEEP UMA Kegs: 224, 0, 142, 11, 142, 0, 0 UMA Zones: 680, 0, 143, 2, 143, 0, 0 UMA Slabs: 80, 0, 18750, 450, 109008, 0, 0 UMA Hash: 256, 0, 9, 6, 14, 0, 0 4 Bucket: 32, 0, 27, 598, 1498399, 0, 0 6 Bucket: 48, 0, 7, 574, 863703, 0, 0 8 Bucket: 64, 0, 26, 780, 1263635, 19, 0 12 Bucket: 96, 0, 10, 277, 175069, 0, 0 16 Bucket: 128, 0, 54, 318, 53744, 1, 0 32 Bucket: 256, 0, 47, 148, 836378, 4, 0 64 Bucket: 512, 0, 56, 72, 1119551,81796, 0 128 Bucket: 1024, 0, 44, 24, 535362, 1, 0 256 Bucket: 2048, 0, 52, 10, 4815883, 19, 0 vmem: 1856, 0, 3, 1, 3, 0, 0 vmem btag: 56, 0, 867, 624, 1094, 11, 0 VM OBJECT: 256, 0, 3634, 2156,253463924, 0, 0 RADIX NODE: 144, 0, 8017, 5915,716370226, 0, 0 MAP: 240, 0, 3, 61, 3, 0, 0 KMAP ENTRY: 120, 0, 13, 86, 14, 0, 0 MAP ENTRY: 120, 0, 5241, 7035,2263377409, 0, 0 VMSPACE: 2560, 0, 57, 30,10984762, 0, 0 fakepg: 104, 0, 1, 151, 1, 0, 0 64 pcpu: 8, 0, 5073, 2095, 34172, 0, 0 mt_stats_zone: 64, 0, 500, 76, 500, 0, 0 mt_zone: 24, 0, 500, 335, 500, 0, 0 16: 16, 0, 1938, 823,78830492, 0, 0 32: 32, 0, 2455, 1045,54857778, 0, 0 64: 64, 0, 491731, 301,109581451, 0, 0 128: 128, 0, 1962118, 182,96462269, 0, 0 256: 256, 0, 489866, 79,77600913, 0, 0 512: 512, 0, 426, 198,11174057, 0, 0 1024: 1024, 0, 1612, 44,11834906, 0, 0 2048: 2048, 0, 295, 79,10466901, 0, 0 4096: 4096, 0, 17438, 13,14626646, 0, 0 8192: 8192, 0, 30, 2, 308457, 0, 0 16384: 16384, 0, 19, 2, 408909, 0, 0 32768: 32768, 0, 6, 0, 263, 0, 0 65536: 65536, 0, 15, 2, 6915281, 0, 0 SLEEPQUEUE: 80, 0, 217, 62, 217, 0, 0 kenv: 258, 0, 3, 72, 3640, 0, 0 Files: 80, 0, 205, 395,143610016, 0, 0 filedesc0: 1104, 0, 82, 29,10984786, 0, 0 rangeset pctrie nodes: 144, 0, 0, 0, 0, 0, 0 TURNSTILE: 136, 0, 217, 43, 217, 0, 0 rl_entry: 40, 0, 116, 384, 116, 0, 0 umtx pi: 96, 0, 0, 0, 0, 0, 0 umtx_shm: 88, 0, 0, 0, 0, 0, 0 PROC: 1328, 0, 81, 42,10984785, 0, 0 PGRP: 88, 0, 38, 412, 112692, 0, 0 THREAD: 1840, 0, 201, 15, 6198, 0, 0 cpuset: 104, 0, 11, 113, 11, 0, 0 domainset: 40, 0, 0, 0, 0, 0, 0 audit_record: 1280, 0, 0, 0, 0, 0, 0 mbuf_packet: 256, 383385, 0, 759,30556029, 0, 0 mbuf: 256, 383385, 8193, 768,263857330, 0, 0 mbuf_cluster: 2048, 59902, 759, 7, 150995, 0, 0 mbuf_jumbo_page: 4096, 29951, 0, 4, 55790, 0, 0 mbuf_jumbo_9k: 9216, 8874, 0, 0, 0, 0, 0 mbuf_jumbo_16k: 16384, 4991, 0, 0, 0, 0, 0 epoch_record pcpu: 256, 0, 4, 12, 4, 0, 0 NetGraph items: 72, 4123, 0, 279, 29063, 0, 0 NetGraph data items: 72, 4123, 0, 0, 1, 0, 0 DMAR_MAP_ENTRY: 120, 0, 0, 0, 0, 0, 0 ttyinq: 160, 0, 180, 20, 375, 0, 0 ttyoutq: 256, 0, 95, 40, 198, 0, 0 FPU_save_area: 512, 0, 0, 0, 0, 0, 0 g_bio: 376, 0, 0, 350,27462740, 0, 0 linux_dma_pctrie: 144, 0, 0, 0, 0, 0, 0 linux_dma_object: 24, 0, 0, 0, 0, 0, 0 cryptop: 128, 0, 0, 0, 0, 0, 0 cryptodesc: 120, 0, 0, 0, 0, 0, 0 crypto_session: 32, 0, 0, 0, 0, 0, 0 vtnet_tx_hdr: 24, 0, 0, 0, 0, 0, 0 VNODE: 480, 0, 2225, 71, 82458, 0, 0 VNODEPOLL: 120, 0, 0, 0, 0, 0, 0 BUF TRIE: 144, 0, 563, 6268, 4618013, 0, 0 NAMEI: 1024, 0, 0, 40,212755708, 0, 0 rentr: 24, 0, 0, 0, 966, 0, 0 S VFS Cache: 108, 0, 2519, 316, 805596, 0, 0 STS VFS Cache: 148, 0, 0, 0, 0, 0, 0 L VFS Cache: 328, 0, 20, 64, 24777, 0, 0 LTS VFS Cache: 368, 0, 0, 0, 0, 0, 0 TMPFS dirent: 64, 0, 41, 393, 18729, 0, 0 TMPFS node: 232, 0, 42, 94, 18730, 0, 0 NCLNODE: 608, 0, 0, 0, 0, 0, 0 DIRHASH: 1024, 0, 31, 17, 890, 0, 0 Mountpoints: 2744, 0, 4, 5, 10, 0, 0 AIO: 208, 0, 0, 0, 0, 0, 0 AIOP: 32, 0, 0, 0, 0, 0, 0 AIOCB: 752, 0, 0, 0, 0, 0, 0 AIOLIO: 280, 0, 0, 0, 0, 0, 0 pipe: 760, 0, 12, 43, 9800538, 0, 0 procdesc: 136, 0, 0, 0, 0, 0, 0 ksiginfo: 112, 0, 107, 383, 4736160, 0, 0 itimer: 352, 0, 0, 0, 0, 0, 0 ng_pipe: 64, 0, 0, 0, 0, 0, 0 KNOTE: 160, 0, 30, 195,34096706, 0, 0 socket: 872, 30804, 80, 272, 1250903, 0, 0 IPsec SA lft_c: 16, 0, 0, 0, 0, 0, 0 unpcb: 256, 30810, 42, 138, 431749, 0, 0 ipq: 56, 1917, 0, 0, 0, 0, 0 udp_inpcb: 488, 30808, 21, 91, 631572, 0, 0 udpcb: 32, 30875, 21, 604, 631572, 0, 0 tcp_inpcb: 488, 30808, 10, 62, 76559, 0, 0 tcpcb: 984, 30804, 10, 30, 76559, 0, 0 tcptw: 88, 6165, 0, 270, 21380, 0, 0 syncache: 168, 15364, 0, 138, 47481, 0, 0 hostcache: 96, 15375, 7, 34, 355, 0, 0 sackhole: 32, 0, 0, 375, 41, 0, 0 tfo: 4, 0, 0, 0, 0, 0, 0 tfo_ccache_entries: 80, 0, 0, 0, 0, 0, 0 tcpreass: 48, 3818, 0, 0, 26, 0, 0 tcp_log: 400, 5000000, 0, 0, 0, 0, 0 tcp_log_bucket: 144, 0, 0, 0, 0, 0, 0 tcp_log_node: 120, 0, 0, 0, 0, 0, 0 sctp_ep: 1280, 30804, 0, 0, 0, 0, 0 sctp_asoc: 2288, 40000, 0, 0, 0, 0, 0 sctp_laddr: 48, 80012, 0, 0, 19, 0, 0 sctp_raddr: 736, 80000, 0, 0, 0, 0, 0 sctp_chunk: 152, 400010, 0, 0, 0, 0, 0 sctp_readq: 152, 400010, 0, 0, 0, 0, 0 sctp_stream_msg_out: 112, 400015, 0, 0, 0, 0, 0 sctp_asconf: 40, 400000, 0, 0, 0, 0, 0 sctp_asconf_ack: 48, 400060, 0, 0, 0, 0, 0 udplite_inpcb: 488, 30808, 0, 0, 0, 0, 0 ripcb: 488, 30808, 5, 35, 29066, 0, 0 rtentry: 208, 0, 25, 70, 33, 0, 0 pf mtags: 48, 0, 0, 830,76849844, 0, 0 pf tags: 104, 0, 0, 0, 0, 0, 0 pf states: 320, 96000, 57, 135, 2129745, 0, 0 pf state keys: 88, 0, 57, 438, 2129745, 0, 0 pf source nodes: 136, 96019, 0, 0, 0, 0, 0 pf table entry counters: 64, 0, 0, 0, 0, 0, 0 pf table entries: 160, 400000, 132853, 12297, 785608, 6, 0 pf frags: 256, 0, 0, 0, 0, 0, 0 pf frag entries: 40, 5000, 0, 0, 0, 0, 0 pf state scrubs: 40, 0, 0, 0, 0, 0, 0 bridge_rtnode: 88, 0, 0, 0, 0, 0, 0 selfd: 64, 0, 158, 772,137686944, 0, 0 swpctrie: 144, 119853, 0, 0, 0, 0, 0 swblk: 136, 119828, 0, 0, 0, 0, 0 FFS inode: 160, 0, 2129, 196, 63670, 0, 0 FFS1 dinode: 128, 0, 0, 0, 0, 0, 0 FFS2 dinode: 256, 0, 2129, 136, 63670, 0, 0 -
@techniker_ctr said in Continuously increasing memory usage since the update to 2.6:
128: 128, 0, 1962118, 182,96462269, 0, 0
It looks like the '128' zone is the most likely culprit. Rather unhelpfully that's a generic zone used by the in-kernel 'malloc()' call.
Let's confirm that that's the problem first. Can you keep an eye on the vmstat output for a few hours to see if the used number (currently at 1962118) increases roughly in line with the growing memory use you see?
(Napkin math: we've got 1962118 allocations of 128 bytes, so about 240 MB. That seems to be about right for what we're looking for.)
Once that's confirmed the following running Dtrace script on the router may provide clues:
#!/usr/bin/env -S /usr/sbin/dtrace -x nolibs -s

struct uma_zone {
        uint32_t *mtx;
        char *uz_name;
};

fbt:kernel:uma_zalloc_arg:entry
/ ((struct uma_zone *)arg0)->uz_name == "128" /
{
        @num[stack()] = count();
}
Let that run for a few minutes and then terminate it with Ctrl+C. It'll likely produce a large amount of output, but with any luck the top user will give us a clue as to where that memory is going.
-
@kprovost I wasn't able to run the script for minutes, it crashed after ~20 sec with message "Killed". So attached the output for about 15 seconds: output.txt
The 128 zone increase during one day:
2022-05-22 08:48 :
128: 128, 0, 14566, 221, 812169, 0, 02022-05-22 17:19 :
128: 128, 0, 29424, 119, 1566853, 0, 0 -
@techniker_ctr
Okay, it's pretty safe to conclude we're indeed leaking from the 128 zone.The dtrace output doesn't immediately point to an obvious suspect, but having looked through it I think this is where the problem is:
          kernel`malloc+0x72
          kernel`nvpair_create_number+0x3f
          kernel`nvlist_add_number+0x26
          kernel`pf_get_syncookies+0xa2
          kernel`pfioctl+0x2bd6
          kernel`devfs_ioctl+0xb0
          kernel`VOP_IOCTL_APV+0x7b
          kernel`vn_ioctl+0x16c
          kernel`devfs_ioctl_f+0x1e
          kernel`kern_ioctl+0x2b7
          kernel`sys_ioctl+0x101
          kernel`amd64_syscall+0x387
          kernel`0xffffffff8135af6e
            4
There's nothing there to distinguish it from some of the other calls, but 2.6 does not have this commit: https://github.com/pfsense/FreeBSD-src/commit/410b11b25bdf39be3a73003ae5e5fadd9e3497fd
That fixes a memory leak in that code path, and pfsense ends up calling that regularly to obtain unrelated counters.I expect you to be able to confirm this by running
pfctl -si -vin a loop. That should leak memory quickly.The good news is that the fix is already included in the upcoming 22.05 (plus) release and will also be in future CE releases.
-
Looks like it's already in 2.7 snapshots too if you're able to test one.
-
@kprovost said in Continuously increasing memory usage since the update to 2.6:
The good news is that the fix is already included in the upcoming 22.05 (plus) release and will also be in future CE releases.
Dumb Question: is there a command to release that memory on a running system? (I think no)
-
@fireodo There is not, no.
That's sort of why we call it 'leaked' memory. It's gone (at least until the system is rebooted). If this were a user space leak you could restart the application to reclaim the memory, but as it's leaking from the kernel you have to restart the kernel (i.e. reboot).
-
@kprovost said in Continuously increasing memory usage since the update to 2.6:
It's gone (at least until the system is rebooted).
Understood. Thank you!
BTW: I can also confirm this as I made myself researches in this matter on my Lab machine. (Following the instructions in this thread)Best regards,
fireodo -
 F fireodo referenced this topic on
-
F fireodo referenced this topic on
-
@fireodo Good day, this problem was solved? I have the same problem and I have not managed to solve it. can help me please