Any known issues with HAproxy on 2.5.2?
-
After trying to figure out where a problem was coming from, we finally decided to look at the firewall .
Every day, folks complain that they cannot reach the application, claiming that they get timeouts and browser errors saying it cannot reach the remote site.Today, I decided to use a bunch of web site testing sites to see if any of them would complain as I'd used TOR many times with no obvious problem. Sure enough, 5 of the 10 I tried said they could not reach the site.
This made no sense since the site was up, we were using it, we knew nothing was wrong with any of the three servers behind the firewall.
I decided to disable the haproxy and use just one rule to one of the application servers and boom, the sites that could not reach before worked fine this time. I re-enabled the haproxy and sure enough, I'd get web site missing errors.
Now I've left it off and I've not seen a single problem since then so wondering if there are any known issues with haproxy on this version of pfsense.
I cannot update to 2.6.0 because, well, I don't know why. It says update available but it's never available so I give up since I'm nervous of the reboot down time anyhow.
So, anyone have any thoughts on this or hear of anyone else experiencing such problems?
-
@lewis said in Any known issues with HAproxy on 2.5.2?:
I cannot update to 2.6.0 because, well, I don't know why. It says update available but it's never available so I give up since I'm nervous of the reboot down time anyhow.
Not understanding why you cannot upgrade and it's the first thing most would recommend as starting point to resolve your issue...you can upgrade at 3:am Saturday morning when no one is using applications. Some logs, screenshots would help in assist in identifying your problem.
-
No, I'm not aware of any specific issue with HAProxy in 2.5.2.
Are there any errors shown in the HAProxy logs?Are you able to replicate the failure reliably? Is it the same test that fails each time?
How does it fail when you try to update to 2.6?
Steve
-
Sure, upgrading would be the first thing I'd do if I could.
In terms of when, we have non stop, 24/7 data coming in, minutes down can lose data so it's not as simple as just going for it.
We are in the middle of a hardware change over too so don't have the redundancy we usually have at the moment.
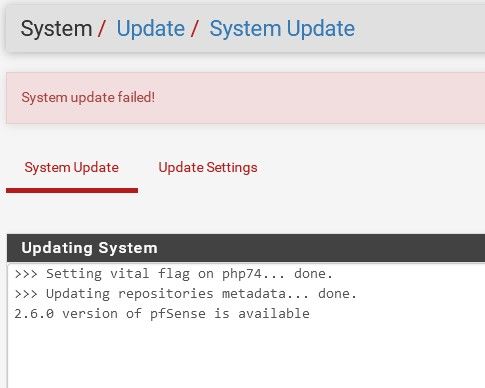
Also, maybe you didn't notice the part where I said it won't upgrade anyhow. It says there's an upgrade and I've tried to do it but it just says upgrade failed.
I go to 'Confirmation Required to update pfSense system' and I confirm, 2.5.2 to 2.6.0. I click on confirm and it says it's starting.
Then this shows up.
In terms of haproxy, I've not had the chance to look at the logs, it was panic city trying to figure out what was going on each time it happened. At first, I thought it had to be something I've messed up in the configuration but I'm not using any special config, very basic.
When I enable the proxy, it doesn't take long before we see the site go missing and we've heard it from many people using the site. Yesterday was the worse and most interesting since I went to sites on the Internet that test your web site's certs, headers, things like that and many of the 10 or so I tried could not even find the site.
Then I disabled the proxy and re-tried those same sites and now they could find the service.
Disabling btw means creating two new rules for ports 80/443 to enable testing to just one of the web servers and the haproxy rule disabled.
-
Hmm, well if you can reliably recreate the issue then I would initially be looking at states in the firewall(s) to be sure traffic is arriving from the test clients.
I have no reason to think upgrading will help here but obviously upgrading should work so the first thing I would do is at the command line run
pkg -d update. If that returns without an error I would try upgrading from the console menu option 13. Both those will give you a lot more debug info.Steve
-
Sure, I can look at that. I assume I'm given options to continue or not before committing.
I didn't look at the states so guess I need to do that next.
-
Yes, for upgrading from the console you are asked if you want to continue before the upgrade happens.
The pkg update runs immediately but does do anything beyond updating the list.
[2.5.2-RELEASE][admin@cedev-6.stevew.lan]/root: pkg -d update
DBG(1)[63743]> pkg initialized
Updating pfSense-core repository catalogue...
DBG(1)[63743]> PkgRepo: verifying update for pfSense-core
DBG(1)[63743]> Pkgrepo, begin update of '/var/db/pkg/repo-pfSense-core.sqlite'
DBG(1)[63743]> Request to fetch pkg+https://packages.netgate.com/pfSense_v2_6_0_amd64-core/meta.conf
DBG(1)[63743]> opening libfetch fetcher
DBG(1)[63743]> Fetch > libfetch: connecting
DBG(1)[63743]> Fetch: fetching from: https://pkg01-atx.netgate.com/pfSense_v2_6_0_amd64-core/meta.conf with opts "i"
DBG(1)[63743]> Fetch: fetcher chosen: https
DBG(1)[63743]> Request to fetch pkg+https://packages.netgate.com/pfSense_v2_6_0_amd64-core/packagesite.pkg
DBG(1)[63743]> opening libfetch fetcher
DBG(1)[63743]> Fetch > libfetch: connecting
DBG(1)[63743]> Fetch: fetching from: https://pkg01-atx.netgate.com/pfSense_v2_6_0_amd64-core/packagesite.pkg with opts "i"
DBG(1)[63743]> Fetch: fetcher chosen: https
DBG(1)[63743]> Request to fetch pkg+https://packages.netgate.com/pfSense_v2_6_0_amd64-core/packagesite.txz
DBG(1)[63743]> opening libfetch fetcher
DBG(1)[63743]> Fetch > libfetch: connecting
DBG(1)[63743]> Fetch: fetching from: https://pkg01-atx.netgate.com/pfSense_v2_6_0_amd64-core/packagesite.txz with opts "i"
DBG(1)[63743]> Fetch: fetcher chosen: https
pfSense-core repository is up to date.
Updating pfSense repository catalogue...
DBG(1)[63743]> PkgRepo: verifying update for pfSense
DBG(1)[63743]> Pkgrepo, begin update of '/var/db/pkg/repo-pfSense.sqlite'
DBG(1)[63743]> Request to fetch pkg+https://packages.netgate.com/pfSense_v2_6_0_amd64-pfSense_v2_6_0/meta.conf
DBG(1)[63743]> opening libfetch fetcher
DBG(1)[63743]> Fetch > libfetch: connecting
DBG(1)[63743]> Fetch: fetching from: https://pkg00-atx.netgate.com/pfSense_v2_6_0_amd64-pfSense_v2_6_0/meta.conf with opts "i"
DBG(1)[63743]> Fetch: fetcher chosen: https
DBG(1)[63743]> Request to fetch pkg+https://packages.netgate.com/pfSense_v2_6_0_amd64-pfSense_v2_6_0/packagesite.pkg
DBG(1)[63743]> opening libfetch fetcher
DBG(1)[63743]> Fetch > libfetch: connecting
DBG(1)[63743]> Fetch: fetching from: https://pkg00-atx.netgate.com/pfSense_v2_6_0_amd64-pfSense_v2_6_0/packagesite.pkg with opts "i"
DBG(1)[63743]> Fetch: fetcher chosen: https
DBG(1)[63743]> Request to fetch pkg+https://packages.netgate.com/pfSense_v2_6_0_amd64-pfSense_v2_6_0/packagesite.txz
DBG(1)[63743]> opening libfetch fetcher
DBG(1)[63743]> Fetch > libfetch: connecting
DBG(1)[63743]> Fetch: fetching from: https://pkg00-atx.netgate.com/pfSense_v2_6_0_amd64-pfSense_v2_6_0/packagesite.txz with opts "i"
DBG(1)[63743]> Fetch: fetcher chosen: https
pfSense repository is up to date.
All repositories are up to date.
Steve
-
This post is deleted! -
This post is deleted! -
Nice, I'll check that out later then. It's never a problem when it's a vm as they are so fast to reboot but enterprise hardware, go get a coffee.
Update
Strange, it updated just fine on two others that were 2.5.2 but this one I mention, nothing. I've not tried from the cli yet, trying to pick the right time.Update
The only thing I notice is that one of the 2.6.0 is now showing memory usage of 40% on an almost no traffic network that usually shows 2-3% usage.I know there was a problem with the previous version where it would use up and not release memory and that was related to ipsec but I don't have it enabled on this config, or any for that matter.
-
40% of how much? With HAProxy running?
-
This one has only 4GB in it because it's very low traffic and on a 50Mbps connection. Maybe I never noticed it was at 40% but I think it would have gotten my attention.
-
You can check the process list in Diag > System Activity to see if any one thing is using it.
If not and it is not actually exhausted it's probably not an issue.
Steve
-
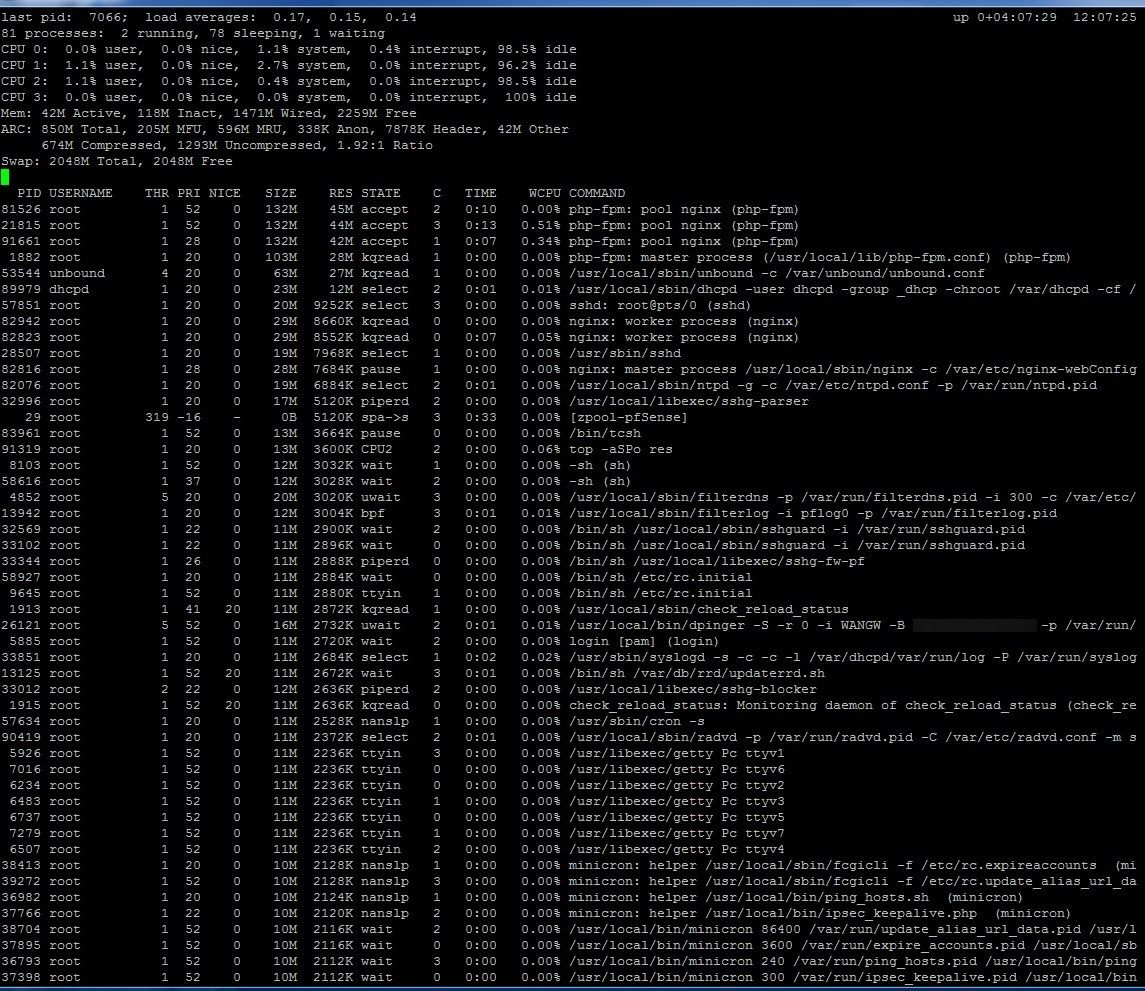
Nothing really obvious other than this;
2275 root 20 0 9988K 1368K select 1 0:00 0.00% /sbin/devd -q -f /etc/pfSense-devd.conf
-
Can we see the actual usage screen? 1.4MB is nothing, something must be using more than that.
-
Do you mean the dashboard or all of the processes?
-
The processes. So for example the output of
top -aSPo resafter a few cycles, like:last pid: 79792; load averages: 0.31, 0.35, 0.30 up 1+05:39:48 19:49:48 148 processes: 2 running, 145 sleeping, 1 waiting CPU 0: 0.0% user, 0.0% nice, 0.8% system, 0.0% interrupt, 99.2% idle CPU 1: 0.0% user, 0.0% nice, 0.4% system, 1.2% interrupt, 98.4% idle Mem: 97M Active, 717M Inact, 655M Wired, 1840M Free ARC: 431M Total, 120M MFU, 289M MRU, 32K Anon, 3266K Header, 19M Other 354M Compressed, 740M Uncompressed, 2.09:1 Ratio PID USERNAME THR PRI NICE SIZE RES STATE C TIME WCPU COMMAND 95987 root 2 20 0 417M 373M bpf 1 5:55 0.12% /usr/local/bin/snort -R _28847 -D -q --suppress-config-lo 48404 root 6 52 0 113M 86M kqread 0 0:00 0.00% /usr/local/sbin/radiusd 42053 root 1 52 0 140M 48M accept 0 1:16 0.00% php-fpm: pool nginx (php-fpm) 1262 root 1 52 0 140M 48M accept 1 1:03 0.00% php-fpm: pool nginx (php-fpm) 12485 root 1 52 0 141M 48M accept 1 1:14 0.00% php-fpm: pool nginx (php-fpm) 1261 root 1 52 0 140M 47M accept 0 1:43 0.00% php-fpm: pool nginx (php-fpm) 1466 root 1 20 0 141M 47M accept 1 1:06 0.00% php-fpm: pool nginx (php-fpm) 81073 squid 1 20 0 105M 37M kqread 1 4:17 0.03% (squid-1) --kid squid-1 -f /usr/local/etc/squid/squid.con 1260 root 1 20 0 100M 26M kqread 0 0:05 0.01% php-fpm: master process (/usr/local/lib/php-fpm.conf) (ph 39411 unbound 2 52 0 40M 20M kqread 1 0:00 0.00% /usr/local/sbin/unbound -c /var/unbound/unbound.conf 80523 squid 1 20 0 79M 19M wait 0 0:00 0.00% /usr/local/sbin/squid -f /usr/local/etc/squid/squid.conf 93560 root 17 52 0 50M 17M sigwai 1 0:12 0.00% /usr/local/libexec/ipsec/charon --use-syslog 44082 www 1 20 0 26M 14M kqread 1 0:01 0.00% /usr/local/sbin/haproxy -f /var/etc/haproxy/haproxy.cfg - 51992 root 10 20 0 65M 12M select 1 0:13 0.00% /usr/local/sbin/zebra -d 63253 dhcpd 1 20 0 22M 12M select 0 0:20 0.02% /usr/local/sbin/dhcpd -user dhcpd -group _dhcp -chroot /v 53603 root 4 20 0 33M 10M select 0 0:06 0.00% /usr/local/sbin/bgpd -d 32357 root 2 20 0 25M 9792K kqread 0 0:00 0.00% /usr/local/sbin/syslog-ng -p /var/run/syslog-ng.pid 23079 root 1 20 0 19M 9104K select 0 0:00 0.02% sshd: admin@pts/0 (sshd) 53811 root 1 20 0 28M 8480K kqread 1 0:05 0.00% nginx: worker process (nginx) 53681 root 1 20 0 28M 8312K kqread 0 0:02 0.00% nginx: worker process (nginx) 32255 root 1 52 0 18M 8220K wait 0 0:00 0.00% /usr/local/sbin/syslog-ng -p /var/run/syslog-ng.pid 25756 squid 1 20 0 17M 8084K select 1 0:11 0.02% (pinger) (pinger) 57293 squid 1 20 0 17M 8084K select 0 0:10 0.02% (pinger) (pinger) 97532 squid 1 20 0 17M 8084K select 1 0:11 0.02% (pinger) (pinger) -
That's what I thought but wasn't sure :).
Nothing too unusual.
I never noticed that before, 42M active, 118M Inact, 1471M Wired.
Is the system holding some memory in some sort of buffer or something?I've never seen that on Centos or other flavors I've worked with.
-
Mmm, so just wired memory from the kernel (probably).
It's not an issue as far as I know. If the actual free memory runs low the kernel will start releasing wired memory. It is different behaviour to 2.5.2 though.Steve
-
Sorry it took so long to get back to this but there is definitely something wrong with haproxy, at least on our device.
For the past while, we've been testing everything possible inside our network thinking something between the web connections, the application and the database must be wrong.
After an insane amount of hours troubleshooting, we could simply find nothing what so ever wrong with the application. The only clue was that clients were not communicating at the intervals they are set to.Eventually, we decided that maybe it's the Internet. Maybe because of the Ukraine war and lots of extra world wide hacking, maybe governments are filtering the net so much that it's caused some latency.
Yes, we started thinking it must be the Internet! :).
Then something dawned on me tonight after spending the entire day on this again. I remembered that I took haproxy out of the mix (as posted above) and things got way better there. Users are no longer getting gateway timeouts. I've been monitoring the logs since then.
This evening, I decided to take this other set of servers off haproxy, put just one online and give traffic direct access. Guess what? The timing is now almost dead on, no longer random and no more missing connections.
All data that is supposed to come in, is coming in, no missing data. It's haproxy causing the loss somehow.Here is a snip of us watching the logs and everything else a while ago. See the difference in timing? I'm only showing a snip but before haproxy was taken out, this client kept missing sending data, now it's dead on.
With load balancer
# tail -f /var/log/httpd/access_log | grep "1.1.1.1"
www.domain.com 1.1.1.1 - - [12/May/2022:20:22:10 -0700] "POST /app/test.php HTTP/1.1" 200 199351 747 "-" "curl/7.43.0"
www.domain.com 1.1.1.1 - - [12/May/2022:20:22:40 -0700] "POST /app/test.php HTTP/1.1" 200 212418 747 "-" "curl/7.43.0"
www.domain.com 1.1.1.1 - - [12/May/2022:20:23:50 -0700] "POST /app/test.php HTTP/1.1" 200 178076 747 "-" "curl/7.43.0"
www.domain.com 1.1.1.1 - - [12/May/2022:20:24:21 -0700] "POST /app/test.php HTTP/1.1" 200 181307 747 "-" "curl/7.43.0"
www.domain.com 1.1.1.1 - - [12/May/2022:20:24:32 -0700] "POST /app/test.php HTTP/1.1" 200 193764 747 "-" "curl/7.43.0"
www.domain.com 1.1.1.1 - - [12/May/2022:20:24:36 -0700] "POST /app/test.php HTTP/1.1" 200 252216 1 "-" "curl/7.43.0"
www.domain.com 1.1.1.1 - - [12/May/2022:20:24:41 -0700] "POST /app/test.php HTTP/1.1" 200 230704 747 "-" "curl/7.43.0"
www.domain.com 1.1.1.1 - - [12/May/2022:20:25:10 -0700] "POST /app/test.php HTTP/1.1" 200 175718 747 "-" "curl/7.43.0"
www.domain.com 1.1.1.1 - - [12/May/2022:20:25:21 -0700] "POST /app/test.php HTTP/1.1" 200 255809 747 "-" "curl/7.43.0"
www.domain.com 1.1.1.1 - - [12/May/2022:20:25:31 -0700] "POST /app/test.php HTTP/1.1" 200 217827 747 "-" "curl/7.43.0"
www.domain.com 1.1.1.1 - - [12/May/2022:20:26:19 -0700] "POST /app/test.php HTTP/1.1" 200 272213 1 "-" "curl/7.43.0"

Without load balancer
# tail -f /var/log/httpd/access_log | grep "1.1.1.1"
www.domain.com 1.1.1.1 - - [12/May/2022:21:11:21 -0700] "POST /app/test.php HTTP/1.1" 200 580819 747 "-" "curl/7.43.0"
www.domain.com 1.1.1.1 - - [12/May/2022:21:11:31 -0700] "POST /app/test.php HTTP/1.1" 200 430671 747 "-" "curl/7.43.0"
www.domain.com 1.1.1.1 - - [12/May/2022:21:11:41 -0700] "POST /app/test.php HTTP/1.1" 200 550884 747 "-" "curl/7.43.0"
www.domain.com 1.1.1.1 - - [12/May/2022:21:11:51 -0700] "POST /app/test.php HTTP/1.1" 200 564128 747 "-" "curl/7.43.0"
www.domain.com 1.1.1.1 - - [12/May/2022:21:12:01 -0700] "POST /app/test.php HTTP/1.1" 200 418494 747 "-" "curl/7.43.0"
www.domain.com 1.1.1.1 - - [12/May/2022:21:12:06 -0700] "POST /app/test.php HTTP/1.1" 200 303744 1 "-" "curl/7.43.0"
www.domain.com 1.1.1.1 - - [12/May/2022:21:12:11 -0700] "POST /app/test.php HTTP/1.1" 200 364427 747 "-" "curl/7.43.0"
www.domain.com 1.1.1.1 - - [12/May/2022:21:12:20 -0700] "POST /app/test.php HTTP/1.1" 200 285843 747 "-" "curl/7.43.0"
www.domain.com 1.1.1.1 - - [12/May/2022:21:12:30 -0700] "POST /app/test.php HTTP/1.1" 200 234948 747 "-" "curl/7.43.0"
www.domain.com 1.1.1.1 - - [12/May/2022:21:12:37 -0700] "POST /app/test.php HTTP/1.1" 200 310208 1 "-" "curl/7.43.0"
www.domain.com 1.1.1.1 - - [12/May/2022:21:12:40 -0700] "POST /app/test.php HTTP/1.1" 200 182248 747 "-" "curl/7.43.0"
www.domain.com 1.1.1.1 - - [12/May/2022:21:12:51 -0700] "POST /app/test.php HTTP/1.1" 200 381602 747 "-" "curl/7.43.0"
www.domain.com 1.1.1.1 - - [12/May/2022:21:13:00 -0700] "POST /app/test.php HTTP/1.1" 200 246661 747 "-" "curl/7.43.0"
www.domain.com 1.1.1.1 - - [12/May/2022:21:13:05 -0700] "POST /app/test.php HTTP/1.1" 200 258953 1 "-" "curl/7.43.0"
www.domain.com 1.1.1.1 - - [12/May/2022:21:13:10 -0700] "POST /app/test.php HTTP/1.1" 200 225073 747 "-" "curl/7.43.0"
www.domain.com 1.1.1.1 - - [12/May/2022:21:13:20 -0700] "POST /app/test.php HTTP/1.1" 200 185570 747 "-" "curl/7.43.0"
www.domain.com 1.1.1.1 - - [12/May/2022:21:13:30 -0700] "POST /app/test.php HTTP/1.1" 200 296611 747 "-" "curl/7.43.0"
www.domain.com 1.1.1.1 - - [12/May/2022:21:13:40 -0700] "POST /app/test.php HTTP/1.1" 200 259110 747 "-" "curl/7.43.0"
www.domain.com 1.1.1.1 - - [12/May/2022:21:13:50 -0700] "POST /app/test.php HTTP/1.1" 200 210109 747 "-" "curl/7.43.0"
www.domain.com 1.1.1.1 - - [12/May/2022:21:14:01 -0700] "POST /app/test.php HTTP/1.1" 200 392396 747 "-" "curl/7.43.0"