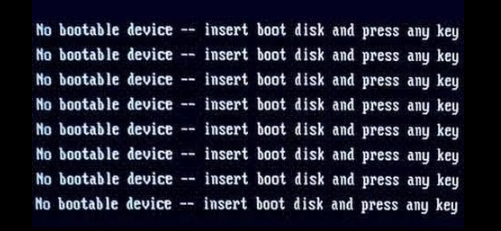
The firewall has encountered an error Diagnostics Crash Reporter
-
pfSense has detected a crash report or programming bug.
Good day!
I'm having this error today
How do troubleshoot this kind of error? and solution need to address
Click Here for more information.
Thanks,
-
Two very similar back traces there:
db:0:kdb.enter.default>  bt
Tracing pid 1 tid 100002 td 0xfffff80005325740
kdb_enter() at kdb_enter+0x37/frame 0xfffffe003e131380
vpanic() at vpanic+0x197/frame 0xfffffe003e1313d0
panic() at panic+0x43/frame 0xfffffe003e131430
vm_fault() at vm_fault+0x24f2/frame 0xfffffe003e131580
vm_fault_trap() at vm_fault_trap+0x60/frame 0xfffffe003e1315c0
trap_pfault() at trap_pfault+0x19c/frame 0xfffffe003e131610
trap() at trap+0x286/frame 0xfffffe003e131720
calltrap() at calltrap+0x8/frame 0xfffffe003e131720
--- trap 0xc, rip = 0xffffffff83d92840, rsp = 0xfffffe003e1317f8, rbp = 0xfffffe003e131970 ---
_end() at 0xffffffff83d92840/frame 0xfffffe003e131970
sys_reboot() at sys_reboot+0x29c/frame 0xfffffe003e1319c0
amd64_syscall() at amd64_syscall+0x387/frame 0xfffffe003e131af0
fast_syscall_common() at fast_syscall_common+0xf8/frame 0xfffffe003e131af0
--- syscall (55, FreeBSD ELF64, sys_reboot), rip = 0x23602a, rsp = 0x7fffffffe3a8, rbp = 0x7fffffffe7d0 ---
db:0:kdb.enter.default> bt Tracing pid 1 tid 100002 td 0xfffff80005325740 kdb_enter() at kdb_enter+0x37/frame 0xfffffe003e131380 vpanic() at vpanic+0x197/frame 0xfffffe003e1313d0 panic() at panic+0x43/frame 0xfffffe003e131430 vm_fault() at vm_fault+0x24f2/frame 0xfffffe003e131580 vm_fault_trap() at vm_fault_trap+0x60/frame 0xfffffe003e1315c0 trap_pfault() at trap_pfault+0x19c/frame 0xfffffe003e131610 trap() at trap+0x286/frame 0xfffffe003e131720 calltrap() at calltrap+0x8/frame 0xfffffe003e131720 --- trap 0xc, rip = 0xffffffff83d9c840, rsp = 0xfffffe003e1317f8, rbp = 0xfffffe003e131970 --- .L.str() at 0xffffffff83d9c840/frame 0xfffffe003e131970 sys_reboot() at sys_reboot+0x29c/frame 0xfffffe003e1319c0 amd64_syscall() at amd64_syscall+0x387/frame 0xfffffe003e131af0 fast_syscall_common() at fast_syscall_common+0xf8/frame 0xfffffe003e131af0 --- syscall (55, FreeBSD ELF64, sys_reboot), rip = 0x23602a, rsp = 0x7fffffffe3a8, rbp = 0x7fffffffe7d0 ---Both appear to have been after issuing a shutdown but still trying to mount root:
<118>
<118>pfSense is now shutting down ...
<118>
<6>pflog0: promiscuous mode disabled
Trying to mount root from ufs:/dev/ufsid/62982c44b4dd6f1a [rw,noatime]...
panic: vm_fault: fault on nofault entry, addr: 0xffffffff83d92000
cpuid = 0
time = 1654411805
KDB: enter: panic
Which is odd. Is that how it appeared to you? The crash reports were shown after you had rebooted?
Steve
-
Hi Stephen, yes I currently using my PFSENSE for 4 years in my company this is my first time seeing an error message like this.
what Is the cause of this error?
-
No clear cause is shown. I've never seen that before. It appears to be trying to remount root after it's started shutting down.
Have you made any changes recently? Installed new packages etc?Steve
-
Good day, Stephen. My pfsense suddenly stopped working, and I received an error message.
I decided to get a new hard drive, install PFsense, attach the configuration file, and then restore the configuration.
and it works. Perhaps the hardware in the hard drives is failing?
Is that why I was given this warning?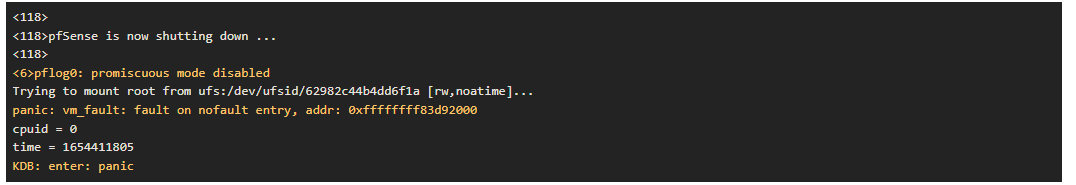
-
Potentially it could have been a failing disk causing that shutdown panic, yes. Certainly there is a problem with it if it disappeared from the BIOS entirely.
Steve