Anyrevo fanless appliance hitting >60 C, is this normal?
-
Hi, pfSense noob here. I have a fanless appliance from Anyrevo with N5105, 4-port i225, 8 GB RAM, 128 GB NVMe. After initial setup of pfSense CE 2.6, CPU temperature is never below 50 C and would reach upwards of 60 with just basic routing and firewalling. I turned on PowerD and it didn't make a difference. Same thing happened when I upgraded to Plus. I even got a kernel warnings about critical temperature being reached. Is this normal for pfSense? What else should I be looking at to tame the cpu temp? I'm worried about longevity and stability.
P.S. I don't get this with Untangle. With multiple NordVPN tunnels, WireGuard, IDS/IPS, etc. running, temperatures hover around 40 C and rarely reach 50 C on the same appliance. Do I take it that my appliance is just not optimized for pfSense/FreeBSD?
Thanks.
-
@bokolobs said in Anyrevo fanless appliance hitting >60 C, is this normal?:
Hi, pfSense noob here. I have a fanless appliance from Anyrevo with N5105, 4-port i225, 8 GB RAM, 128 GB NVMe. After initial setup of pfSense CE 2.6, CPU temperature is never below 50 C and would reach upwards of 60 with just basic routing and firewalling. I turned on PowerD and it didn't make a difference. Same thing happened when I upgraded to Plus. I even got a kernel warnings about critical temperature being reached. Is this normal for pfSense? What else should I be looking at to tame the cpu temp? I'm worried about longevity and stability.
P.S. I don't get this with Untangle. With multiple NordVPN tunnels, WireGuard, IDS/IPS, etc. running, temperatures hover around 40 C and rarely reach 50 C on the same appliance. Do I take it that my appliance is just not optimized for pfSense/FreeBSD?
Thanks.
First make sure your pfSense is configured like this:
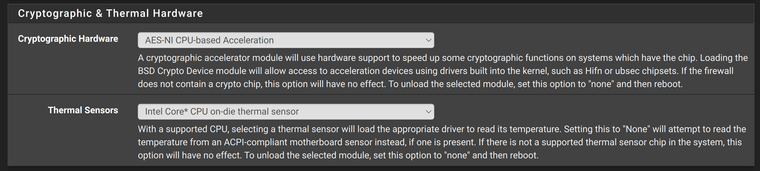
These settings are located in System / Advanced / Miscellaneous
Next, make sure that your CPU is not hitting 100% CPU usage. Log into pfSense box via SSH and start the Shell by pressing 8. Execute this command:
top -aYou will be able to see if your CPU is hitting 100% there, and if it does, tell us which process is doing that.
Btw, 60C is not a high temperature at all. And the fact you are not hitting those temps with Untangle means that Untangle is probably not utilizing your CPU as much as pfSense. pfSense is logging high temps only if they exceed 75C. This can be mitigated by going into BIOS of your pfSense box and disabling CPU Turbo function which will reduce the temps quite a bit. However, you will lose some performace.
Btw, Anyrevo are known for not being very well made. So keep that in mind as well.
-
@nimrod I've configured it this way. I sometimes hit > 75°C and get kernels warnings with my vanilla network setup (2 ISPs with WAN failover, 2 VLANs, 2 NordVPN tunnels, 2 WireGuard clients, pfBlockerNG).
@nimrod said in Anyrevo fanless appliance hitting >60 C, is this normal?:
Btw, 60C is not a high temperature at all. And the fact you are not hitting those temps with Untangle means that Untangle is probably not utilizing your CPU as much as pfSense. pfSense is logging high temps only if they exceed 75C. This can be mitigated by going into BIOS of your pfSense box and disabling CPU Turbo function which will reduce the temps quite a bit. However, you will lose some performace.
Btw, Anyrevo are known for not being very well made. So keep that in mind as well.So 60°C is normal? That seems high for routing and firewalling. I can't look at the top results right now since I already loaded my box with Untangle.
You might be right. But to be fair to Anyrevo, I don't see this heat issue with Untangle. With the same network setup as above plus Suricata and QoS (fq_codel), Untangle is running between 40-50°C with its java UVM using between 2-4% CPU. So I'm inclined to think that maybe my Anyrevo box is just not a good match with pfSense/FreeBSD rather than it not being well made. I'm just going to use Untangle for now. I'll give pfSense another go sometime.
Thanks for your input.
-
@bokolobs said in Anyrevo fanless appliance hitting >60 C, is this normal?:
@nimrod I've configured it this way. I sometimes hit > 75°C and get kernels warnings with my vanilla network setup (2 ISPs with WAN failover, 2 VLANs, 2 NordVPN tunnels, 2 WireGuard clients, pfBlockerNG).
@nimrod said in Anyrevo fanless appliance hitting >60 C, is this normal?:
Btw, 60C is not a high temperature at all. And the fact you are not hitting those temps with Untangle means that Untangle is probably not utilizing your CPU as much as pfSense. pfSense is logging high temps only if they exceed 75C. This can be mitigated by going into BIOS of your pfSense box and disabling CPU Turbo function which will reduce the temps quite a bit. However, you will lose some performace.
Btw, Anyrevo are known for not being very well made. So keep that in mind as well.So 60°C is normal? That seems high for routing and firewalling. I can't look at the top results right now since I already loaded my box with Untangle.
You might be right. But to be fair to Anyrevo, I don't see this heat issue with Untangle. With the same network setup as above plus Suricata and QoS (fq_codel), Untangle is running between 40-50°C with its java UVM using between 2-4% CPU. So I'm inclined to think that maybe my Anyrevo box is just not a good match with pfSense/FreeBSD rather than it not being well made. I'm just going to use Untangle for now. I'll give pfSense another go sometime.
Thanks for your input.
You said you are using pfBlockerNG, there is a known issue with pfBlockerNG and high CPU usage. Check this redmine post.
-
@nimrod Thanks for this info! I will try this soon. pfBlockerNG was the first package I installed after the pfSense wizard and the configuring the VLANs. I'll try pfSense without this package first. Thanks again.
-
Mmm, 60C at the core is not necessarily a problem. The maximum junction temp for that CPU is 105C in line with most mobile CPUs. Passively cooled CPUs always run hot.
If it's running hotter than Untangle then the loading is higher. Check the system activity.Steve
-
@stephenw10 Thanks. Will do and report back. Maybe you guys could enlighten me.
-
@stephenw10 BTW, does it make any difference if I update to the plus right after install? Or should I just stick with CE 2.6? I upgraded to Plus the first time around. Thanks.
-
There are some fixes in 22.05 that are not in 2.6 so upgrading to Plus will get your those. None that affect CPU usage that much though. The pfBlocker issue is in the package not the base.
Steve
-
@stephenw10 Got it! Thanks!
-
Hi again! Bit the bullet even though I still have a few days of Untangle trial. I installed pfSense last night. Upgraded to 22.05. Configured WAN Failover and 2 VLANs. Turned on AES-NI and Intel thermal sensors. Then left it as is overnight with 20 devices connected, I'm getting ~63 °C. I'm wondering: Is this normal and to be expected? Is there anything I need to tweak to optimize this? What conclusions can I get from these? Is my appliance not good enough for pfSense? Thanks!
Here's my top -a results:
last pid: 73822;  load averages:  0.07,  0.13,  0.13                                                                                                                                                                                                                                                                                                up 0+11:05:58  10:58:11
53 processes:  1 running, 52 sleeping
CPU:  0.0% user,  0.6% nice,  2.1% system,  0.0% interrupt, 97.3% idle
Mem: 40M Active, 120M Inact, 524M Wired, 6965M Free
ARC: 188M Total, 33M MFU, 149M MRU, 3546K Anon, 714K Header, 2821K Other
     54M Compressed, 135M Uncompressed, 2.48:1 Ratio
Swap: 1024M Total, 1024M Free

  PID USERNAME    THR PRI NICE   SIZE    RES STATE    C   TIME    WCPU COMMAND
45100 root          1  52   20    11M  2656K wait     1   0:03   0.25% /bin/sh /var/db/rrd/updaterrd.sh
92852 unbound       4  20    0    73M    41M kqread   0   0:11   0.06% /usr/local/sbin/unbound -c /var/unbound/unbound.conf
44672 root          1  20    0    13M  3572K CPU0     0   0:00   0.05% top -a
81015 root          5  27    0    11M  2620K uwait    3   0:07   0.02% /usr/local/bin/dpinger -S -r 0 -i WAN2_DHCP -B 10.210.192.17 -p /var/run/dpinger_WAN2_DHCP~10.210.192.17~10.210.192.1.pid -u /var/run/dpinger_WAN2_DHCP~10.210.192.17~10.210.192.1.sock -C /etc/rc.gateway_alarm -d 1 -s 500 -l 2000 -t 60000 -A 1000 -D 500 -L 20 10.210.192.1
80588 root          5  25    0    11M  2620K uwait    1   0:07   0.02% /usr/local/bin/dpinger -S -r 0 -i WAN_DHCP -B x.x.x.x -p /var/run/dpinger_WAN_DHCP~x.x.x.x~x.x.x.x.pid -u /var/run/dpinger_WAN_DHCP~x.x.x.x~x.x.x.x.sock -C /etc/rc.gateway_alarm -d 1 -s 500 -l 2000 -t 60000 -A 1000 -D 500 -L 20 x.x.x.x
 9921 dhcpd         1  20    0    23M    11M select   3   0:06   0.01% /usr/local/sbin/dhcpd -user dhcpd -group _dhcp -chroot /var/dhcpd -cf /etc/dhcpd.conf -pf /var/run/dhcpd.pid igc1 igc1.10 igc1.20
  382 root          1  20    0   103M    28M kqread   2   0:01   0.01% php-fpm: master process (/usr/local/lib/php-fpm.conf) (php-fpm)
39689 root          1  20    0    12M  3032K bpf      1   0:02   0.00% /usr/local/sbin/filterlog -i pflog0 -p /var/run/filterlog.pid
22623 root          1  20    0    20M  9480K select   3   0:00   0.00% sshd: root@pts/0 (sshd)
97451 root          1  20    0    19M  6892K select   1   0:02   0.00% /usr/local/sbin/ntpd -g -c /var/etc/ntpd.conf -p /var/run/ntpd.pid
  383 root          1  52    0   132M    43M accept   1   0:01   0.00% php-fpm: pool nginx (php-fpm)
  384 root          1  20    0   132M    43M accept   1   0:01   0.00% php-fpm: pool nginx (php-fpm)
83704 root          1  20    0    11M  2656K select   2   0:01   0.00% /usr/sbin/syslogd -s -c -c -l /var/dhcpd/var/run/log -P /var/run/syslog.pid -f /etc/syslog.conf
96810 root          1  20    0    11M  2508K nanslp   3   0:00   0.00% /usr/sbin/cron -s
98092 root          1  20    0    29M  9180K kqread   1   0:00   0.00% nginx: worker process (nginx)
98019 root          1  20    0    30M  9288K kqread   0   0:00   0.00% nginx: worker process (nginx)
  893 root          1  20    0  9980K  1376K select   1   0:00   0.00% /sbin/devd -q -f /etc/pfSense-devd.conf
26082 _dhcp         1  20    0    11M  2632K select   1   0:00   0.00% dhclient: igc0 (dhclient)
34451 _dhcp         1  20    0    11M  2636K select   1   0:00   0.00% dhclient: igc3 (dhclient)
85405 root          1  20    0    10M  2108K nanslp   0   0:00   0.00% minicron: helper /usr/local/bin/ping_hosts.sh  (minicron)
85952 root          1  22    0    10M  2108K nanslp   1   0:00   0.00% minicron: helper /usr/local/bin/ipsec_keepalive.php  (minicron)
30396 root          1  20    0    13M  3672K pause    1   0:00   0.00% /bin/tcsh
22837 root          1   4    0    11M  2528K select   2   0:00   0.00% dhclient: igc0 [priv] (dhclient)
49722 root          2  21    0    12M  2628K piperd   1   0:00   0.00% /usr/local/libexec/sshg-blocker
14929 root          1  52    0    11M  2700K wait     1   0:00   0.00% login [pam] (login)
23366 root          1  26    0    12M  3064K wait     3   0:00   0.00% -sh (sh)
  422 root          1  41   20    11M  2852K kqread   3   0:00   0.00% /usr/local/sbin/check_reload_status
15980 root          1  52    0    12M  3012K wait     1   0:00   0.00% -sh (sh)
20712 root          1  20    0    19M  8220K select   2   0:00   0.00% sshd: /usr/sbin/sshd [listener] 0 of 10-100 startups (sshd)
49325 root          1  23    0    11M  2880K wait     1   0:00   0.00% /bin/sh /usr/local/sbin/sshguard -i /var/run/sshguard.pid
24020 root          1  52    0    11M  2884K wait     0   0:00   0.00% /bin/sh /etc/rc.initial
18348 root          1  52    0    11M  2880K ttyin    3   0:00   0.00% /bin/sh /etc/rc.initial
30320 root          1  20    0    11M  2524K select   0   0:00   0.00% dhclient: igc3 [priv] (dhclient)
14956 root          1  52    0    11M  2220K ttyin    3   0:00   0.00% /usr/libexec/getty Pc ttyv1
15578 root          1  52    0    11M  2220K ttyin    2   0:00   0.00% /usr/libexec/getty Pc ttyv5
15227 root          1  52    0    11M  2220K ttyin    0   0:00   0.00% /usr/libexec/getty Pc ttyv2
15509 root          1  52    0    11M  2220K ttyin    2   0:00   0.00% /usr/libexec/getty Pc ttyv4
15444 root          1  52    0    11M  2220K ttyin    0   0:00   0.00% /usr/libexec/getty Pc ttyv3
15628 root          1  52    0    11M  2220K ttyin    3   0:00   0.00% /usr/libexec/getty Pc ttyv6
15905 root          1  52    0    11M  2220K ttyin    3   0:00   0.00% /usr/libexec/getty Pc ttyv7
86648 root          1  20    0    10M  2112K nanslp   2   0:00   0.00% minicron: helper /usr/local/sbin/fcgicli -f /etc/rc.expireaccounts  (minicron)
50242 root          1  26    0    11M  2868K piperd   3   0:00   0.00% /bin/sh /usr/local/libexec/sshg-fw-pf
49493 root          1  20    0    17M  5284K piperd   2   0:00   0.00% /usr/local/libexec/sshg-parser
49429 root          1  20    0    10M  2064K piperd   3   0:00   0.00% /bin/cat
97940 root          1  30    0    28M  7672K pause    1   0:00   0.00% nginx: master process /usr/local/sbin/nginx -c /var/etc/nginx-webConfigurator.conf (nginx)
73822 root          1  52   20    10M  2052K nanslp   0   0:00   0.00% sleep 60
86943 root          1  52    0    10M  2100K wait     0   0:00   0.00% /usr/local/bin/minicron 86400 /var/run/update_alias_url_data.pid /usr/local/sbin/fcgicli -f /etc/rc.update_alias_url_data
85505 root          1  52    0    10M  2100K wait     2   0:00   0.00% /usr/local/bin/minicron 300 /var/run/ipsec_keepalive.pid /usr/local/bin/ipsec_keepalive.php
86157 root          1  52    0    10M  2100K wait     3   0:00   0.00% /usr/local/bin/minicron 3600 /var/run/expire_accounts.pid /usr/local/sbin/fcgicli -f /etc/rc.expireaccounts
85072 root          1  52    0    10M  2096K wait     2   0:00   0.00% /usr/local/bin/minicron 240 /var/run/ping_hosts.pid /usr/local/bin/ping_hosts.sh
  424 root          1  52   20    11M  2620K kqread   3   0:00   0.00% check_reload_status: Monitoring daemon of check_reload_status (check_reload_status)
87215 root          1  52    0    10M  2112K nanslp   2   0:00   0.00% minicron: helper /usr/local/sbin/fcgicli -f /etc/rc.update_alias_url_data  (minicron)
49944 root          1  23    0    11M  2876K wait     2   0:00   0.00% /bin/sh /usr/local/sbin/sshguard -i /var/run/sshguard.pid
Temperature reading:
[22.05-RELEASE][root@pfSense.home.arpa]/var/log: sysctl -a | grep "dev.cpu.*.temperature"
dev.cpu.3.temperature: 63.0C
dev.cpu.2.temperature: 63.0C
dev.cpu.1.temperature: 63.0C
dev.cpu.0.temperature: 63.0C
Here is my system log file:
-
@bokolobs said in Anyrevo fanless appliance hitting >60 C, is this normal?:
Hi again! Bit the bullet even though I still have a few days of Untangle trial. I installed pfSense last night. Upgraded to 22.05. Configured WAN Failover and 2 VLANs. Turned on AES-NI and Intel thermal sensors. Then left it as is overnight with 20 devices connected, I'm getting ~63 °C. I'm wondering: Is this normal and to be expected? Is there anything I need to tweak to optimize this? What conclusions can I get from these? Is my appliance not good enough for pfSense? Thanks!
Here's my top -a results:
last pid: 73822;  load averages:  0.07,  0.13,  0.13                                                                                                                                                                                                                                                                                                up 0+11:05:58  10:58:11
53 processes:  1 running, 52 sleeping
CPU:  0.0% user,  0.6% nice,  2.1% system,  0.0% interrupt, 97.3% idle
Mem: 40M Active, 120M Inact, 524M Wired, 6965M Free
ARC: 188M Total, 33M MFU, 149M MRU, 3546K Anon, 714K Header, 2821K Other
     54M Compressed, 135M Uncompressed, 2.48:1 Ratio
Swap: 1024M Total, 1024M Free

  PID USERNAME    THR PRI NICE   SIZE    RES STATE    C   TIME    WCPU COMMAND
45100 root          1  52   20    11M  2656K wait     1   0:03   0.25% /bin/sh /var/db/rrd/updaterrd.sh
92852 unbound       4  20    0    73M    41M kqread   0   0:11   0.06% /usr/local/sbin/unbound -c /var/unbound/unbound.conf
44672 root          1  20    0    13M  3572K CPU0     0   0:00   0.05% top -a
81015 root          5  27    0    11M  2620K uwait    3   0:07   0.02% /usr/local/bin/dpinger -S -r 0 -i WAN2_DHCP -B 10.210.192.17 -p /var/run/dpinger_WAN2_DHCP~10.210.192.17~10.210.192.1.pid -u /var/run/dpinger_WAN2_DHCP~10.210.192.17~10.210.192.1.sock -C /etc/rc.gateway_alarm -d 1 -s 500 -l 2000 -t 60000 -A 1000 -D 500 -L 20 10.210.192.1
80588 root          5  25    0    11M  2620K uwait    1   0:07   0.02% /usr/local/bin/dpinger -S -r 0 -i WAN_DHCP -B x.x.x.x -p /var/run/dpinger_WAN_DHCP~x.x.x.x~x.x.x.x.pid -u /var/run/dpinger_WAN_DHCP~x.x.x.x~x.x.x.x.sock -C /etc/rc.gateway_alarm -d 1 -s 500 -l 2000 -t 60000 -A 1000 -D 500 -L 20 x.x.x.x
 9921 dhcpd         1  20    0    23M    11M select   3   0:06   0.01% /usr/local/sbin/dhcpd -user dhcpd -group _dhcp -chroot /var/dhcpd -cf /etc/dhcpd.conf -pf /var/run/dhcpd.pid igc1 igc1.10 igc1.20
  382 root          1  20    0   103M    28M kqread   2   0:01   0.01% php-fpm: master process (/usr/local/lib/php-fpm.conf) (php-fpm)
39689 root          1  20    0    12M  3032K bpf      1   0:02   0.00% /usr/local/sbin/filterlog -i pflog0 -p /var/run/filterlog.pid
22623 root          1  20    0    20M  9480K select   3   0:00   0.00% sshd: root@pts/0 (sshd)
97451 root          1  20    0    19M  6892K select   1   0:02   0.00% /usr/local/sbin/ntpd -g -c /var/etc/ntpd.conf -p /var/run/ntpd.pid
  383 root          1  52    0   132M    43M accept   1   0:01   0.00% php-fpm: pool nginx (php-fpm)
  384 root          1  20    0   132M    43M accept   1   0:01   0.00% php-fpm: pool nginx (php-fpm)
83704 root          1  20    0    11M  2656K select   2   0:01   0.00% /usr/sbin/syslogd -s -c -c -l /var/dhcpd/var/run/log -P /var/run/syslog.pid -f /etc/syslog.conf
96810 root          1  20    0    11M  2508K nanslp   3   0:00   0.00% /usr/sbin/cron -s
98092 root          1  20    0    29M  9180K kqread   1   0:00   0.00% nginx: worker process (nginx)
98019 root          1  20    0    30M  9288K kqread   0   0:00   0.00% nginx: worker process (nginx)
  893 root          1  20    0  9980K  1376K select   1   0:00   0.00% /sbin/devd -q -f /etc/pfSense-devd.conf
26082 _dhcp         1  20    0    11M  2632K select   1   0:00   0.00% dhclient: igc0 (dhclient)
34451 _dhcp         1  20    0    11M  2636K select   1   0:00   0.00% dhclient: igc3 (dhclient)
85405 root          1  20    0    10M  2108K nanslp   0   0:00   0.00% minicron: helper /usr/local/bin/ping_hosts.sh  (minicron)
85952 root          1  22    0    10M  2108K nanslp   1   0:00   0.00% minicron: helper /usr/local/bin/ipsec_keepalive.php  (minicron)
30396 root          1  20    0    13M  3672K pause    1   0:00   0.00% /bin/tcsh
22837 root          1   4    0    11M  2528K select   2   0:00   0.00% dhclient: igc0 [priv] (dhclient)
49722 root          2  21    0    12M  2628K piperd   1   0:00   0.00% /usr/local/libexec/sshg-blocker
14929 root          1  52    0    11M  2700K wait     1   0:00   0.00% login [pam] (login)
23366 root          1  26    0    12M  3064K wait     3   0:00   0.00% -sh (sh)
  422 root          1  41   20    11M  2852K kqread   3   0:00   0.00% /usr/local/sbin/check_reload_status
15980 root          1  52    0    12M  3012K wait     1   0:00   0.00% -sh (sh)
20712 root          1  20    0    19M  8220K select   2   0:00   0.00% sshd: /usr/sbin/sshd [listener] 0 of 10-100 startups (sshd)
49325 root          1  23    0    11M  2880K wait     1   0:00   0.00% /bin/sh /usr/local/sbin/sshguard -i /var/run/sshguard.pid
24020 root          1  52    0    11M  2884K wait     0   0:00   0.00% /bin/sh /etc/rc.initial
18348 root          1  52    0    11M  2880K ttyin    3   0:00   0.00% /bin/sh /etc/rc.initial
30320 root          1  20    0    11M  2524K select   0   0:00   0.00% dhclient: igc3 [priv] (dhclient)
14956 root          1  52    0    11M  2220K ttyin    3   0:00   0.00% /usr/libexec/getty Pc ttyv1
15578 root          1  52    0    11M  2220K ttyin    2   0:00   0.00% /usr/libexec/getty Pc ttyv5
15227 root          1  52    0    11M  2220K ttyin    0   0:00   0.00% /usr/libexec/getty Pc ttyv2
15509 root          1  52    0    11M  2220K ttyin    2   0:00   0.00% /usr/libexec/getty Pc ttyv4
15444 root          1  52    0    11M  2220K ttyin    0   0:00   0.00% /usr/libexec/getty Pc ttyv3
15628 root          1  52    0    11M  2220K ttyin    3   0:00   0.00% /usr/libexec/getty Pc ttyv6
15905 root          1  52    0    11M  2220K ttyin    3   0:00   0.00% /usr/libexec/getty Pc ttyv7
86648 root          1  20    0    10M  2112K nanslp   2   0:00   0.00% minicron: helper /usr/local/sbin/fcgicli -f /etc/rc.expireaccounts  (minicron)
50242 root          1  26    0    11M  2868K piperd   3   0:00   0.00% /bin/sh /usr/local/libexec/sshg-fw-pf
49493 root          1  20    0    17M  5284K piperd   2   0:00   0.00% /usr/local/libexec/sshg-parser
49429 root          1  20    0    10M  2064K piperd   3   0:00   0.00% /bin/cat
97940 root          1  30    0    28M  7672K pause    1   0:00   0.00% nginx: master process /usr/local/sbin/nginx -c /var/etc/nginx-webConfigurator.conf (nginx)
73822 root          1  52   20    10M  2052K nanslp   0   0:00   0.00% sleep 60
86943 root          1  52    0    10M  2100K wait     0   0:00   0.00% /usr/local/bin/minicron 86400 /var/run/update_alias_url_data.pid /usr/local/sbin/fcgicli -f /etc/rc.update_alias_url_data
85505 root          1  52    0    10M  2100K wait     2   0:00   0.00% /usr/local/bin/minicron 300 /var/run/ipsec_keepalive.pid /usr/local/bin/ipsec_keepalive.php
86157 root          1  52    0    10M  2100K wait     3   0:00   0.00% /usr/local/bin/minicron 3600 /var/run/expire_accounts.pid /usr/local/sbin/fcgicli -f /etc/rc.expireaccounts
85072 root          1  52    0    10M  2096K wait     2   0:00   0.00% /usr/local/bin/minicron 240 /var/run/ping_hosts.pid /usr/local/bin/ping_hosts.sh
  424 root          1  52   20    11M  2620K kqread   3   0:00   0.00% check_reload_status: Monitoring daemon of check_reload_status (check_reload_status)
87215 root          1  52    0    10M  2112K nanslp   2   0:00   0.00% minicron: helper /usr/local/sbin/fcgicli -f /etc/rc.update_alias_url_data  (minicron)
49944 root          1  23    0    11M  2876K wait     2   0:00   0.00% /bin/sh /usr/local/sbin/sshguard -i /var/run/sshguard.pid
Temperature reading:
[22.05-RELEASE][root@pfSense.home.arpa]/var/log: sysctl -a | grep "dev.cpu.*.temperature"
dev.cpu.3.temperature: 63.0C
dev.cpu.2.temperature: 63.0C
dev.cpu.1.temperature: 63.0C
dev.cpu.0.temperature: 63.0C
Here is my system log file:
Just running top -a command and posting results here is not going to help.
You need to start the command, and observe the CPU usage yourself for at least a minute. Make sure there are no processes that hit 100% when unit is idle. If the unit is hitting 63C under heavy traffic that is normal and ok.
If these temps are too high for you, as i said in previous post, you can go into BIOS of your Anyevo appliance and just disable Intel turbo boost technology. That will lower temperatures under load significantly.
Untangle and pfSense can not be compared in terms of CPU usage and temperatures. pfSense is FreeBSD based and it does network filtering in a completely different way than Untangle which is Linux based.
-
@nimrod Copy that. So far, no process has used 100% cpu. Closest was top -a itself (2.5%) and nginx at almost 10%. I've configured pfSense to match my requirements as much as possible. Temps are ranging from 54-65 °C. Although I can see the occasional 75 °C. I'm good with that. It looks like the main problem with my initial install was indeed the pfBlockerNG bug. Will refrain from installing that package until it has been updated.
@nimrod said in Anyrevo fanless appliance hitting >60 C, is this normal?:
If these temps are too high for you, as i said in previous post, you can go into BIOS of your Anyevo appliance and just disable Intel turbo boost technology. That will lower temperatures under load significantly.
Will keep this in mind.
Thanks so much!
-
I would also recommend using
top -HaSPto see all the processes. -
@bokolobs said in Anyrevo fanless appliance hitting >60 C, is this normal?:
@nimrod Copy that. So far, no process has used 100% cpu. Closest was top -a itself (2.5%) and nginx at almost 10%. I've configured pfSense to match my requirements as much as possible. Temps are ranging from 54-65 °C. Although I can see the occasional 75 °C. I'm good with that. It looks like the main problem with my initial install was indeed the pfBlockerNG bug. Will refrain from installing that package until it has been updated.
@nimrod said in Anyrevo fanless appliance hitting >60 C, is this normal?:
If these temps are too high for you, as i said in previous post, you can go into BIOS of your Anyevo appliance and just disable Intel turbo boost technology. That will lower temperatures under load significantly.
Will keep this in mind.
Thanks so much!
The issue with pfBlockerNG is already fixed. You just need to apply the patch and you are good to go.
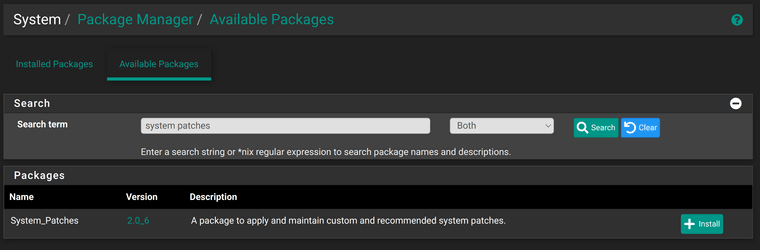
Go to System / Package Manager and click on Available Packages tab and type "system patches" and click on Install.
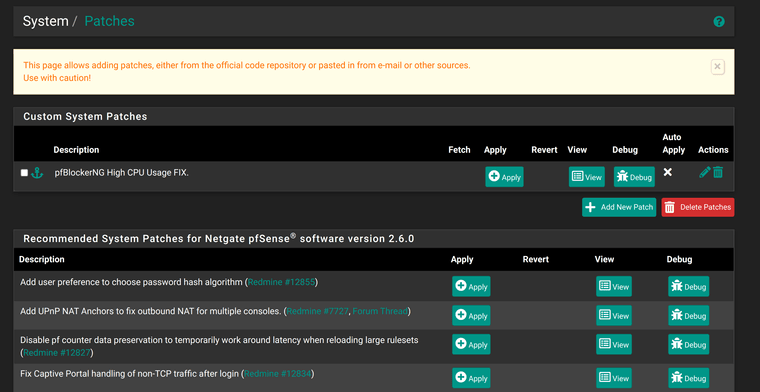
Onace installed, go to System / Patches and you will see this:
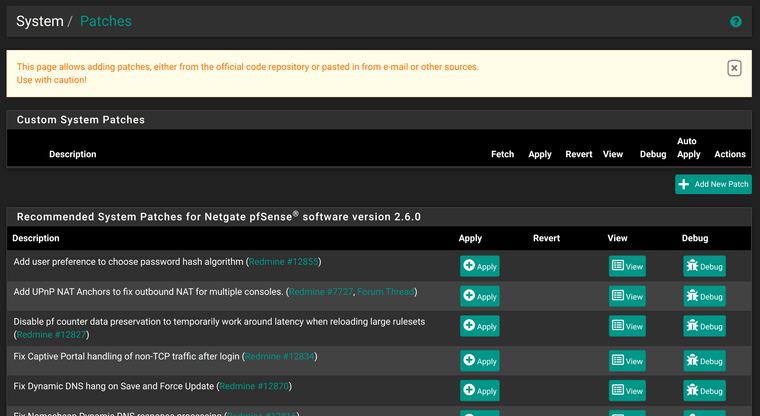
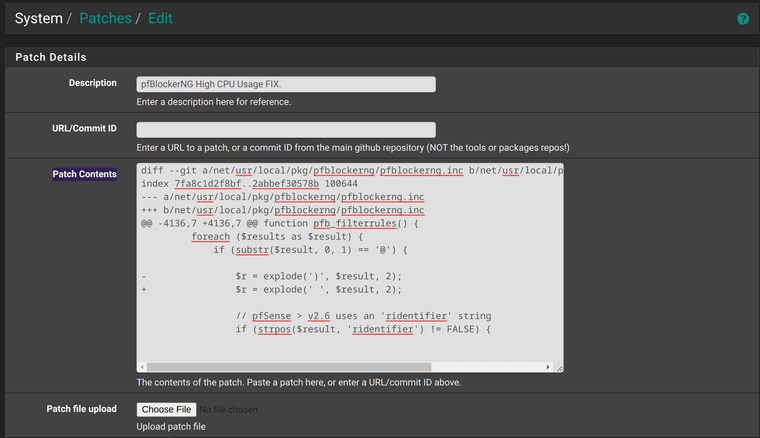
Click on add new patch and then you should see this:
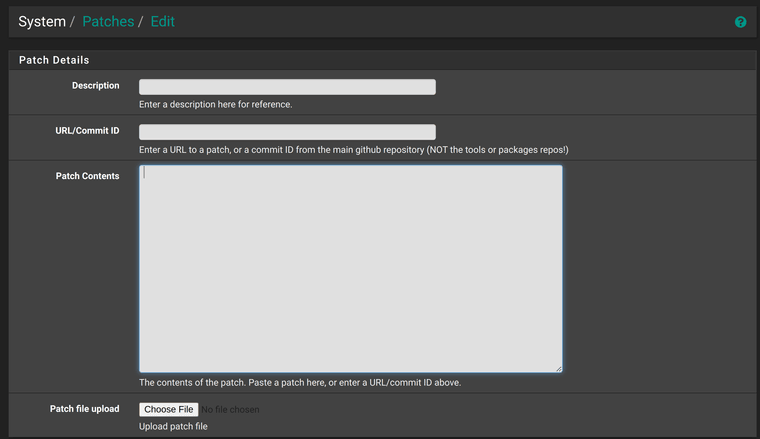
In the description field type: "pfBlockerNG High CPU Usage FIX" or whatever you like. Its just a description. Leave the "URL/Commit ID" field empty.
In the "Patch Contents" field paste this code:
diff --git a/net/usr/local/pkg/pfblockerng/pfblockerng.inc b/net/usr/local/pkg/pfblockerng/pfblockerng.inc
index 7fa8c1d2f8bf..2abbef30578b 100644
--- a/net/usr/local/pkg/pfblockerng/pfblockerng.inc
+++ b/net/usr/local/pkg/pfblockerng/pfblockerng.inc
@@ -4136,7 +4136,7 @@ function pfb_filterrules() {
         foreach ($results as $result) {
             if (substr($result, 0, 1) == '@') {

-                $r = explode(')', $result, 2);
+                $r = explode(' ', $result, 2);

                 // pfSense > v2.6 uses an 'ridentifier' string
                 if (strpos($result, 'ridentifier') != FALSE) {
It should look lkike this:
Scroll down, dont change anything else, and just click Save button. Once thats done, you should see this:
Click on Apply button, and if everything went well you should see this:
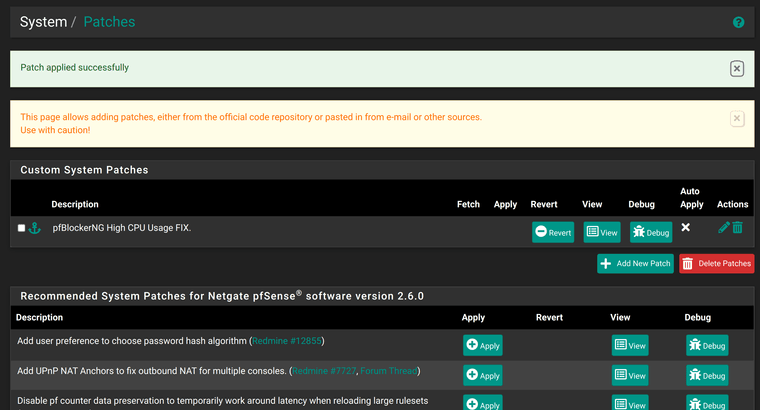
Reboot your appliance and thats it.
-
@stephenw10 Thanks! Here's a snapshot at idle just now with temperature at 52 °C.
last pid: 81146;  load averages:  0.09,  0.16,  0.19                                                                                                                                                                                                                                                                                              up 0+20:05:45  19:57:58
554 threads:   5 running, 526 sleeping, 23 waiting
CPU 0:  0.4% user,  0.0% nice,  0.4% system,  0.0% interrupt, 99.2% idle
CPU 1:  0.0% user,  0.0% nice,  0.4% system,  0.0% interrupt, 99.6% idle
CPU 2:  0.4% user,  0.0% nice,  0.4% system,  0.0% interrupt, 99.2% idle
CPU 3:  0.0% user,  0.0% nice,  0.8% system,  0.0% interrupt, 99.2% idle
Mem: 59M Active, 141M Inact, 557M Wired, 6893M Free
ARC: 212M Total, 36M MFU, 172M MRU, 164K Anon, 803K Header, 3631K Other
     60M Compressed, 152M Uncompressed, 2.54:1 Ratio
Swap: 1024M Total, 1024M Free

  PID USERNAME    PRI NICE   SIZE    RES STATE    C   TIME    WCPU COMMAND
   11 root        155 ki31     0B    64K RUN      1  20.0H  99.60% [idle{idle: cpu1}]
   11 root        155 ki31     0B    64K CPU3     3  20.0H  99.59% [idle{idle: cpu3}]
   11 root        155 ki31     0B    64K CPU2     2  20.0H  99.40% [idle{idle: cpu2}]
   11 root        155 ki31     0B    64K CPU0     0  20.0H  99.14% [idle{idle: cpu0}]
76349 root         20    0    14M  4676K CPU1     1   0:00   0.28% top -HaSP
   30 root        -12    -     0B  5120K -        1   0:11   0.13% [zpool-pfSense{zio_write_issue_1}]
    0 root        -76    -     0B   832K -        1   0:54   0.13% [kernel{if_io_tqg_1}]
    0 root        -76    -     0B   832K -        0   0:55   0.12% [kernel{if_io_tqg_0}]
    0 root        -76    -     0B   832K -        3   1:12   0.12% [kernel{if_io_tqg_3}]
   30 root        -12    -     0B  5120K -        0   0:11   0.11% [zpool-pfSense{zio_write_issue_0}]
   30 root        -12    -     0B  5120K -        3   0:11   0.09% [zpool-pfSense{zio_write_issue_2}]
   30 root         -8    -     0B  5120K tx->tx   3   0:08   0.07% [zpool-pfSense{txg_thread_enter}]
95917 unbound      20    0    71M    40M kqread   1   0:03   0.05% /usr/local/sbin/unbound -c /var/unbound/unbound.conf{unbound}
95917 unbound      20    0    71M    40M kqread   0   0:02   0.05% /usr/local/sbin/unbound -c /var/unbound/unbound.conf{unbound}
    0 root        -76    -     0B   832K -        3   0:43   0.04% [kernel{if_config_tqg_0}]
    0 root        -76    -     0B   832K -        2   0:56   0.03% [kernel{if_io_tqg_2}]
95917 unbound      20    0    71M    40M kqread   3   0:02   0.03% /usr/local/sbin/unbound -c /var/unbound/unbound.conf{unbound}
85026 root         21    0    63M    40M nanslp   1   0:05   0.03% php_wg: WireGuard service (php_wg)
   30 root        -16    -     0B  5120K -        2   0:02   0.02% [zpool-pfSense{zio_null_issue}]
95917 unbound      20    0    71M    40M kqread   2   0:01   0.02% /usr/local/sbin/unbound -c /var/unbound/unbound.conf{unbound}
99680 root         20    0    20M  9480K select   0   0:00   0.02% sshd: root@pts/0 (sshd)
   30 root        -16    -     0B  5120K -        2   0:00   0.02% [zpool-pfSense{zio_write_intr_1_10}]
   21 root        -16    -     0B    16K pftm     0   0:21   0.02% [pf purge]
   12 root        -80    -     0B   368K WAIT     2   0:01   0.02% [intr{irq269: nvme0:io2}]
31914 dhcpd        20    0    23M    12M select   3   0:01   0.02% /usr/local/sbin/dhcpd -user dhcpd -group _dhcp -chroot /var/dhcpd -cf /etc/dhcpd.conf -pf /var/run/dhcpd.pid igc1 igc1.10 igc1.20
39689 root         20    0    12M  3032K bpf      3   0:06   0.02% /usr/local/sbin/filterlog -i pflog0 -p /var/run/filterlog.pid
   30 root        -16    -     0B  5120K -        1   0:00   0.02% [zpool-pfSense{zio_write_intr_4_10}]
   30 root        -16    -     0B  5120K -        0   0:00   0.01% [zpool-pfSense{zio_write_intr_2_10}]
   30 root        -16    -     0B  5120K -        2   0:00   0.01% [zpool-pfSense{zio_write_intr_6_8}]
   22 root        -16    -     0B    16K -        2   0:10   0.01% [rand_harvestq]
   30 root        -16    -     0B  5120K -        1   0:00   0.01% [zpool-pfSense{zio_write_intr_7_5}]
   30 root        -16    -     0B  5120K -        3   0:00   0.01% [zpool-pfSense{zio_write_intr_0_8}]
   30 root        -16    -     0B  5120K -        1   0:00   0.01% [zpool-pfSense{zio_write_intr_5_11}]
   12 root        -60    -     0B   368K WAIT     3   0:10   0.01% [intr{swi4: clock (0)}]
   30 root        -16    -     0B  5120K -        2   0:00   0.01% [zpool-pfSense{zio_write_intr_5_7}]
   30 root        -16    -     0B  5120K -        1   0:00   0.01% [zpool-pfSense{zio_write_intr_6_5}]
40809 root         20    0    10M  2180K select   1   0:05   0.01% /usr/sbin/powerd -b hadp -a hadp -n hadp
   12 root        -80    -     0B   368K WAIT     0   0:01   0.01% [intr{irq267: nvme0:io0}]
   12 root        -80    -     0B   368K WAIT     3   0:01   0.01% [intr{irq270: nvme0:io3}]
   30 root        -16    -     0B  5120K -        3   0:00   0.01% [zpool-pfSense{zio_write_intr_3_10}]
83704 root         20    0    11M  2656K select   0   0:03   0.01% /usr/sbin/syslogd -s -c -c -l /var/dhcpd/var/run/log -P /var/run/syslog.pid -f /etc/syslog.conf
   12 root        -80    -     0B   368K WAIT     1   0:01   0.01% [intr{irq268: nvme0:io1}]
    8 root         -8    -     0B   608K spa->s   2   0:01   0.01% [zfskern{trim pfSense}]
32792 root         20    0    11M  2620K nanslp   0   0:01   0.01% /usr/local/bin/dpinger -S -r 0 -i WAN2_DHCP -B 10.210.192.17 -p /var/run/dpinger_WAN2_DHCP~10.210.192.17~10.210.192.1.pid -u /var/run/dpinger_WAN2_DHCP~10.210.192.17~10.210.192.1.sock -C /etc/rc.gateway_alarm -d 1 -s 500 -l 2000 -t 60000 -A 1000 -D 500 -L 20 10.210.192.1{dpinger}
    8 root         -8    -     0B   608K -        3   0:01   0.01% [zfskern{dp_sync_taskq_0}]
   30 root        -16    -     0B  5120K -        0   0:00   0.01% [zpool-pfSense{zio_write_intr_0_9}]
32330 root         20    0    11M  2620K nanslp   3   0:01   0.01% /usr/local/bin/dpinger -S -r 0 -i NORDVPN_HK_VPNV4 -B 10.8.1.2 -p /var/run/dpinger_NORDVPN_HK_VPNV4~10.8.1.2~10.8.1.2.pid -u /var/run/dpinger_NORDVPN_HK_VPNV4~10.8.1.2~10.8.1.2.sock -C /etc/rc.gateway_alarm -d 1 -s 500 -l 2000 -t 60000 -A 1000 -D 500 -L 20 10.8.1.2{dpinger}
   30 root        -16    -     0B  5120K -        0   0:00   0.01% [zpool-pfSense{zio_write_intr_7_4}]
   30 root        -16    -     0B  5120K -        3   0:00   0.01% [zpool-pfSense{zio_write_intr_3_6}]
    8 root         -8    -     0B   608K -        2   0:01   0.01% [zfskern{dp_sync_taskq_1}]
31917 root         20    0    11M  2620K nanslp   2   0:01   0.01% /usr/local/bin/dpinger -S -r 0 -i WAN_DHCP -B x.x.152.196 -p /var/run/dpinger_WAN_DHCP~x.x.152.196~x.x.128.1.pid -u /var/run/dpinger_WAN_DHCP~x.x.152.196~x.x.128.1.sock -C /etc/rc.gateway_alarm -d 1 -s 500 -l 2000 -t 60000 -A 1000 -D 500 -L 20 x.x.128.1{dpinger}
97451 root         20    0    19M  6892K select   3   0:04   0.01% /usr/local/sbin/ntpd -g -c /var/etc/ntpd.conf -p /var/run/ntpd.pid{ntpd}
   24 root        -16    -     0B    48K psleep   3   0:04   0.01% [pagedaemon{dom0}]
   30 root        -16    -     0B  5120K -        0   0:00   0.01% [zpool-pfSense{zio_free_intr}]
    8 root         -8    -     0B   608K -        1   0:01   0.01% [zfskern{dp_sync_taskq_2}]
   30 root        -16    -     0B  5120K -        2   0:00   0.01% [zpool-pfSense{zio_write_intr_1_11}]
   30 root        -16    -     0B  5120K -        2   0:00   0.01% [zpool-pfSense{zio_free_issue_1_3}]
   12 root        -72    -     0B   368K WAIT     1   0:00   0.01% [intr{swi1: netisr 2}]
   30 root        -16    -     0B  5120K -        3   0:00   0.00% [zpool-pfSense{zio_free_issue_0_1}]
   30 root        -16    -     0B  5120K -        3   0:00   0.00% [zpool-pfSense{zio_write_intr_4_9}]
   30 root        -16    -     0B  5120K -        3   0:00   0.00% [zpool-pfSense{zio_free_issue_6_1}]
   30 root        -16    -     0B  5120K -        1   0:00   0.00% [zpool-pfSense{zio_free_issue_7_0}]
I also did a speed test. It reached 71 °C. Pretty happy so far.

last pid: 70405; load averages: 0.30, 0.31, 0.25 up 0+20:16:07 20:08:20 554 threads: 6 running, 525 sleeping, 23 waiting CPU 0: 0.0% user, 0.0% nice, 22.7% system, 0.0% interrupt, 77.3% idle CPU 1: 0.0% user, 0.0% nice, 2.4% system, 0.0% interrupt, 97.6% idle CPU 2: 0.4% user, 0.0% nice, 1.6% system, 0.0% interrupt, 98.1% idle CPU 3: 0.4% user, 0.0% nice, 4.3% system, 0.0% interrupt, 95.3% idle Mem: 59M Active, 142M Inact, 557M Wired, 6893M Free ARC: 213M Total, 36M MFU, 172M MRU, 296K Anon, 805K Header, 3634K Other 60M Compressed, 152M Uncompressed, 2.54:1 Ratio Swap: 1024M Total, 1024M Free PID USERNAME PRI NICE SIZE RES STATE C TIME WCPU COMMAND 11 root 155 ki31 0B 64K RUN 2 20.2H 99.32% [idle{idle: cpu2}] 11 root 155 ki31 0B 64K CPU1 1 20.2H 97.16% [idle{idle: cpu1}] 11 root 155 ki31 0B 64K CPU3 3 20.2H 94.95% [idle{idle: cpu3}] 11 root 155 ki31 0B 64K CPU0 0 20.2H 82.06% [idle{idle: cpu0}] 0 root -76 - 0B 832K CPU0 0 1:03 17.80% [kernel{if_io_tqg_0}] 0 root -76 - 0B 832K - 3 1:17 4.77% [kernel{if_io_tqg_3}] 0 root -76 - 0B 832K - 1 1:01 2.64% [kernel{if_io_tqg_1}] 0 root -76 - 0B 832K - 2 1:04 1.56% [kernel{if_io_tqg_2}] 38722 root 20 0 14M 4676K CPU2 2 0:00 0.21% top -HaSP 0 root -76 - 0B 832K - 1 0:43 0.06% [kernel{if_config_tqg_0}] 40809 root 20 0 10M 2180K select 3 0:05 0.05% /usr/sbin/powerd -b hadp -a hadp -n hadp 85026 root 22 0 63M 40M nanslp 2 0:05 0.03% php_wg: WireGuard service (php_wg) 31914 dhcpd 20 0 23M 12M select 3 0:01 0.02% /usr/local/sbin/dhcpd -user dhcpd -group _dhcp -chroot /var/dhcpd -cf /etc/dhcpd.conf -pf /var/run/dhcpd.pid ig 21 root -16 - 0B 16K pftm 1 0:21 0.02% [pf purge] 12 root -60 - 0B 368K WAIT 0 0:10 0.01% [intr{swi4: clock (0)}] 99680 root 20 0 20M 9512K select 2 0:00 0.01% sshd: root@pts/0 (sshd) 22 root -16 - 0B 16K - 3 0:10 0.01% [rand_harvestq] 32792 root 20 0 11M 2620K nanslp 2 0:01 0.01% /usr/local/bin/dpinger -S -r 0 -i WAN2_DHCP -B 10.210.192.17 -p /var/run/dpinger_WAN2_DHCP~10.210.192.17~10.210 32330 root 20 0 11M 2620K nanslp 0 0:01 0.01% /usr/local/bin/dpinger -S -r 0 -i NORDVPN_HK_VPNV4 -B 10.8.1.2 -p /var/run/dpinger_NORDVPN_HK_VPNV4~10.8.1.2~10 31917 root 20 0 11M 2620K nanslp 0 0:01 0.01% /usr/local/bin/dpinger -S -r 0 -i WAN_DHCP -B x.x.152.196 -p /var/run/dpinger_WAN_DHCP~x.x.152.196~112. 45594 root 20 0 15M 6228K select 2 0:02 0.01% /usr/local/sbin/miniupnpd -f /var/etc/miniupnpd.conf -P /var/run/miniupnpd.pid 24 root -16 - 0B 48K psleep 1 0:04 0.01% [pagedaemon{dom0}] 97451 root 20 0 19M 6892K select 3 0:04 0.01% /usr/local/sbin/ntpd -g -c /var/etc/ntpd.conf -p /var/run/ntpd.pid{ntpd} 12 root -72 - 0B 368K WAIT 1 0:01 0.01% [intr{swi1: netisr 2}] 95917 unbound 20 0 71M 40M kqread 0 0:01 0.01% /usr/local/sbin/unbound -c /var/unbound/unbound.conf{unbound} 32792 root 20 0 11M 2620K sbwait 1 0:00 0.00% /usr/local/bin/dpinger -S -r 0 -i WAN2_DHCP -B 10.210.192.17 -p /var/run/dpinger_WAN2_DHCP~10.210.192.17~10.210 31917 root 20 0 11M 2620K sbwait 0 0:00 0.00% /usr/local/bin/dpinger -S -r 0 -i WAN_DHCP -B x.x.152.196 -p /var/run/dpinger_WAN_DHCP~x.x.152.196~112. 382 root 20 0 103M 28M kqread 1 0:03 0.00% php-fpm: master process (/usr/local/lib/php-fpm.conf) (php-fpm) 32792 root 20 0 11M 2620K nanslp 3 0:00 0.00% /usr/local/bin/dpinger -S -r 0 -i WAN2_DHCP -B 10.210.192.17 -p /var/run/dpinger_WAN2_DHCP~10.210.192.17~10.210 32330 root 20 0 11M 2620K sbwait 0 0:00 0.00% /usr/local/bin/dpinger -S -r 0 -i NORDVPN_HK_VPNV4 -B 10.8.1.2 -p /var/run/dpinger_NORDVPN_HK_VPNV4~10.8.1.2~10 95917 unbound 20 0 71M 40M kqread 3 0:03 0.00% /usr/local/sbin/unbound -c /var/unbound/unbound.conf{unbound} 95917 unbound 20 0 71M 40M kqread 1 0:03 0.00% /usr/local/sbin/unbound -c /var/unbound/unbound.conf{unbound} 8 root -8 - 0B 608K spa->s 3 0:01 0.00% [zfskern{trim pfSense}] 39689 root 20 0 12M 3032K bpf 0 0:06 0.00% /usr/local/sbin/filterlog -i pflog0 -p /var/run/filterlog.pid 31917 root 20 0 11M 2620K nanslp 0 0:00 0.00% /usr/local/bin/dpinger -S -r 0 -i WAN_DHCP -B x.x.152.196 -p /var/run/dpinger_WAN_DHCP~x.x.152.196~112. 28 root 16 - 0B 16K syncer 3 0:01 0.00% [syncer] 8 root -8 - 0B 608K t->zth 0 0:01 0.00% [zfskern{solthread 0xfffffff}] 12 root -60 - 0B 368K WAIT 3 0:01 0.00% [intr{swi4: clock (1)}] 26 root -16 - 0B 80K - 0 0:00 0.00% [bufdaemon{bufspacedaemon-2}] 8 root -8 - 0B 608K t->zth 3 0:01 0.00% [zfskern{solthread 0xfffffff}] 32330 root 20 0 11M 2620K nanslp 0 0:00 0.00% /usr/local/bin/dpinger -S -r 0 -i NORDVPN_HK_VPNV4 -B 10.8.1.2 -p /var/run/dpinger_NORDVPN_HK_VPNV4~10.8.1.2~10 12 root -60 - 0B 368K WAIT 0 0:01 0.00% [intr{swi4: clock (2)}] 12 root -60 - 0B 368K WAIT 2 0:01 0.00% [intr{swi4: clock (3)}] 27 root -16 - 0B 16K vlruwt 0 0:00 0.00% [vnlru] 8 root -8 - 0B 608K mmp->m 3 0:00 0.00% [zfskern{mmp_thread_enter}] 8 root -8 - 0B 608K dbuf_e 1 0:00 0.00% [zfskern{dbuf_evict_thread}] 8 root -8 - 0B 608K l2arc_ 2 0:00 0.00% [zfskern{l2arc_feed_thread}] 26 root -16 - 0B 80K psleep 1 0:00 0.00% [bufdaemon{bufdaemon}] 24 root -16 - 0B 48K umarcl 3 0:00 0.00% [pagedaemon{uma}] 26 root -16 - 0B 80K - 2 0:00 0.00% [bufdaemon{bufspacedaemon-3}] 26 root -16 - 0B 80K - 0 0:00 0.00% [bufdaemon{bufspacedaemon-1}] 95917 unbound 20 0 71M 40M kqread 3 0:02 0.00% /usr/local/sbin/unbound -c /var/unbound/unbound.conf{unbound} 26 root -16 - 0B 80K - 1 0:00 0.00% [bufdaemon{bufspacedaemon-0}] 17 root -16 - 0B 16K - 3 0:00 0.00% [soaiod2] 0 root -16 - 0B 832K swapin 1 0:14 0.00% [kernel{swapper}] 383 root 52 0 135M 49M accept 2 0:12 0.00% php-fpm: pool nginx (php-fpm){php-fpm} 30 root -12 - 0B 5120K - 3 0:11 0.00% [zpool-pfSense{zio_write_issue_1}] 30 root -12 - 0B 5120K - 2 0:11 0.00% [zpool-pfSense{zio_write_issue_2}] 30 root -12 - 0B 5120K - 2 0:11 0.00% [zpool-pfSense{zio_write_issue_0}] 384 root 52 0 132M 49M accept 1 0:11 0.00% php-fpm: pool nginx (php-fpm) 79924 root 52 0 132M 48M accept 1 0:08 0.00% php-fpm: pool nginx (php-fpm) 30 root -8 - 0B 5120K tx->tx 1 0:08 0.00% [zpool-pfSense{txg_thread_enter}] -
@nimrod Oohh! Alright! Will try this later when I can do a reboot. Network is busy right now.
Thanks!
-
Yeah, that looks good. Nothing using any CPU at idle at all really. No CPU cores anywhere near 100% use under test.
Steve
-
Thanks for all your help @stephenw10 and @nimrod my pfSense has been up almost two full days. So far so good. I will attempt to install pfBlockerNG tonight.
-
@bokolobs said in Anyrevo fanless appliance hitting >60 C, is this normal?:
I have a fanless appliance from Anyrevo with N5105
I couldnt find anything to that appliance but what I know is that many of that little enclosure have problems with heat and in many situations there would be helpful to get the heatsink of the processor off and clean the surfaces an reapply a new thermal paste ...
Just my 2 cents