pfSense GUI damn(!) slow due to ^Firewall Logs^ widget
-
Months ago, I already complained about the damn slow pfSense GUI. I hoped for improvement with the migration to FreeBSD 14 current.
A few weeks ago, I switched to the "develop" version, but the GUI is still damn slow. And that on my not so slow firewall with lots of ram and and booting from an nvme-drive.
Trying to identify what is exactly so slow, I switched off the GUI widgets one by one. The widget being the biggest culprit, turns out to be the one showing the ^Firewall Logs^.
To give an impression the time to show the login screen with that widget enabled is 16 !!! seconds, without that widget is is below 2.
So something is wrong with that widget !!
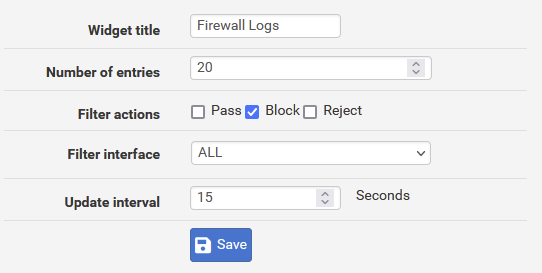
Below the settings I use which are IMHO far from exceptional
Louis
-
You won't like my proposal : don't use that firewall widget and problem solved ! ;)
I'll explain :
I you have the initial default firewall rules on LAN and WAN, you will be fine, and you could use the widget just fine. It will never show anything, as the default (hidden !) block rules and pass don't log :
All LAN traffic can visit everything, including the internet.
All incoming WAN traffic hits "the wall" silently and gets ditched.
So : no log entries in the firewall log.The GUI widget, writing in PHP, will show nothing : it will show up fast.
Also, PHP is infamous in file handling == parsing out (huge !) log files.
If you have a lot of rules, and have rules that are applied a lot and that rule also logs, then the widget (again : php) will have a had time keeping up, and this will impact the pfSense dashboard access.
You've seen what I mean.Ask yourself this question : what do you want to do with a firewall log that rotates (so the info is lost) permanently, as you are generating a lot of log traffic:
"To much info kills the info".If you really want to look at the firewall log :
Use the console, or SSH, use option 8 and :tail -f /var/log/filter.logOr, another solution (because the firewall log is important for you) : use an external syslogger.
-
I really do not understand the problem. If I execute the suggested tail command the response is 'instantly'.
Forwarding that output to html a bit like this
<pre><?= htmlspecialchars(shell_exec(tail -f /var/log/filter.log)); ?></pre>
Can not take much longer. Some formatting does add some extra time but 16 seconds ridiculous !!!
-
@louis2 question for you - are you compressing the logs?
-
@johnpoz
not that I know -
@louis2 check here
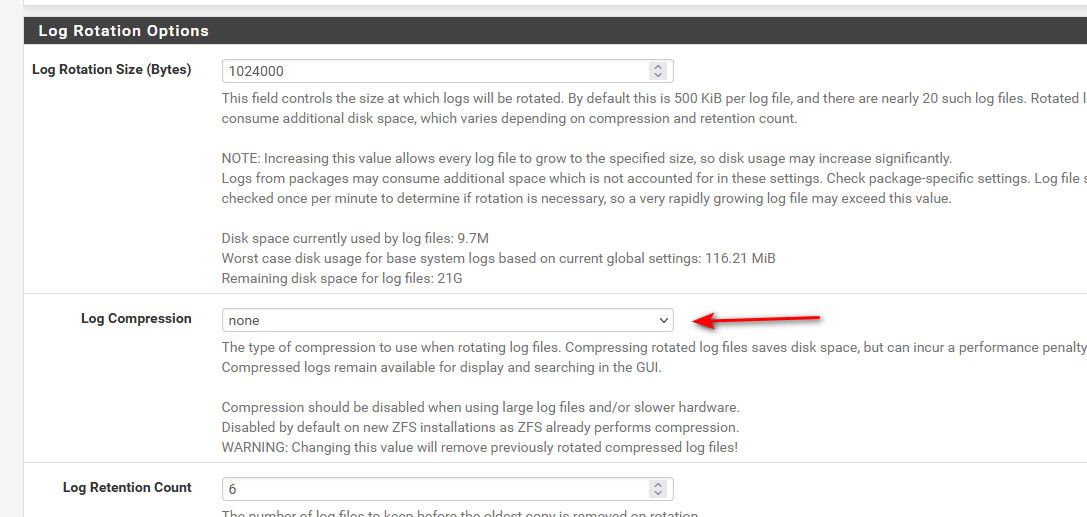
Under the log settings - in the past when users have had slow response with logs turning off compression has made improvement.
-
John the actual setting is the default bzip2. And perhaps you are right if you suggest that changing that to none, makes it a little bit faster.
However I have a large ram disk enabled, the system is running from an nvme ssd, and the tail command shows the latest alarms instantly.
So I really do not believe that is the problem. I would really be very surprised if a change in the app-code could not make it 50 times faster.
-
@louis2 try turning that off and see if makes a difference.. There is little reason to compress them, and other users have seen a vast improvement when turning it off.
I am not saying there couldn't be some optimization in speed of displaying it - just saying this has helped other users.
-
Hmm, I can't replicate this.
Do you have so few entries there that 20 lines of blocked traffic means opening all the compressed files?
I'm testing on an internal device that doesn't see much logging and the firewall logs widget really doesn't seem to add much at all. -
I just logged in via SSH and I have three filter log files.
- one compressed date 16 november 16:25 (log.1.bz2)
- one compressed date 16 november 19:40 (log.0.bz2)
- one not compressed date 16 november 20.10 (log) (5 minutes old)
And I am quite sure that each of them has many more than 20 lines with blocked traffic. About 50% of the logged messages are related to blocked traffic.
Apart from that, it tail can show 20 lines in an instant, I do not see any reason why the app could not !!!
-
Yup, those logs are rotating quite often. It should not be opening more than one file.
I would disable compression with that sort of rotation rate. At the very least it can pu8t a big load spike on the firewall more often than you'd want.But a 16s delay is huge. I'm seeing nothing approaching that. What other widgets do you have there/ Perhaps it's a combination creating that.
-
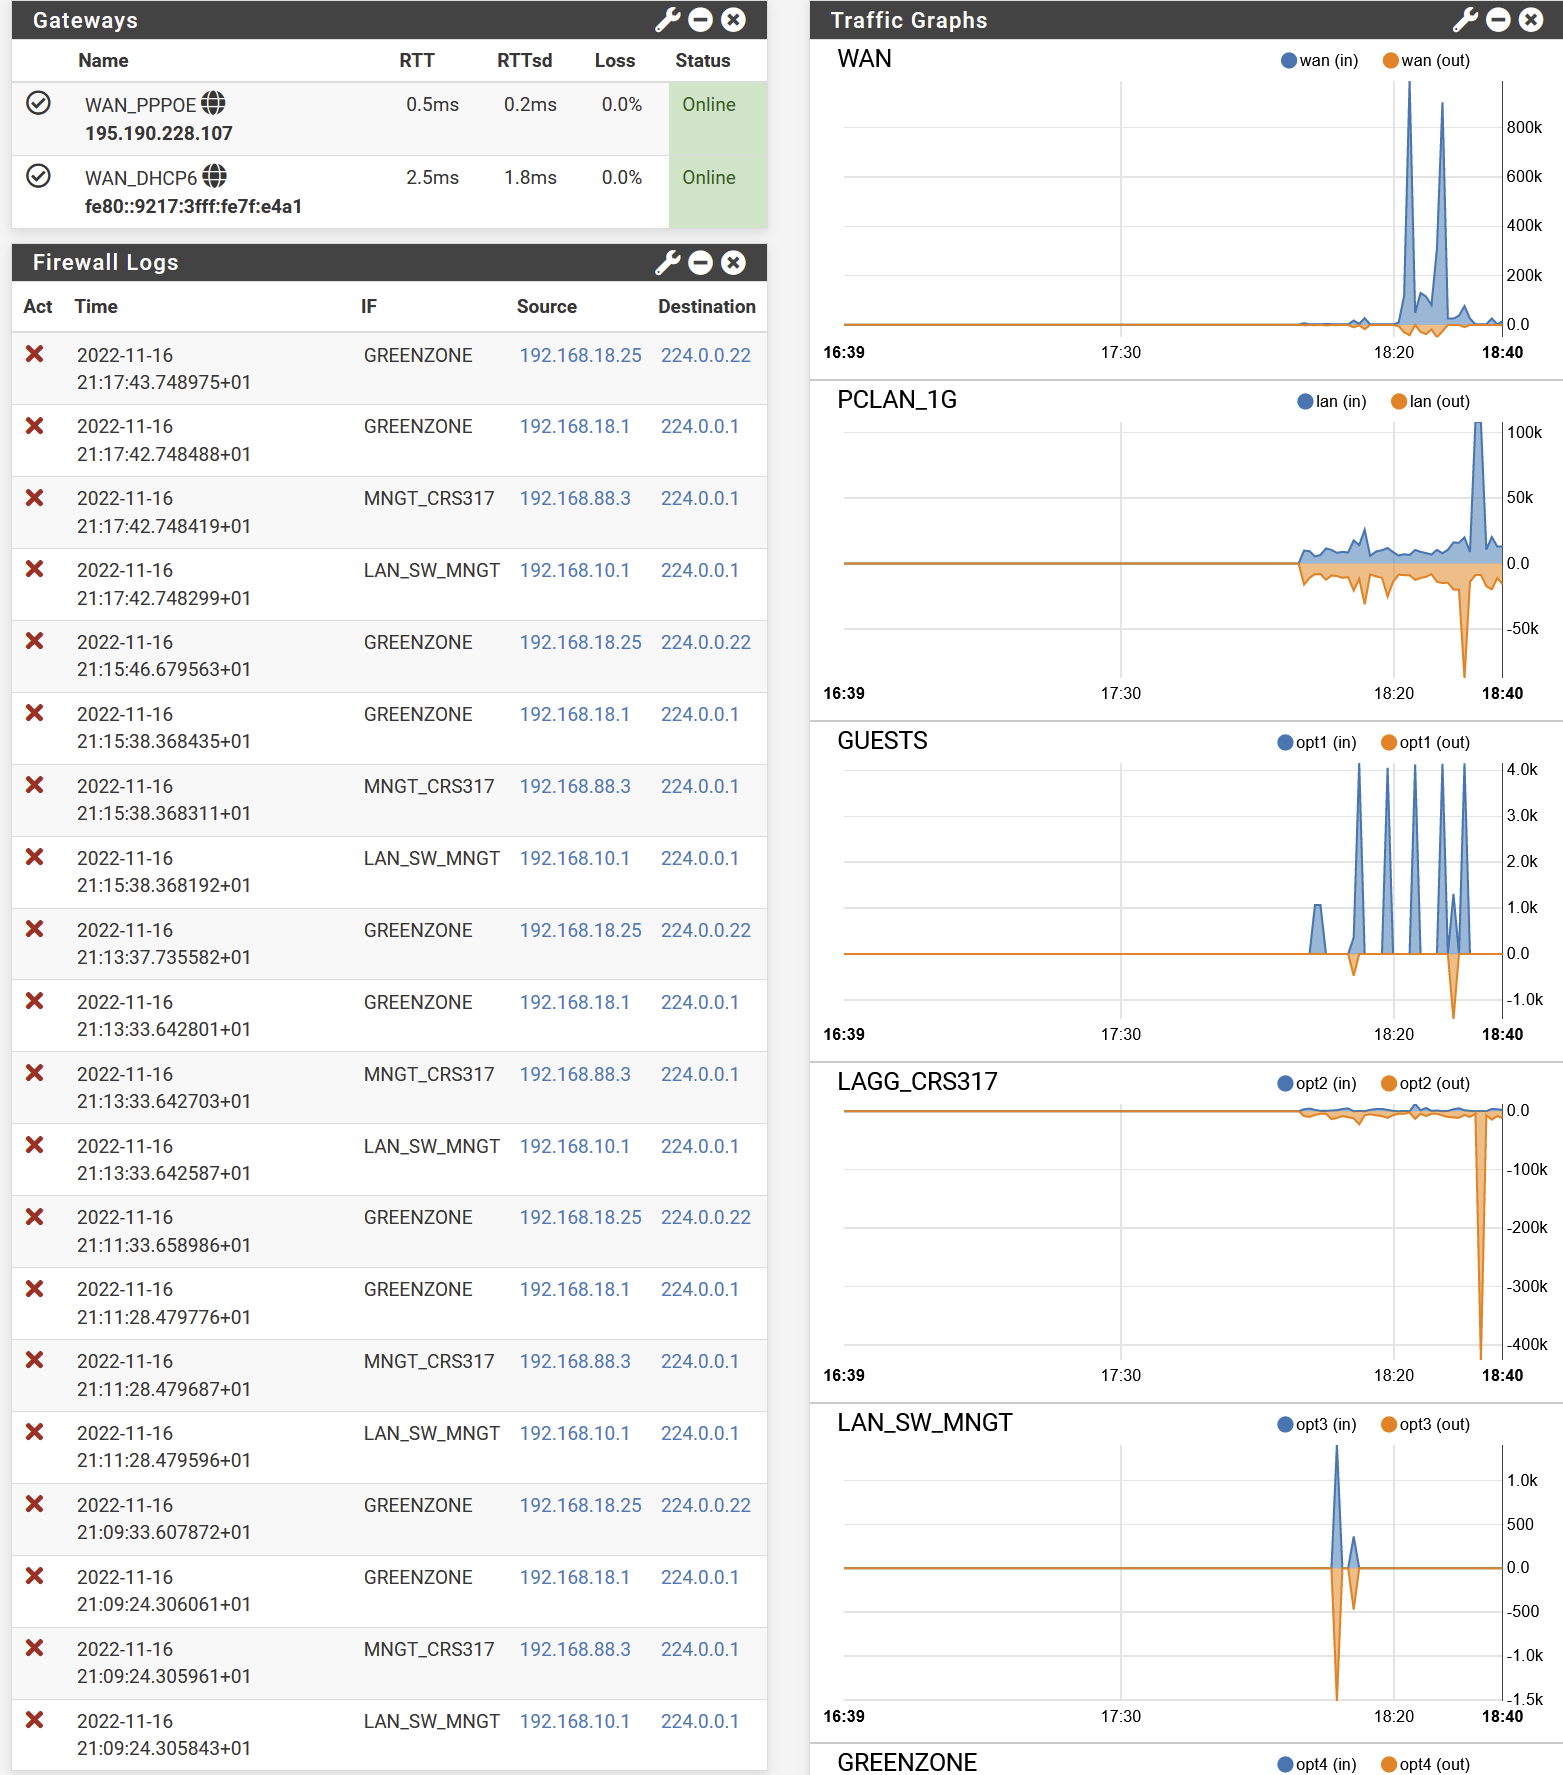
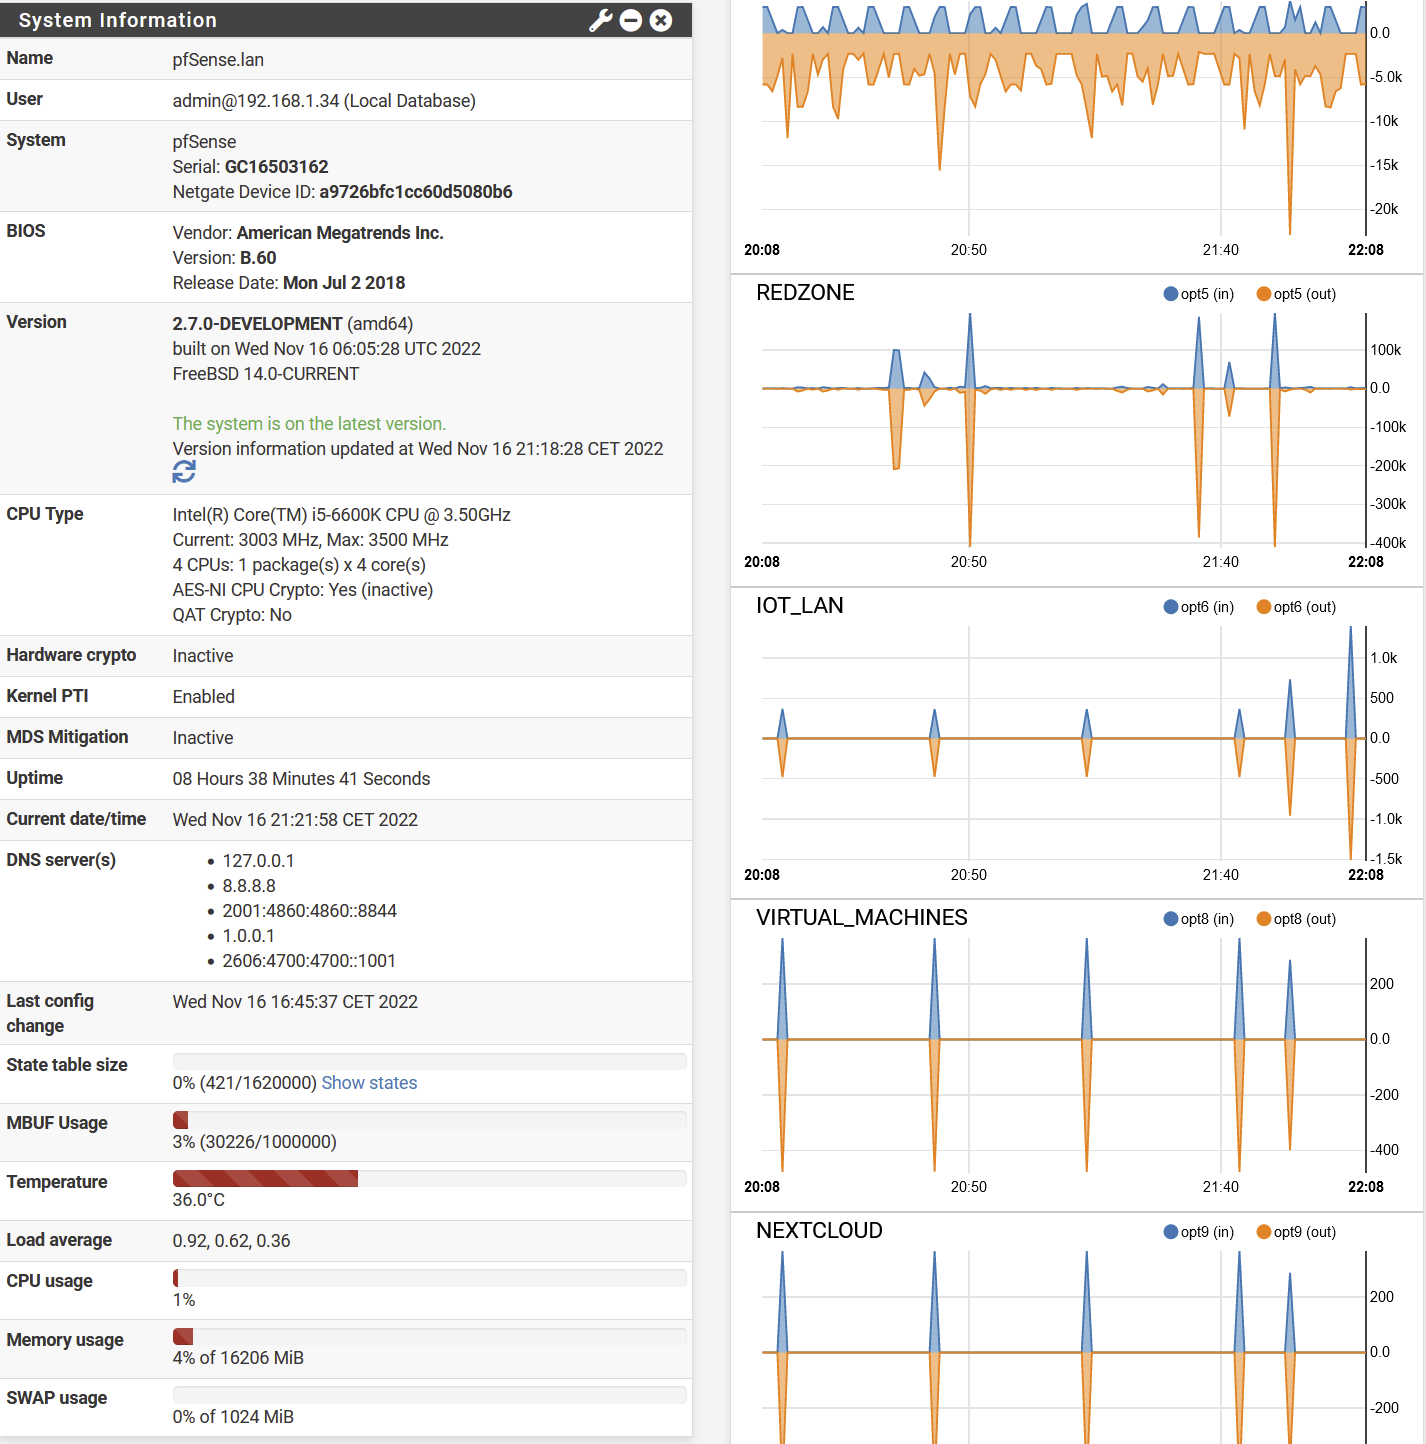
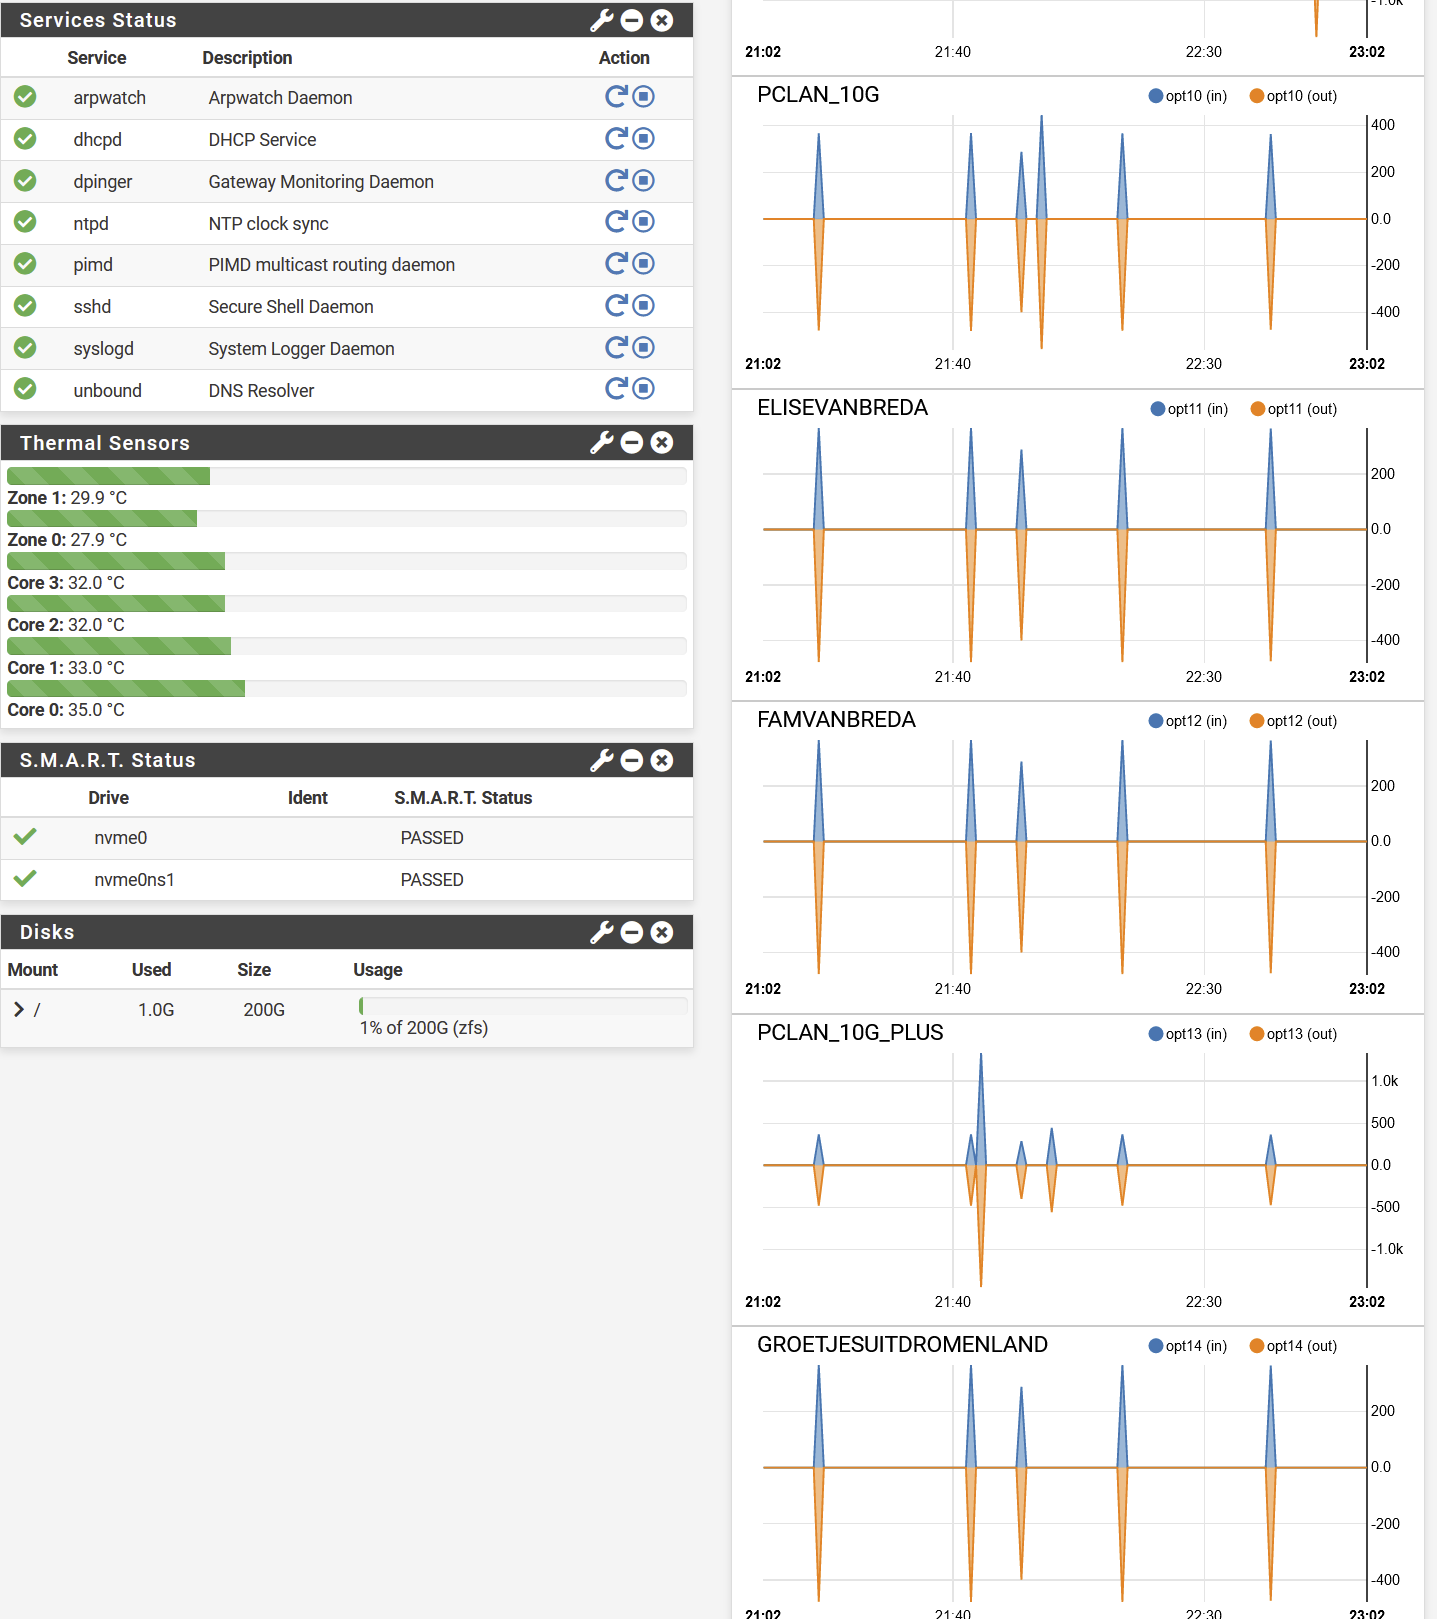
Here two screenshots, note that the alarms you see are not representative, there a lot more 224.0.0.x alarms than normal. I have to find out why.
However the overall behavoir is not different than in the past.
A couple of vlans are not in use they are there in favor of a future virtual machine.
Louis
-
Hmm, of the things your have there I would expect the traffic graphs to be a far larger delay than the firewall logs. Though testing it here I still only see ~3s with that loaded. And I'm testing on a 4100 which is far lower powered than your hardware.
Is that installed bare metal on that i5? -
Yep it is bare metal. It is really not a slow system for an firewall. Note that part of the network is 10G.
Apart from that, I would have expected that the graphs would cost far more delay than the IMHO simple message log representation. But not true. If I login with the firewall log enabled or change to that screen there is at lease 16 seconds delay, where I can not properly measure the delay, if I remove the firewalllog widget, so lets say below 2 seconds
So I really thing there is something terrible wrong with the design of the code of that widget
-
There must be something else in play here, I can't replicate that even on a low powered VM.
Is it only the dashboard that's slow? Viewing the firewall logs via the System Logs page is OK?
-
Looking at the logs via the status menu behaves normal. It is just the dashboard which is so damn slow.
That is relevant when
- login
- and when returning form whatever menu towards the dashboard.
I think that a better action then testing would be exterminating the widget code and perhaps (if necessary) adding a couple of time measurement debug statements.
If I can find the code related to the widget on github, I intent to have a look at the code myself as well
-
@louis2 said in pfSense GUI damn(!) slow due to ^Firewall Logs^ widget:
If I can find the code related to the widget on github,
No need to go that far.
/usr/local/www/widgets/widgets/log.widget.phpor here : https://github.com/pfsense/pfsense/blob/master/src/usr/local/www/widgets/widgets/log.widget.php
Looks the same to me.
@louis2 said in pfSense GUI damn(!) slow due to ^Firewall Logs^ widget:
and perhaps (if necessary) adding a couple of time measurement debug statements

The interesting part, I guess, is :
from line 80 to 101.
There are a couple of assignments and a function called conv_log_filter().
Add a log line with a time stamp : you will know quickly what function or place in the code eats up all the time.
Then, go to that function, and repeat adding log lines with time stamps.Afterwards, you'll find the classic foreach part that constructs the page.
-
Gertjan could you place the link to the code?
Other point is that I would like to see the rule name in the widget. Perhaps as a second line under IF
Sorry you did already provide some links
-
I am not a php or java expert, and I only reviewed the first part of the code but some remarks below.
First and most important one is that 'conv_log_filter' is fed with the total $filter_logfile = "{$g['varlog_path']}/filter.log"
Which does not seem clever to meI would only insert lets say max the last 100 lines of the filter log into the conv_log_filter ....
As said I did not look through all code and I am not a java, ajax or php expert, but here some things I was thinking waling through the first part of the code
Initial thoughts (note I am not an expert in gui programming)
if (is_numeric($_POST['filterlogentries'])) {
I would have expected an default value in case not numeric
I would also have expected a max value
$acts = array();
is an array containing the the choosen filter, but why is it an array since it contains only one valueThe widget key seems upperlevel to me, I do not understand why there is an an relation with a setting like != "All")
I understand there is a relation in regard to update frequency$filter_logfile = "{$g['varlog_path']}/filter.log";
that is clear it only looks into the actual (not compressed) log$filterlog = conv_log_filter($filter_logfile, $nentries, 50, $filterfieldsarray);
I wonder for which reason the 50 is there (50 lines max?), if so I think the max should be about 5 times the requested number of entrys since at this point you do not know the type of the fetched lines -
@louis2 said in pfSense GUI damn(!) slow due to ^Firewall Logs^ widget:
First and most important one is that 'conv_log_filter' is fed with the total $filter_logfile = "{$g['varlog_path']}/filter.log"
Which does not seem clever to meNoop.
$filter_logfile contains the path and file name of the log file.
/var:log/filter.log in this case.Then the conv_log_filter() set up a boat load of parser items, and calls finally :
/bin/cat '/var/log/filter.log.0' '/var/log/filter.log' | /usr/bin/tail -r -n 10000(I'm not bzipping my logs so this is a basic command line tail command)
It executes very fast.Then the resultant is filtered, and sorted if needed.
It took about half a second for my filter.log (864 Kbytes) and filter.log.0 (1069 Kbytes) to get the first 10000 lines, filter and sort, and show up the result - the widget.
As far as I can see, I found no DNS or other time consuming requests are needed
I'm using a Netgate 4100 on 22.05 btw (pfSense Plus), not the neck and code breaking 2.7.0. dev ;)