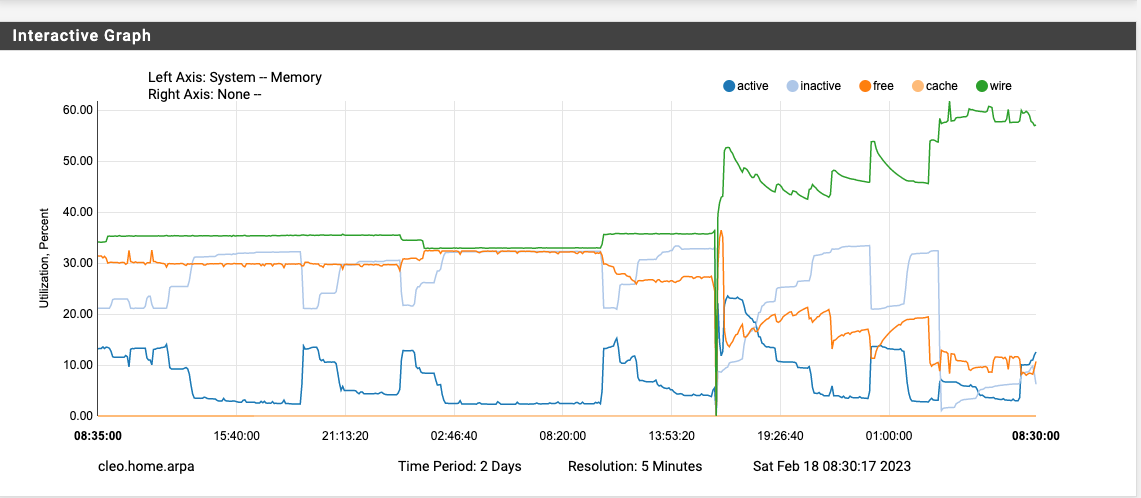
1100 upgrade, 22.05->23.01, high mem usage
-
@jrey Given that Cached memory goes "equally" down, could it be a performance optimization i FreeBSD 14 that evaluates the free memory available in the box and decides to increase wired memory use to increase performance instead of touching disk (and maybe/maybe not hitting cache memory) again and again?
-
Very possible in my case - because the system is very flat lined with regards to memory. I was just providing the information for those that have a more scattered memory with huge swings. This "feature" would mask what is going on for some of them, because they are potentially seeing this huge swing on top of their systems "normal" up and downs.
I've said all along that my system is not stressed with regards to memory in the current configuration and I'm not concerned. I should have also said "likely normal" (my bad)
Thanks, JR
-
@jrey said in 1100 upgrade, 22.05->23.01, high mem usage:
Very possible in my case - because the system is very flat lined with regards to memory. I was just providing the information for those that have a more scattered memory with huge swings. This "feature" would mask what is going on for some of them, because they are potentially seeing this huge swing on top of their systems "normal" up and downs.
I've said all along that my system is not stressed with regards to memory in the current configuration and I'm not concerned. I should have also said "likely normal" (my bad)
Thanks, JR
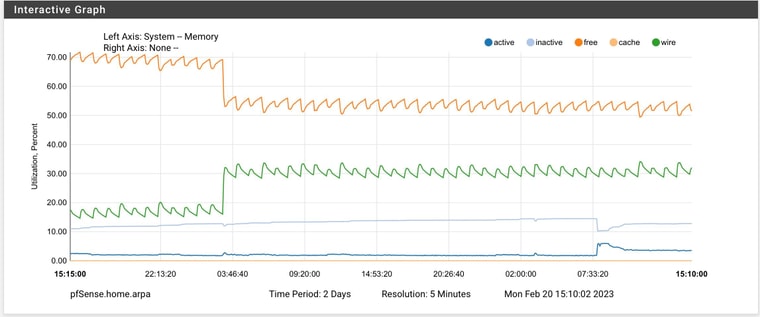
it's not your device. My 6100 MAX is doing the EXACT same thing at the EXACT same time since upgrading to 23.01. This is what I see after a clean reboot and at 3AM:
-
S SteveITS referenced this topic on
-
@keyser said in 1100 upgrade, 22.05->23.01, high mem usage:
Given that Cached memory goes "equally" down
check again, is not cached memory going down, it is the free memory that goes down by an "equal" amount - cache is actually zero in my case.
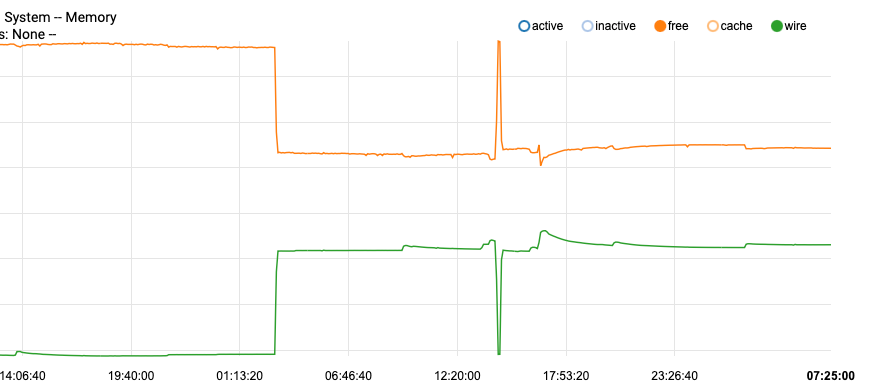
Still could be "optimization" as part of the "periodic daily", just not optimization of cache as suggested.
Thanks
Edit: I wonder if..
when I ran the periodic daily manually in my test it complained that mail was not available.
"By default, the output from running the periodic scripts is emailed to the root user on the local system"
this can't happen on the NetGate. So makes me think the memory might be the reports that it wants to mail, but can't. The reason it then never consumes more memory, is the reports themselves take the same "footprint" everyday.
There is a configuration setting in periodic's conf to tell the system not to mail these reports at all. Checking this now, if they are on, I'll turn them off and re-test or redirect them with conf option
email is likely a poor choice but they can go to a path as well
daily_output=”some_address@someplacevalid.com"
might be an option if this is in fact what is going on. -
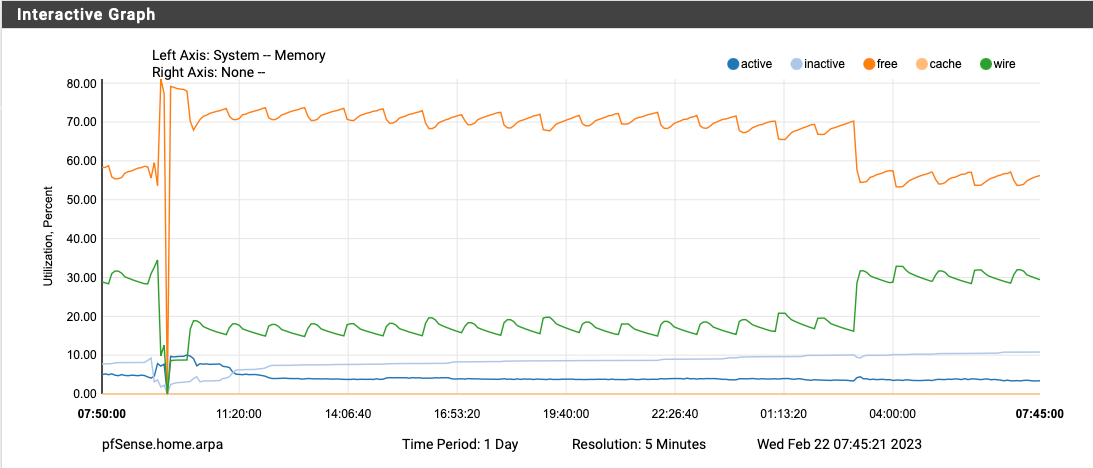
Upgraded to pfBlockerNG 3.2.0_2 yesterday, disabled Suricata completely, and rebooted around 9:30 AM yesterday morning. The memory utilization doubled again at exactly 3AM. The only cron job running at 3AM is the daily periodical and hourly pfBlocker updates (which there wasn't any lists to update today at 3AM).
I've also attached my system log from 2AM to 6AM and there is nothing worthwhile in there to explain what is happening at 3AM besides the daily periodical.
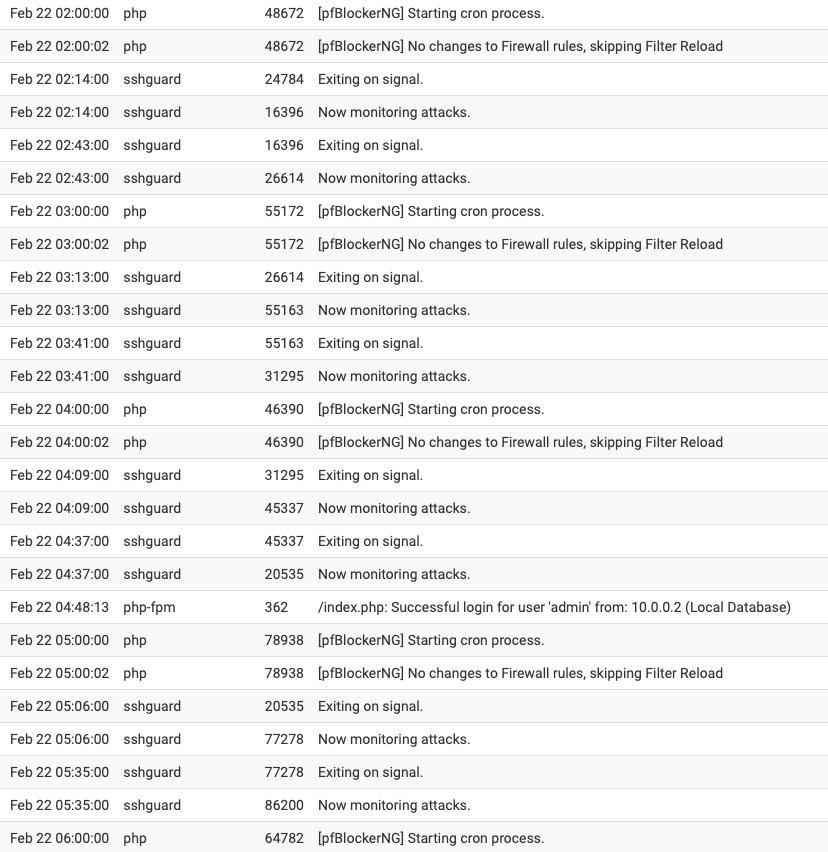
-
S SteveITS referenced this topic on
-
S SteveITS referenced this topic on
-
it is not pfB, my tasks for that don't run at 3am and another user on here doesn't even have it installed. So I think safe to rule that out.
I've been going back through "periodic daily" it is clearly something in there.
going on the theory that out of box is set to email the daily, weekly, monthly (and security) reports and but can't - this is the result of testing in that regard.I've done the following test since my previous post earlier today.
create a file /etc/periodic.conf.localin that file place these 6 lines
daily_output=/var/log/daily.log
daily_status_security_output=/var/log/daily_security.log
weekly_output=/var/log/weekly.log
weekly_status_security_output=/var/log/weekly_security.log
monthly_output=/var/log/monthly.log
monthly_status_security_output=/var/log/monthly_security.login the first test I only had the 3 lines for normal output(not security)
wanted to see if it was one or the other (ie normal or security logs that might in play..
then the second test (with security logs also redirected to files),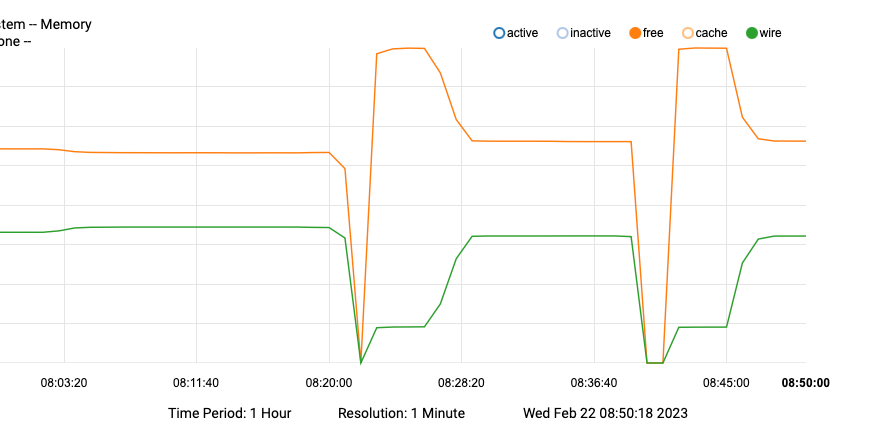
graph shows only free and wire
making this change did have a minor impact on the footprint but not enough to worry about. but at least now I can look at these reports if needed, not a bad thing.
since the "periodic daily" just runs a bunch of scripts and each can be disable (and a lot are disabled by default) I now looking at the conf "enabled" ones to see if there is "one that is most likely to"..
-
@jrey said in 1100 upgrade, 22.05->23.01, high mem usage:
it is not pfB, my tasks for that don't run at 3am and another user on here doesn't even have it installed. So I think safe to rule that out.
I've been going back through "periodic daily" it is clearly something in there.
going on the theory that out of box is set to email the daily, weekly, monthly (and security) reports and but can't - this is the result of testing in that regard.I've done the following test since my previous post earlier today.
create a file /etc/periodic.conf.localin that file place these 6 lines
daily_output=/var/log/daily.log
daily_status_security_output=/var/log/daily_security.log
weekly_output=/var/log/weekly.log
weekly_status_security_output=/var/log/weekly_security.log
monthly_output=/var/log/monthly.log
monthly_status_security_output=/var/log/monthly_security.login the first test I only had the 3 lines for normal output(not security)
wanted to see if it was one or the other (ie normal or security logs that might in play..
then the second test (with security logs also redirected to files),
graph shows only free and wire
making this change did have a minor impact on the footprint but not enough to worry about. but at least now I can look at these reports if needed, not a bad thing.
since the "periodic daily" just runs a bunch of scripts and each can be disable (and a lot are disabled by default) I now looking at the conf "enabled" ones to see if there is "one that is most likely to"..
Check out the newest entries in this thread. They are trying to figure out what is happening during the daily periodic...
https://forum.netgate.com/topic/177886/23-1-using-more-ram/56?_=1677011443983
-
@jrey said in 1100 upgrade, 22.05->23.01, high mem usage:
@keyser said in 1100 upgrade, 22.05->23.01, high mem usage:
Given that Cached memory goes "equally" down
check again, is not cached memory going down, it is the free memory that goes down by an "equal" amount - cache is actually zero in my case.
Ooopps, my bad :-)
True that.
-
@rpsmith -- and I forgot to mention it bricked my 1100 when I attempted to upgrade to 23.01!
-
Welp
-
@rpsmith That's probably the known issue which is why they halted upgrades on those two models. Per other threads, even after "knowing" what the problem was, Netgate has been unable to replicate it, at least as of a couple days ago.
It's the hard way to learn the lesson but I always try to let updates simmer for a week or two, just in case something unforeseen happens. FWIW that's the first widespread problem like that I can recall in ~15 years of using pfSense for ourselves and our clients.
-
Got it!
Test restart system establish base line
run the scripts as listed in order manually
(I've listed them all, even though some of them are enabled but don't actually exist, which causes nothing to happen so meh)I've not included their full name, just the number (except for 480 because there are 2)
100 not enabled
110 not enabled
120 yes - no impact
130 enabled, does not exist
140 enabled, does not exist
150 enabled, does not exist
200 yes - no impact
210 yes - no impact
211 yes - no impact
222 not enabled
223 not enabled
300 not enabled
310 yes - no impact
400 yes - no impact
401 not enabled
404 not enabled
406 not enabled
409 not enabled
410 not enabled
420 yes - no impact
430 yes - no impact
440 enabled, does not exist450 yes - yes impact
460 enabled - does not exist
480.leapfile-ntpd enabled - does not exist
480.status-ntpd - not enable, does not exist
500 enabled, does not exist
510 enabled, no impact
800 not enabled
999 there are no local scripts in the directory specified.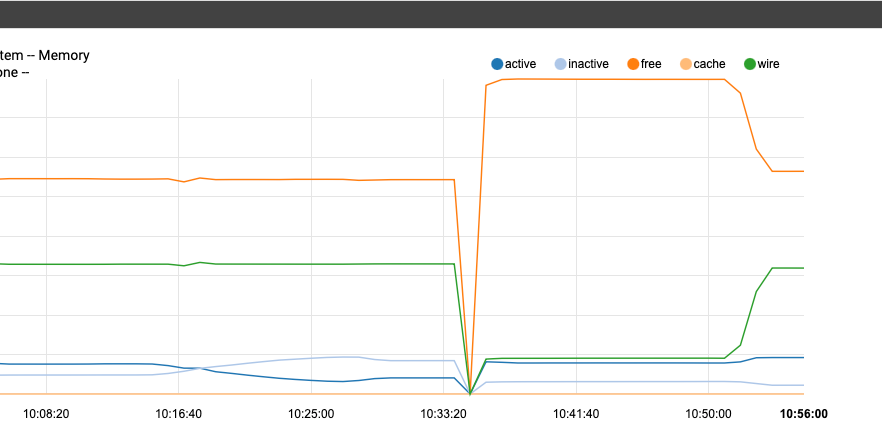
Notice how after restarting the memory remained unchanged for some time until I ran script 450-status-security (it complete and wrote its own log file as expected, but also claimed the memory)
most of these scripts don't actually do that much, but I still wait a little more than a minute to insure the graph reflected the results of each step.Next step - just to verify, I'll disable 450 in the conf and run the entire "periodic daily"
okay I'm back - at 11:16 on this final graph after system had established flat line, I ran periodic daily (450 disabled)
no lost memory!!
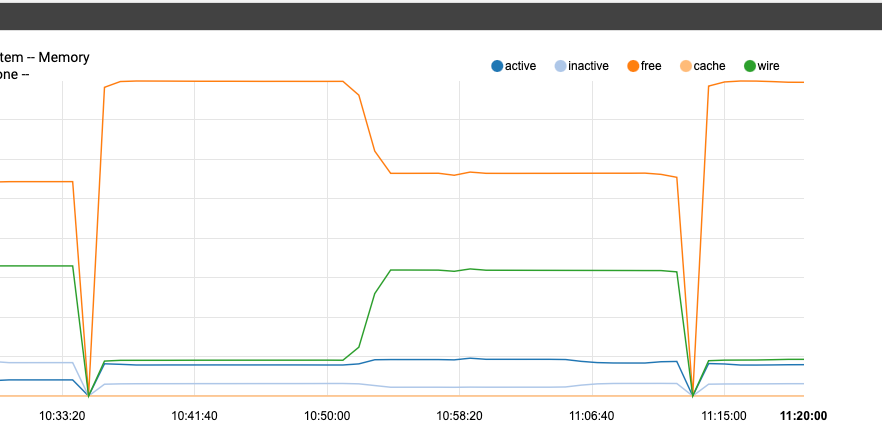
JR
-
@steveits -- I normally do that as well but I made an exception in this case because I was upgrading a netgate box with a very "Plain Jane" (no packages added) config. However, I will definitely follow your advice in the future though!
Roy...
-
@jrey and what does the 450 script do?
-
S SteveITS referenced this topic on
-
S SteveITS referenced this topic on
-
@jrey See Jim's post here: https://forum.netgate.com/topic/177886/23-1-using-more-ram/60 asking for testing.
-
It looks like the /etc/periodic/daily/450.status-security script in turn invokes a bunch of other scripts in /etc/periodic/security and maybe also /usr/local/etc/periodic/security. The real action is in those scripts. The scripts in /etc/periodic/daily all have "copyright 2001 FreeBSD project" in the headers, so I would doubt that they are broken. But they invoke commands like pfctl and ipfw which may be new versions that have bugs...
-
@keyser
"report" on the security of the system.
all of the various scripts just capture various system status and report on them - a daily summary (point in time mostly) as it wereBeyond reporting, I'm looking if it does anything else that might be "required" in this version. I don't think there is, after all it is just a reporting mechanism. These are all OS provided items, pfsense has it's own set of daily, weekly, monthly periodic that are handled on a different cron run. it's unlikely there is anything there that would require this to be complete, because both cron (all 6 actually) are scheduled at the same time.
the 450.status-security script itself just runs whichever scripts are enabled and in the "security" scripts directory - that list is these, (but I need to look at which ones are enabled) or if one of them does something else
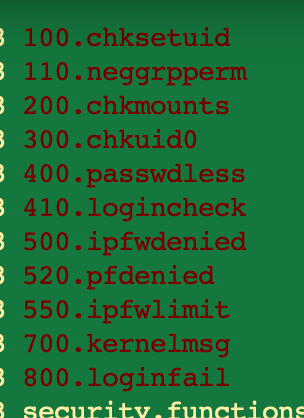
However, because the reports were previously set to mail on a system that does have the required mail bits, no one would have ever seen the reports anyway.
I do now because I had changed that to go to a file in one of my previous posts. (and I didn't enable rotation, because well if I didn't get them before, I don't need them now, but there is an entire mechanism to keep and rotate them as well)I'm looking at the individual security scripts now, but in the log I grabbed when it was showing entries (they also look pretty boring). if they are all this boring, and 500, 520 or 550 are enabled I guess one of them. If they all look "safe" to run, I'll likely do that in step at some point. 520 clearly dumped the rules that are on the firewall, but I didn't notice anything from 500 or 550 so it MAY or MAY NOT be one of them.
I logged entries for 100, 110, (not 200), 300, 400, 410, (not 500), 520, (not 550), 700, 800
so it could also be one of the scripts that didn't seem to log anything if they are enabled.also I wanted to wait until 12:00 schedule for my pfB run. It completed and is represented on this by the little down / up in free on the right side ... so it's not pfB in my configuration. no real change in memory, and it gave it back.
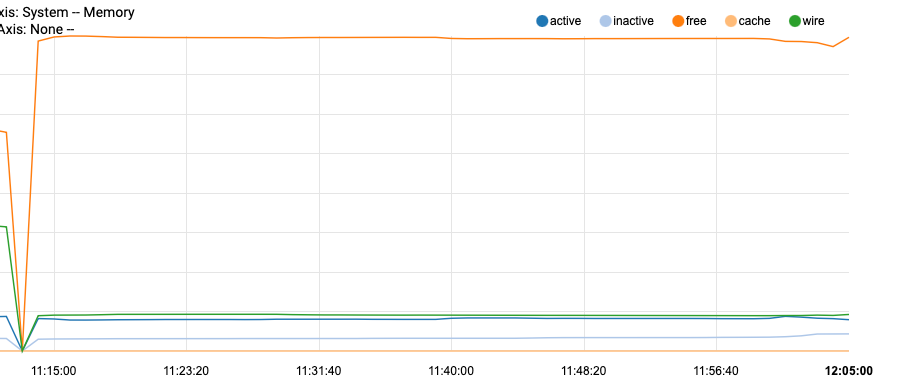
For now, I'm going to run with the report disabled, and I'm not concerned with doing that at this point.
Edit - there is also a 450 under the weekly, monthly that at this point I have not disabled, for testing I've only disabled under daily for now.
Edit 2 - looks like they are all enabled in the conf (including like the other daily batch, some scripts that don't exist)
JR
-
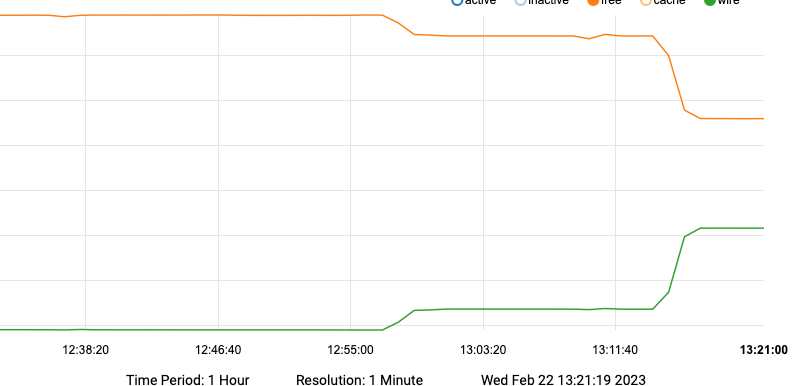
So the first small change is running 100, 110
from there it flat lined for most of the additional logs.
then the huge drop, here are the stepssecurity scripts all are enabled per conf
100 small impact
110 additional small impact
let it display flat line it did just to confirm
200 no impact (but no output either)
still flat lined
300 no impact
still flat lined
400 no impact
still flat lined
410 no impact
still flat lined
500 no impact (no output)
still flat lined
520 no impact (no output)
still flat lined
550 no impact
still flat lined
700 no impact
still flat lined
800 no impact
all these we are now at the 3:14 time stamp where the memory now shows the huge changeI did this because in the log file from earlier there are activities logged immediately after the output from 800 that did not appear when it finished on this test.
so I ran the entire process as "periodic security" and there it is
the additional checks that are performed and logged outside of the individual scripts are logged shown below when doing the periodic security repeated all of the output I had just witnessed from running the scripts individually and then added this
it was immediately after 800 logged login failures that memory disappeared. (these additional items are likely handled in the base script, I haven't checked yet) it looks like these specific checks are the culprit.
[23.01-RELEASE][ .... ]/etc/periodic/security: ./800.loginfail
login failures:
[23.01-RELEASE][ .... ]/etc/periodic/security: periodic security
.... output same as all individual scripts up to this point
picking up in periodic security with this line and remainder of outputlogin failures:
Checking for security vulnerabilities in base (userland & kernel):
Database fetched: Wed Feb 22 08:27:08 EST 2023
0 problem(s) in 0 installed package(s) found.
0 problem(s) in 0 installed package(s) found.Checking for packages with security vulnerabilities:
Database fetched: Wed Feb 22 08:27:08 EST 2023
curl-7.85.0Checking for packages with mismatched checksums:
-- End of security output --
EDIT:
running
periodic security weekly
and
periodic security monthly
produces no different output, and does not add additional from that above after running daily (so the change is a one time impact.)
The output is not really anything of interest so for now I have also disabled the 450 report in both weekly and monthly sections. of conf. -
Yup I went a little further in testing, and pin pointed the exact step.
But I also then just disabled the 450.status-security in the config.
as it was configured out of box as (mail root) no one would ever see the output anyway.
following through I also sent the output to log files so in case I might like to look at it one day (NOT)this thread details all the steps I took and at what point it breaks, the settings quoted on the reference thread will do the same as disabling 450.status-security
there is nothing to see there anyway, especially as configured out of box.security_status_baseaudit_enable="NO"
security_status_pkg_checksum_enable="NO"
security_status_pkgaudit_enable="NO" -
@jrey said in 1100 upgrade, 22.05->23.01, high mem usage:
Yup I went a little further in testing, and pin pointed the exact step.
But I also then just disabled the 450.status-security in the config.
as it was configured out of box as (mail root) no one would ever see the output anyway.
following through I also sent the output to log files so in case I might like to look at it one day (NOT)this thread details all the steps I took and at what point it breaks, the settings quoted on the reference thread will do the same as disabling 450.status-security
there is nothing to see there anyway, especially as configured out of box.security_status_baseaudit_enable="NO"
security_status_pkg_checksum_enable="NO"
security_status_pkgaudit_enable="NO"I am active on that other thread too, but have not had a chance to perform those steps yet. Did it resolve the issue when you force the daily periodical post reboot?
