PfSense Random but periodical Latency
-
Hello to the community !
I’m new here, and i have to say first that I have read all the rules before posting (hope did it well).
I have a random but periodical latency with my virtualized PfSense, and all topics about latency didn’t help me to solve my problem.A draw of my network topology is attached.
Here is my problem, I hope I will find some help to solve it.
On my PfSense I have a LAN interface (A network), three OPT interfaces (B,C,D networks), and a WAN interface (E network).
From A Network, I’m connecting through RDP and HTTP/S to servers in B,C,D and even in E networks.
Sometimes, about one time per hour, when I an connecting to servers whatever the protocol (with FQDN or IP address) , it takes from 3 to 30 seconds to connect to RDP or display web pages.
And after that If I refresh or reconnect it works instantly.
It looks like a cache or similar is fulfilling and flushing periodically.
Other times it works instantly.But one thing is always the same and never change: all pings, from and to all different networks computers are under 1ms.
I precise my very basic configuration:
• Few firewall rules (already tried all open to troubleshoot)
• No bandwith limitation or other
• No vlans
• Already have deactivated all hardware offloadings
• VM Tools packet is of course installed
• No DNS Resolving by PfSenseOn logs or monitoring sides :
• No packet loss or collisions on all interfaces
• No system error or otherMy PfSense VM is made as recommended by Netgate, on ESX 7 with VMxNet3 adapters.
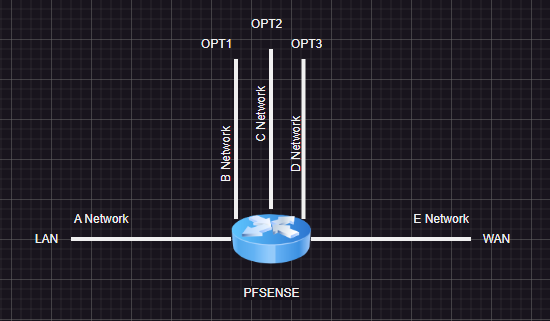
Did anyone already faced this case?
Thanks for any help.
Cisco
-
@cisco said in PfSense Random but periodical Latency:
Sometimes, about one time per hour, when I an connecting to servers whatever the protocol (with FQDN or IP address) , it takes from 3 to 30 seconds to connect to RDP or display web pages.
Just a shot in the dark :
When you run
grep 'start' /var/log/resolver.logdo you see the same pattern ?
Another one :
When you exclude the VM, install pfSense "bare metal", do you see the same thing ? -
@gertjan said in PfSense Random but periodical Latency:
install pfSense "bare metal"
Hello Gertjan, thanks for reply.
When i run the given command i get the same pattern, but no entries since 21th April ; probably the day i disabled DNS resolver.
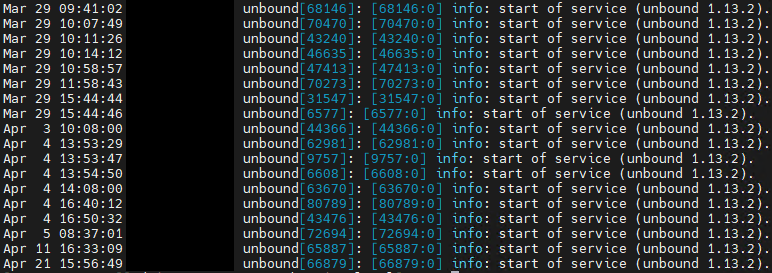
For the second shot, i unfortunatly dont have yet the necessary equipment to restore my configuration on a physical machine (not enough network cards).
I keep in mind to do this asap to see if my pfsense setup is at fault or if it is VM setup.
-
Do you see any blocked traffic in the firewall log when this happens?
Are the hosts you are connecting between using DHCP?
Ultimately I would try to capture it in a packet capture to see if the firewall is failing to pass it or the host is failing to respond.
Steve
-
@stephenw10
Hello, thanks for replying.Alredy checked the firewall logs, no block ; all rules are working as expected.
There is no host with DHCP config, all are with a static IP address. All configs were checked (IP, mask, gw). Talking about the basics, the DNS side was also investigated with no issue.
I will try to make a packet capture next time it happens and give feedback.
One thing i noticed, the PfSense WebUI is also impacted by this random latency...
-
Hmm so just between a host and the pfSense interface IP in the same subnet? It can take 30s to respond?
Nothing is logged in pfSense during that time? I could imagine it running a filter reload perhaps. Or maybe something else introducing a temporary conflict of some kind. I would expect a log entry for either of those events.Steve
-
@stephenw10
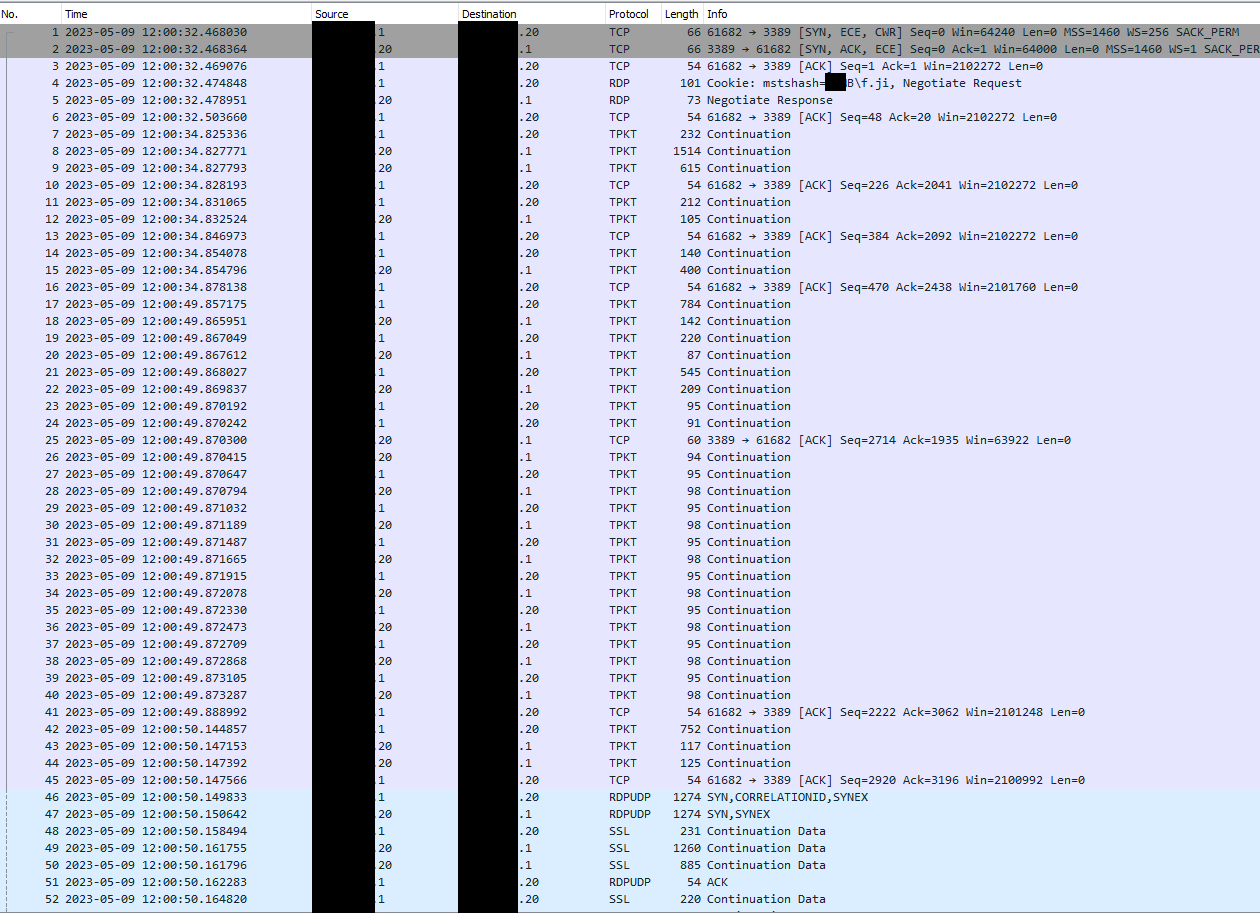
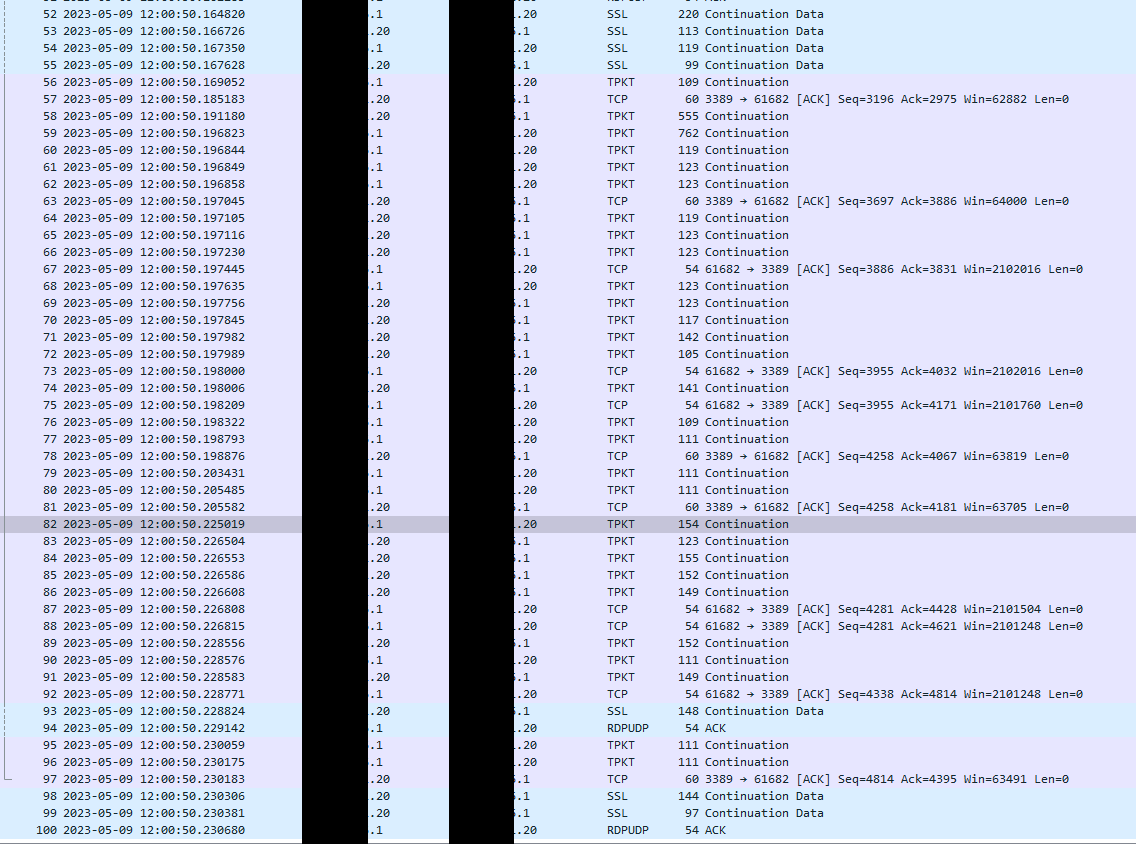
Here is the packet capture on the interface of the destination network with source filter on IP source address.
This capture is during a RDP connection from X.X.X.1 to Y.Y.Y.20
The latency is visible, nearly 28 seconds to establish RDP connection
-
Ok, so it looks like the largest gap there is beween packets 16 and 17. Both those are from .1 to .20 but that doesn't look unusual comapred with, for exmaple, packets 10 and 11.
Where was that pcap taken?
-
@stephenw10
The pcap was taken from pfsense/diagnostic/packet capture"
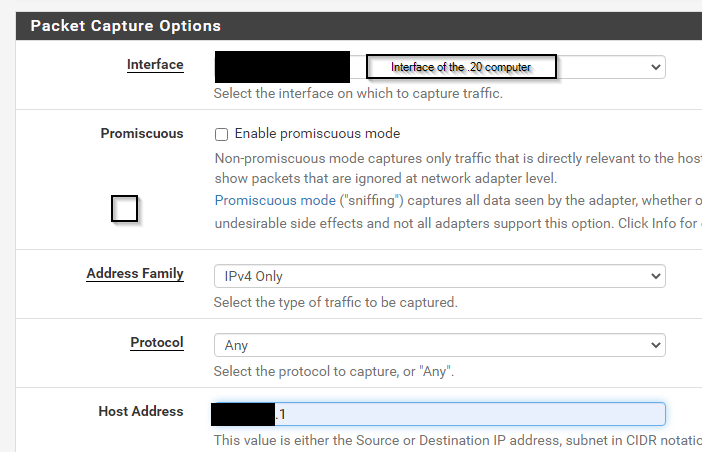
I downladed it and opened in Wireshark
Here is the detail of packet 17 if it could help :
Frame 17: 784 bytes on wire (6272 bits), 784 bytes captured (6272 bits)
Encapsulation type: Ethernet (1)
Arrival Time: May 9, 2023 12:00:49.857175000 Paris, Madrid (heure d’été)
[Time shift for this packet: 0.000000000 seconds]
Epoch Time: 1683626449.857175000 seconds
[Time delta from previous captured frame: 14.979037000 seconds]
[Time delta from previous displayed frame: 14.979037000 seconds]
[Time since reference or first frame: 17.389145000 seconds]
Frame Number: 17
Frame Length: 784 bytes (6272 bits)
Capture Length: 784 bytes (6272 bits)
[Frame is marked: False]
[Frame is ignored: False]
[Protocols in frame: eth:ethertype:ip:tcp:tpkt]
[Coloring Rule Name: TCP]
[Coloring Rule String: tcp]
Ethernet II, Src: VMware_bb:64:02 (00:50:56:bb:64:02), Dst: VMware_bb:92:02 (00:50:56:bb:92:02)
Destination: VMware_bb:92:02 (00:50:56:bb:92:02)
Address: VMware_bb:92:02 (00:50:56:bb:92:02)
.... ..0. .... .... .... .... = LG bit: Globally unique address (factory default)
.... ...0 .... .... .... .... = IG bit: Individual address (unicast)
Source: VMware_bb:64:02 (00:50:56:bb:64:02)
Address: VMware_bb:64:02 (00:50:56:bb:64:02)
.... ..0. .... .... .... .... = LG bit: Globally unique address (factory default)
.... ...0 .... .... .... .... = IG bit: Individual address (unicast)
Type: IPv4 (0x0800)
Internet Protocol Version 4, Src: X.X.X.1, Dst: Y.Y.Y.20
0100 .... = Version: 4
.... 0101 = Header Length: 20 bytes (5)
Differentiated Services Field: 0x02 (DSCP: CS0, ECN: ECT(0))
0000 00.. = Differentiated Services Codepoint: Default (0)
.... ..10 = Explicit Congestion Notification: ECN-Capable Transport codepoint '10' (2)
Total Length: 770
Identification: 0x1f87 (8071)
010. .... = Flags: 0x2, Don't fragment
0... .... = Reserved bit: Not set
.1.. .... = Don't fragment: Set
..0. .... = More fragments: Not set
...0 0000 0000 0000 = Fragment Offset: 0
Time to Live: 127
Protocol: TCP (6)
Header Checksum: 0x31da [validation disabled]
[Header checksum status: Unverified]
Source Address: X.X.X.1
Destination Address: Y.Y.Y.20
Transmission Control Protocol, Src Port: 61682, Dst Port: 3389, Seq: 470, Ack: 2438, Len: 730
Source Port: 61682
Destination Port: 3389
[Stream index: 0]
[Conversation completeness: Incomplete, DATA (15)]
[TCP Segment Len: 730]
Sequence Number: 470 (relative sequence number)
Sequence Number (raw): 2921877759
[Next Sequence Number: 1200 (relative sequence number)]
Acknowledgment Number: 2438 (relative ack number)
Acknowledgment number (raw): 1197571422
0101 .... = Header Length: 20 bytes (5)
Flags: 0x018 (PSH, ACK)
Window: 8210
[Calculated window size: 2101760]
[Window size scaling factor: 256]
Checksum: 0xb6f1 [unverified]
[Checksum Status: Unverified]
Urgent Pointer: 0
[Timestamps]
[Time since first frame in this TCP stream: 17.389145000 seconds]
[Time since previous frame in this TCP stream: 14.979037000 seconds]
[SEQ/ACK analysis]
[iRTT: 0.001046000 seconds]
[Bytes in flight: 730]
[Bytes sent since last PSH flag: 730]
TCP payload (730 bytes)
TPKT - ISO on TCP - RFC1006
Continuation data: 17030302d500000000000000021b4a28f52b1952cc140ba2ecd98b9605a5f53ee9b469b1… -
Ok, then I'd try to capture the same thing on the interface closest to the .1 host and see if that shows traffic coming in without the large time gap. Or traffic coming it that is not passed to the other interface.
-
@stephenw10
I reached to capture on the other interface, filtering on .20.
I am not a pcap expert...thanks a lot for your time and help.
Frame 6 semmes to be a bad tcp frame, and still gap between frame 16 and 17.
Tell me if you need a specific frame details.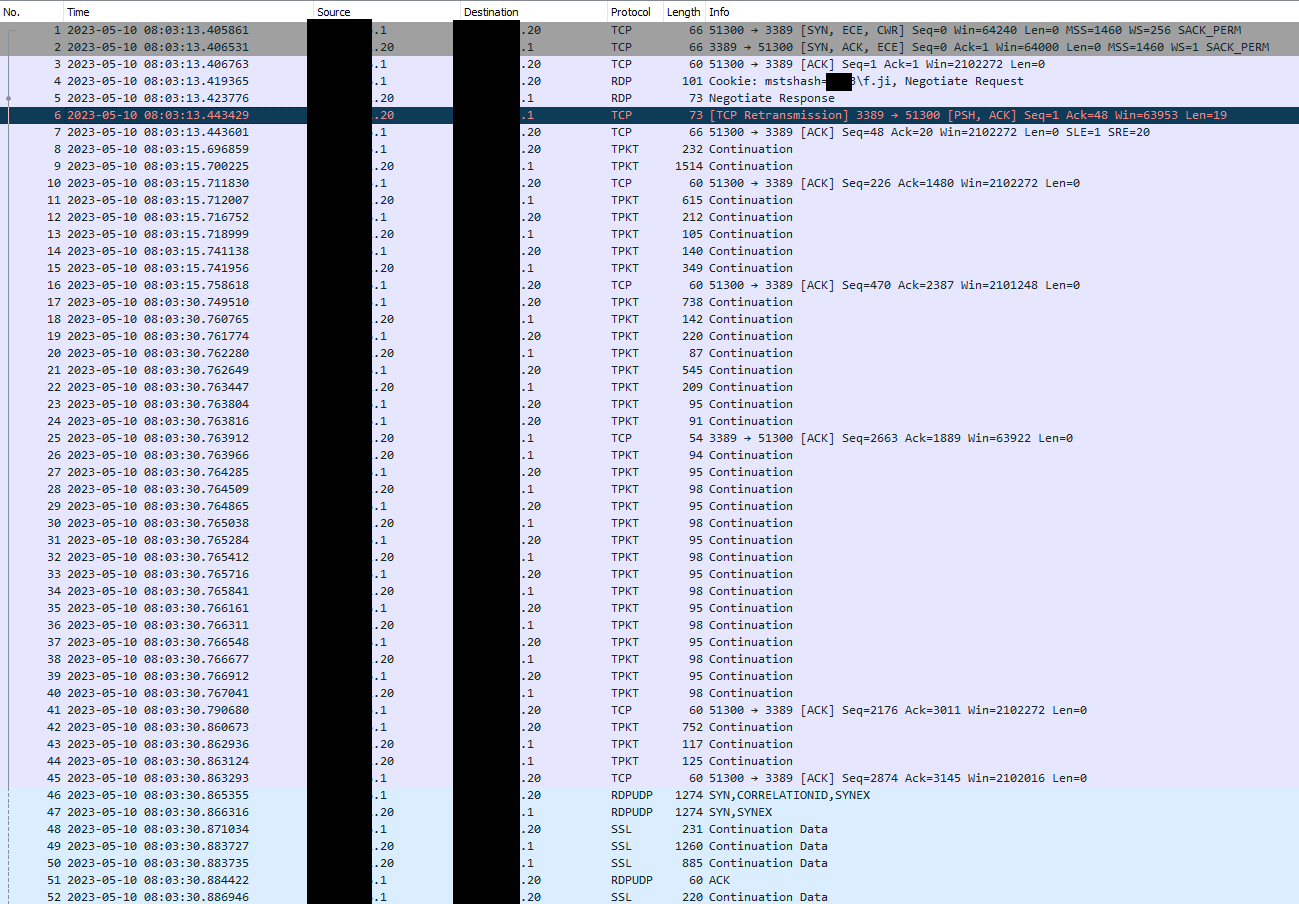
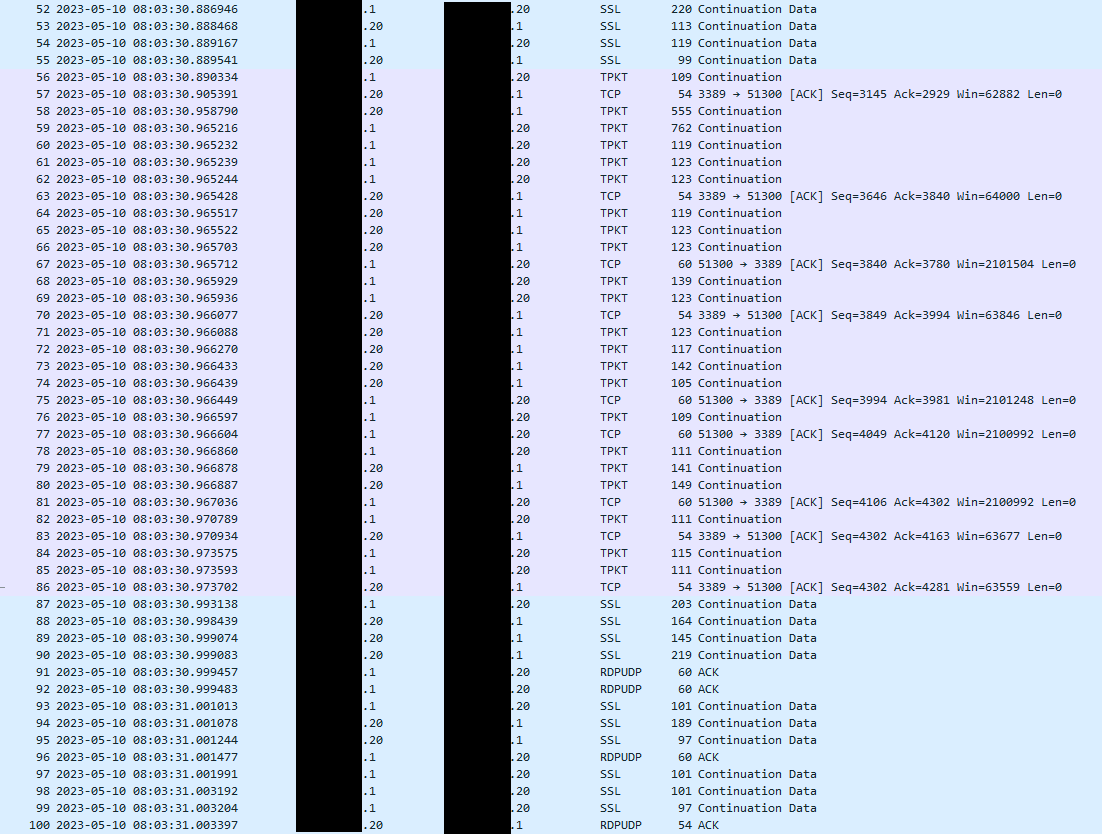
-
Yeah still a 15s gap between packets 16 and 17 and nothing showing from .20.
It doesn't appear to be pfSense not forwarding the traffic. It's just not arriving.
Perhaps .20 is not receiving that ACK for some reason. We know pfSense is sending it though from the other pcap. You might check the MAC addresses on the packet 16, the ACK. -
@stephenw10
In frame 16 :
Source MAC Address is .1 computer's one, as intended.
Destination MAC Address is the mac of pfsense interface in .1 computer's lan, as well.
Source IP is of course X.X.X.1 et destination IP Y.Y.Y.20.Comparing a pcap with latency and an other without latency i noticed in the first one a lot of ACK, looks like .1 is resending ACK again and again.
So i am on the delayed ACK side to check if there is something wrong, but for now nothing. -
Hmm, lots of ACKs like that could just be a much smaller TCP window. You can see a pretty big differences between the window sizes between what .20 is sending and .1.
-
@stephenw10
Yes that might be that, but the thing is that .1 is my server from wich i connect to many others through pfsense .
the .20 is an exemple, it is the same for each server of pfsense's networks over RDP and HTTPS. Moreover, all my servers are Windows server 2019 issued from the same VM ware Template. That's why i wonder why they could have different TCP windows.I checked another time my vswitchs security config, all is accepted except for the WAN interface port group.
I also checked again my pfsense VM config, still seems ok as the prerequisites. -
I assume you don't see any latency when the server and client are in the same subnet?
-
I have only this server in this network, with pfsense interface of course.
I will try this asap and let you know. -
@stephenw10
Hello,
I put another server VM .2 in the same subnet as .1 server and after many attempts i reached to reproduce the latency with pcap and faced the same ACK latency ; so the PfSense is not in charge...i thought that becasue latency appeared when i set it up, weird coincidency.
I think i have to investigate on my vmnic configuration witch was made by a supplier, because .1 and .2 are on 2 differents ESXi hosts, despite that i am up to date on all drivers, patchs and others on my VMWare Infrastructure and on my core switch.
Thanks a lot for your help and time.