Gateway monitoring: RRD graph says dip, but pings say all is well
-
Hi all,
In the Monitoring -> RRD graph for WAN ipv4 there is a dip and pfsense reports packet loss:
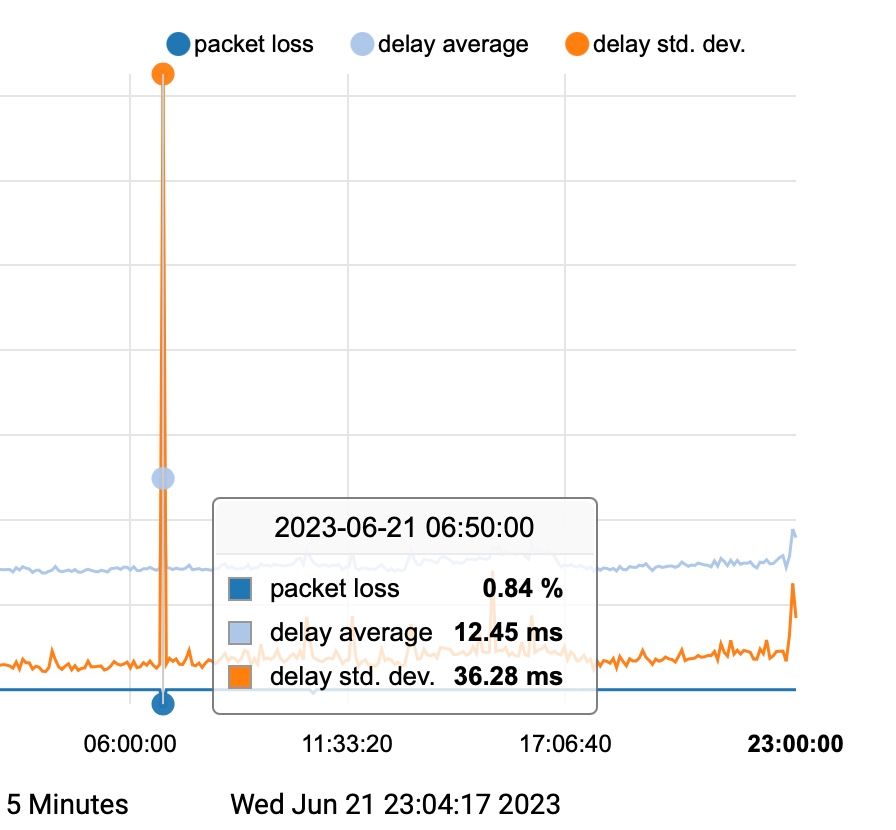
I have been running a continuous ping loop to google.com (ipv4 and ipv6) every minute and all seems well during the time of the dip, see below. So my question is: what could be going on here? I see several of these during the week, both on ipv4 and ipv6.
Thanks!
230621_06.45.17: IPv6: 2a00:1450:400e:811::200e OK 230621_06.46.17: IPv4: 142.250.179.174 OK 230621_06.46.17: IPv6: 2a00:1450:400e:811::200e OK 230621_06.47.17: IPv4: 142.250.179.174 OK 230621_06.47.17: IPv6: 2a00:1450:400e:811::200e OK 230621_06.48.17: IPv4: 142.250.179.174 OK 230621_06.48.17: IPv6: 2a00:1450:400e:811::200e OK 230621_06.49.18: IPv4: 142.250.179.174 OK 230621_06.49.18: IPv6: 2a00:1450:400e:811::200e OK 230621_06.50.18: IPv4: 142.250.179.174 OK 230621_06.50.18: IPv6: 2a00:1450:400e:811::200e OK 230621_06.51.18: IPv4: 142.250.179.174 OK 230621_06.51.18: IPv6: 2a00:1450:400e:811::200e OK 230621_06.52.18: IPv4: 142.250.179.174 OK 230621_06.52.18: IPv6: 2a00:1450:400e:811::200e OK 230621_06.53.18: IPv4: 142.250.179.174 OK 230621_06.53.18: IPv6: 2a00:1450:400e:811::200e OK 230621_06.54.18: IPv4: 142.250.179.174 OK 230621_06.54.18: IPv6: 2a00:1450:400e:811::200e OK 230621_06.55.18: IPv4: 142.250.179.174 OK 230621_06.55.18: IPv6: 2a00:1450:400e:811::200e OK 230621_06.56.19: IPv4: 142.250.179.174 OK 230621_06.56.19: IPv6: 2a00:1450:400e:811::200e OK 230621_06.57.19: IPv4: 142.250.179.174 OK 230621_06.57.19: IPv6: 2a00:1450:400e:811::200e OK 230621_06.58.19: IPv4: 142.250.179.174 OK 230621_06.58.19: IPv6: 2a00:1450:400e:811::200e OK 230621_06.59.19: IPv4: 142.250.179.174 OK 230621_06.59.19: IPv6: 2a00:1450:400e:811::200e OK 230621_07.00.19: IPv4: 142.250.179.174 OK 230621_07.00.19: IPv6: 2a00:1450:400e:811::200e OK 230621_07.01.19: IPv4: 142.250.179.174 OK 230621_07.01.19: IPv6: 2a00:1450:400e:811::200e OK 230621_07.02.19: IPv4: 142.250.179.174 OK 230621_07.02.19: IPv6: 2a00:1450:400e:811::200e OK 230621_07.03.19: IPv4: 142.250.179.174 OK 230621_07.03.19: IPv6: 2a00:1450:400e:811::200e OK 230621_07.04.20: IPv4: 142.250.179.174 OK 230621_07.04.20: IPv6: 2a00:1450:400e:811::200e OK 230621_07.05.20: IPv4: 142.250.179.174 OK 230621_07.05.20: IPv6: 2a00:1450:400e:811::200e OK 230621_07.06.20: IPv4: 142.250.179.174 OK 230621_07.06.20: IPv6: 2a00:1450:400e:811::200e OK 230621_07.07.20: IPv4: 142.250.179.174 OK 230621_07.07.20: IPv6: 2a00:1450:400e:811::200e OK 230621_07.08.20: IPv4: 142.250.179.174 OK 230621_07.08.20: IPv6: 2a00:1450:400e:811::200e OK 230621_07.09.20: IPv4: 142.250.179.174 OK 230621_07.09.20: IPv6: 2a00:1450:400e:811::200e OK 230621_07.10.20: IPv4: 142.250.179.174 OK 230621_07.10.20: IPv6: 2a00:1450:400e:811::200e OK 230621_07.11.20: IPv4: 142.250.179.174 OK 230621_07.11.20: IPv6: 2a00:1450:400e:811::200e OK 230621_07.12.21: IPv4: 142.250.179.174 OK 230621_07.12.21: IPv6: 2a00:1450:400e:811::200e OK 230621_07.13.21: IPv4: 142.250.179.174 OK 230621_07.13.21: IPv6: 2a00:1450:400e:811::200e OK 230621_07.14.21: IPv4: 142.250.179.174 OK 230621_07.14.21: IPv6: 2a00:1450:400e:811::200e OK 230621_07.15.21: IPv4: 142.250.179.174 OK 230621_07.15.21: IPv6: 2a00:1450:400e:811::200e OK -
What IP is the gateway monitoring using? The same one?
A single ping once a minute might not hit the same issues. Perhaps the route changed but the monitoring pings held the same route.
Steve
-
@stephenw10 said in Gateway monitoring: RRD graph says dip, but pings say all is well:
What IP is the gateway monitoring using? The same one?
A single ping once a minute might not hit the same issues. Perhaps the route changed but the monitoring pings held the same route.
Steve
Hi Steve,
In pfSense - gateway - gateway monitoring IP I left the IP field empty so we are not pinging the same route. However, according to the Google ping I deployed, the cable line has been up the whole time so it would seem that pfSense is reporting a false positive. Would you agree? -
@Cabledude
Again, pinging a different host once a minute is far a way from being prestigious. It could be that your ping script didn't catch the issue, because it was as short.The gateway monitoring ping the gateway or even the stated monitoring IP twice a second by default (as far as I know).
It's also possible that the gateway didn't response for a short period of time for whatever reason.
Check out in System Logs > Gateways what exactly happened and how long the drop out lasted.If you want to analyze and compare, what you see in the pfSense logs, ping the same IP as pfSense with the same interval.
You can also state alternative monitoring IPs like these ones of google.com. -
Yes, by default the gateway monitoring pings the gateway IP. It's entirely possible the gateway stopped responding to ping at that time or was under some far greater load causing it to add latency but was still routing traffic through it no problem. Replying to pings is usually very low priority!
You should set the gateway monitoring to something further upstream like 8.8.8.8 or your ISPs DNS server to get a better idea of real connectivity.Steve