PfSense CE 2.7 --- Power Savings Setting 'Minimum' does not seem to work like before
-
Dear developers and users!
I just upgraded from CE 2.6 to 2.7 yesterday, as recommended, I uninstalled all packages and did a reboot before upgrading. Everything went flawlessly, thanks for that.Today I noticed the following: In 'Power Savings' I chose 'Minimum' for all entries, also in 2.5-2.6. My HP Prodesk SFF with Intel(R) Core(TM) i3-7100 CPU @ 3.90GHz used to run at 800MHz with these settings. Never once it increased the frequency, it was 'planted' at 800MHz.
Now with 2.7 it acts more like an adaptive setting. Power consumption is 50% higher. It goes up to 3900MHz and CPU is @60°C occasionally (before: max. 40°C). Strangely enough, my traffic somewhat decreased over the last weeks.
Is this a known issue, do you have any suggestions how I can resolve this? Sorry if posted in the wrong category,
Thanks,
Mario.
-
FreeBSD 14+ , uses some other powersettings if you have a "Newer CPU" ...
Have a look in the thread here.
https://forum.netgate.com/post/1108902/Bingo
-
@bingo600 said in PfSense CE 2.7 --- Power Savings Setting 'Minimum' does not seem to work like before:
https://forum.netgate.com/post/1108902
Thanks a lot for your quick answer. I will try this and report back.
Mario.
-
Well, that was a quick solution. Thanks a lot. Here's what I did:
In System Tunable I created the following entries, one for each CUP (=core):

I did a reboot, but applying the changes seems to work without it. It does not run as low a freq as before, but for now that's ok for me.
Thanks @bingo600 ,
Mario.
-
For completeness: the maximum value for power saving in dev.hwpstate_intel is 100 (https://man.freebsd.org/cgi/man.cgi?hwpstate_intel). This setting does not keep the freq at 800MHz as the 'Minimum' setting in 2.6 did. It's more like 1100-1440MHz-ish, playing a YT-video to generate some traffic. So my guess is, there is still room for improvement,
Mario.
-
The i3-7100 has 4 "cores" as HT counts.
I made entries for cpu0 to cpu3

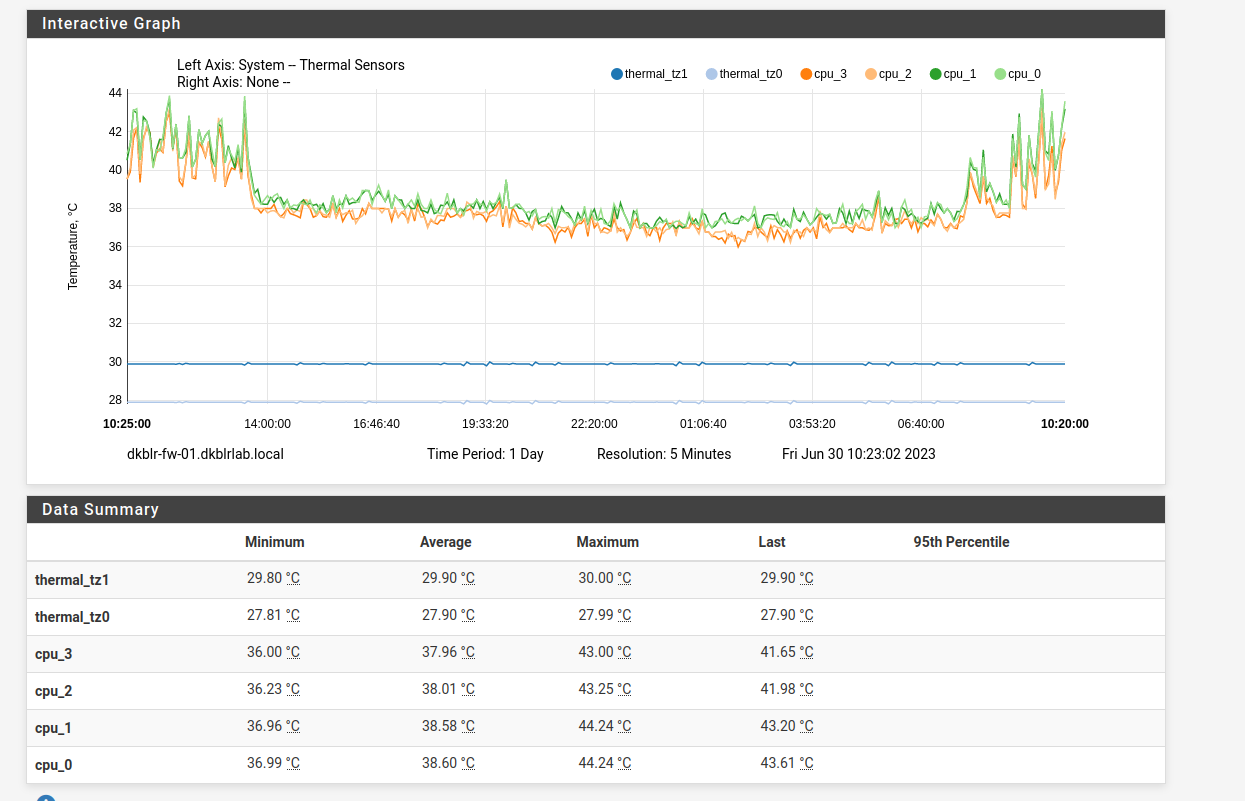
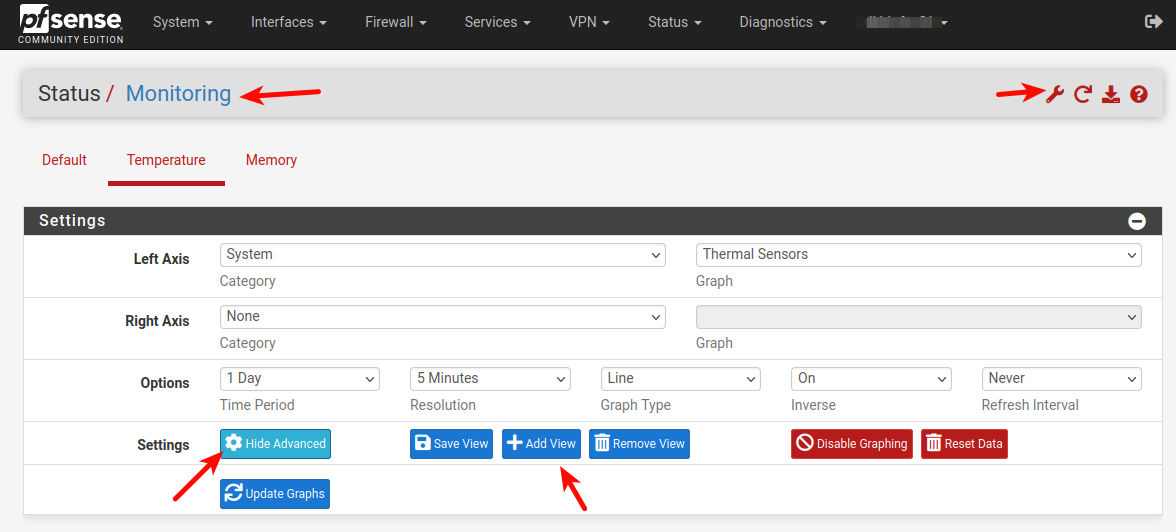
To show that nice Temp Graph
Goto Status -> Monitoring
Press the Wrench to see/change settings (if not already shown)
Press Display Advanced
Fill the settings (System + Thermal)
Press "+Add View" , and give the View a "meaningfull" name.
It will take some time for the graph to show , especially if "1 Day" is selected.
/Bingo
-
@bingo600 thanks, I know. Mine has HT turned off, power consumption is even lower that way:

Thanks for the graphing stuff, I did not know that,
Mario.
-
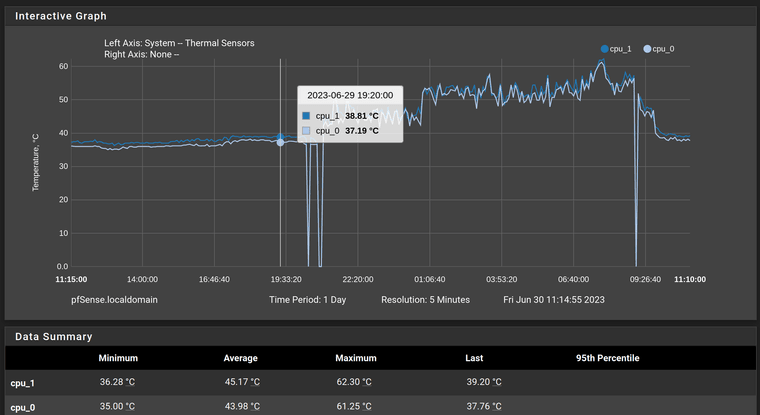
Here's the graph from the last 24hours, sort of a proof of what happened. Even the downtimes are visible (upgrade yesterday and reboot today):

-
That's kind'a as expected , based on my experience when upgrading to Plus 23.01
That's also based on FreeBSD v14My home boxes uses i5-5250U , that CPU is to old to use the new "Speed/Power stuff" so those behaved as usual, using the "Old Power settings"
But my i3 test box was "hit" , and was what i described in the thread i pointed to./Bingo
-
E emefff referenced this topic on