SG2100 max 'hanging' until reboot
-
It appears (anecdotally) that since 22.05 we have had a number of occasions where various 2100 max just stop passing traffic and require a reboot to bring back to life.. trying to establish if console still responsive but syslog and internal monitoring simply stop logging (charts all drop to zero) until they are rebooted (has happened multiple times to multiple devices now). Doesn't appear to be a pattern and mbuf or state tables don't appear to be filling up etc. Happens at various times but usually overnight and all devices are remote so not easy to diagnose as the sites rely on Internet so usually a quick reboot is performed to resolve the issue...
Any suggestions on what else to look for? Is there anyway to see temperature history or otherwise of the ssd as I've previously seen a 'hot' ssd cause a 4100 max to 'lock up' so thinking perhaps this is happening? Could power spikes/issues cause it? Can be weeks between isssues or even months and some devices never appear to have had the issue (40+ in the field) but those that do seem to repeat it after a while... trying to establish any commonality environment wise between the sites/devices with the issues too...
-
So unclear yet if the console is still responding when this happens or if it shows any errors there?
Is this 2100 running from an SSD? A failing SSD can present like that but you would usually see a load of drive errors on the console.
Does it stop passing traffic at the same time as logging stops or some time after that? A failing drive that stops responding will usually stop all logging but running services continue until they require disk access.
Steve
-
Yes, still unclear if console stops responding but i suspect it might...
Hopefully be able to confirm next time it occurs.
All are max variants so yes running on ssd.
Traffic and logs stop at the same time, we use zabbix and our monitoring stops at the same time logs do as well as reports from the site's
-
Are you checking the connectivity internally with Zabbix? Like from the LAN side to the 2100 directly? If it's remote it could just be losing the WAN or default route.
-
@stephenw10
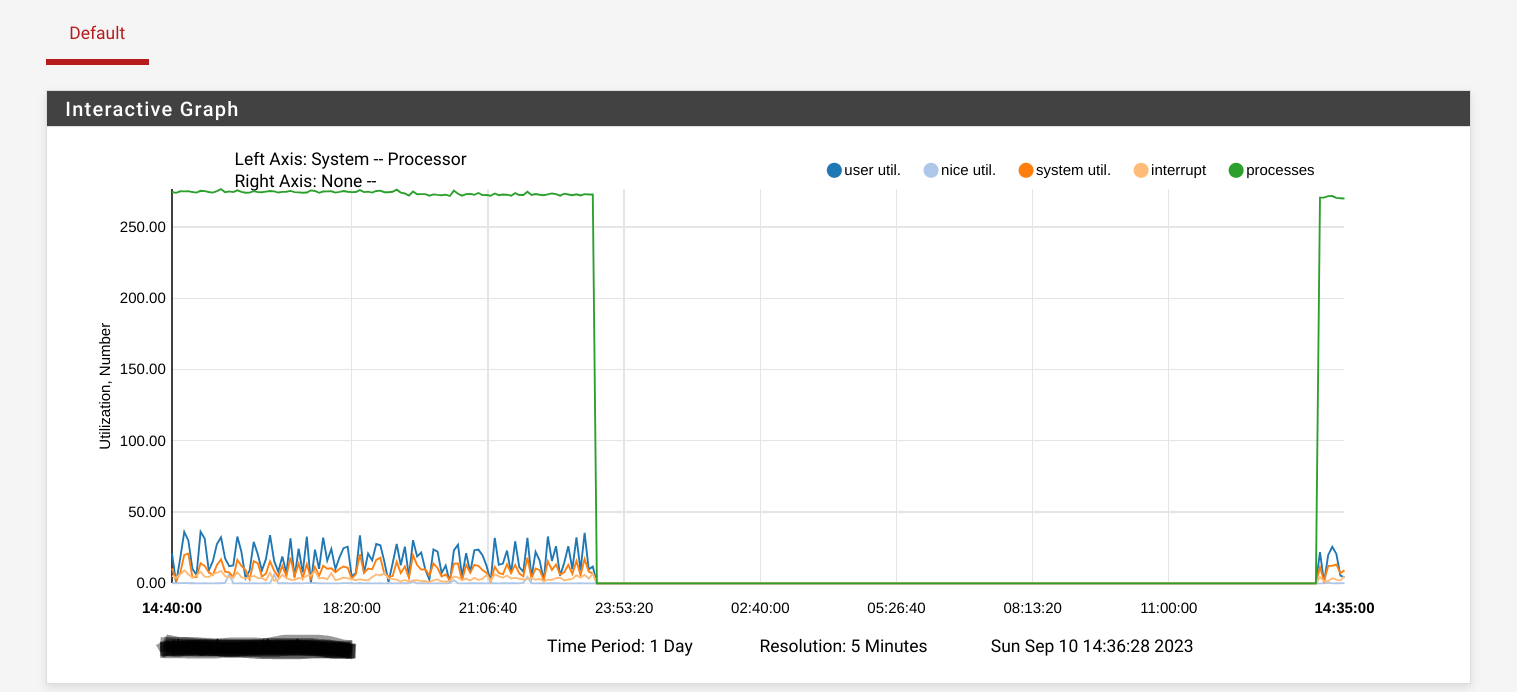
Zabbix is remote so that could be possible - it does seem though that LAN wise (a number of vlans though so could potentially be something else there too) nothing is available too.. this is from 'status - monitoring' on the latest affected unit...
-
Sorry should have made it clear the drop in the graph corresponds to when traffic stopped passing (zabbix alert received too) and the jump back up is when it was rebooted and started working again
-
Mmm, yeah that doesn't look good. Checking the console would be the first thing I'd do there.
-
Hopefully we don't have a reoccurrence (although this device has had it happen twice in two weeks now) but should have console connected to the 5 known devices this seems to happen to.. all appear to have the same symptoms so hopefully capturing one will provide answers for all...