pfSense internet connection fails and needs manual restart of server.
-
Hi. I suddenly discovered that there was no internet. On restarting, the internet came up again. This has happened a couple of times: it will need me to manually power down and restart the machine before the internet service is restored.
I got the following message on the dashboard:
On clicking, I got a long text file, so I searched for "error" and found the following:
ipw_bss: You need to read the LICENSE file in /usr/share/doc/legal/intel_ipw.LICENSE.
ipw_bss: If you agree with the license, set legal.intel_ipw.license_ack=1 in /boot/loader.conf.
module_register_init: MOD_LOAD (ipw_bss_fw, 0xffffffff80748430, 0) error 1
ipw_ibss: You need to read the LICENSE file in /usr/share/doc/legal/intel_ipw.LICENSE.
ipw_ibss: If you agree with the license, set legal.intel_ipw.license_ack=1 in /boot/loader.conf.
module_register_init: MOD_LOAD (ipw_ibss_fw, 0xffffffff807484e0, 0) error 1
ipw_monitor: You need to read the LICENSE file in /usr/share/doc/legal/intel_ipw.LICENSE.
ipw_monitor: If you agree with the license, set legal.intel_ipw.license_ack=1 in /boot/loader.conf.
module_register_init: MOD_LOAD (ipw_monitor_fw, 0xffffffff80748590, 0) error 1
iwi_bss: You need to read the LICENSE file in /usr/share/doc/legal/intel_iwi.LICENSE.
iwi_bss: If you agree with the license, set legal.intel_iwi.license_ack=1 in /boot/loader.conf.
module_register_init: MOD_LOAD (iwi_bss_fw, 0xffffffff807659c0, 0) error 1
iwi_ibss: You need to read the LICENSE file in /usr/share/doc/legal/intel_iwi.LICENSE.
iwi_ibss: If you agree with the license, set legal.intel_iwi.license_ack=1 in /boot/loader.conf.
module_register_init: MOD_LOAD (iwi_ibss_fw, 0xffffffff80765a70, 0) error 1
iwi_monitor: You need to read the LICENSE file in /usr/share/doc/legal/intel_iwi.LICENSE.
iwi_monitor: If you agree with the license, set legal.intel_iwi.license_ack=1 in /boot/loader.conf.
module_register_init: MOD_LOAD (iwi_monitor_fw, 0xffffffff80765b20, 0) error 1
Scrolling downwards, I see the following (too):
acpi_syscontainer0: <System Container> on acpi0
apei0: <ACPI Platform Error Interface> on acpi0
Further down:
<118><jemalloc>: jemalloc_extent.c:1195: Failed assertion: "p[i] == 0"


Fatal trap 12: page fault while in kernel mode

Fatal trap 12: page fault while in kernel mode
cpuid = 2; apic id = 02
cpuid = 5; apic id = 05
fault virtual address	= 0x78
fault code		= supervisor read data, page not present
instruction pointer	= 0x20:0xffffffff8362ca55
stack pointer	        = 0x28:0xfffffe00a354a140
Fatal double fault
rip 0xffffffff8126d51f rsp 0xfffffe00a3343688 rbp 0xfffffe00a3349220
frame pointer	        = 0x28:0xfffffe00a354a160
code segment		= base 0x0, limit 0xfffff, type 0x1b
rax 0xffffffff80d2f2e1 rdx 0xffffffff84016384 rbx 0xfffffe000aafd1c0
rcx 0xfffffe000ab300c0 rsi 0xfffffe0070404720 rdi 0xffffffff8303ef30
fault virtual address	= 0xfffffb2d37dc8a78
r8 0xfffffe0070404c40 r9 0xfffffe00a3348000 r10 0
r11 0x7ff705c8 r12 0xfffffe0070404e20 r13 0xffffffff8309d730
r14 0xfffffe000adb5660 r15 0xffffffff83092d88 rflags 0x10046
cs 0x20 ss 0x28 ds 0x3b es 0x3b fs 0x13 gs 0x1b
fsbase 0 gsbase 0xffffffff84016000 kgsbase 0
cpuid = 6; apic id = 06
panic: double fault
cpuid = 6
time = 1695448028
KDB: enter: panic
�������������������������������������������������������������������������������������panic.txt�������������������������������������������������������������������������������������������0600����0�������0�������14����������14503475734�  7147� �����������������������������������������������������������������������������������������������������ustar���root����������������������������wheel������������������������������������������������������������������������������������������������������������������������������������������������������������������������������������������������������������������double fault��������������������������������������������������������������������������������������������������������������������������������������������������������������������������������������������������������������������������������������������������������������������������������������������������������������������������������������������������������������������������������������������������������������������������������������������������������������������������������������������������������������������version.txt�����������������������������������������������������������������������������������������0600����0�������0�������441���������14503475734�  7626� �����������������������������������������������������������������������������������������������������ustar���root����������������������������wheel������������������������������������������������������������������������������������������������������������������������������������������������������������������������������������������������������������������FreeBSD 14.0-CURRENT #1 RELENG_2_7_0-n255866-686c8d3c1f0: Wed Jun 28 04:21:19 UTC 2023
    root@freebsd:/var/jenkins/workspace/pfSense-CE-snapshots-2_7_0-main/obj/amd64/LwYAddCr/var/jenkins/workspace/pfSense-CE-snapshots-2_7_0-main/sources/FreeBSD-src-RELENG_2_7_0/amd64.amd64/sys/pfSense
�������������������������������������������������������������������������������������������������������������������������������������������������������������������������������������������������������������������������������
Please any idea what this could mean? I have to manually (physically) restart the pfSense server when there's a downtime (due to a prolonged power outage; it's on an inverter + smart UPS).
Thank you for all your help and kind assistance

-
The Intel license logs are expected. The panic is not. We need to see the backtrace to know more.
Can you upload the full crash report here?
https://nc.netgate.com/nextcloud/index.php/s/eGaG4S4BaqppwDJI can review it from there.
Steve
-
@stephenw10 Upload done.
Thanks for your kind assistance. -
Those are very different crashes.
#1 Backtrace:
db:0:kdb.enter.default>  bt
Tracing pid 12 tid 100059 td 0xfffffe006425aac0
kdb_enter() at kdb_enter+0x32/frame 0xfffffe006445b5a0
vpanic() at vpanic+0x183/frame 0xfffffe006445b5f0
panic() at panic+0x43/frame 0xfffffe006445b650
trap_fatal() at trap_fatal+0x409/frame 0xfffffe006445b6b0
trap_pfault() at trap_pfault+0x4f/frame 0xfffffe006445b710
calltrap() at calltrap+0x8/frame 0xfffffe006445b710
--- trap 0xc, rip = 0xffffffff80cd1c7d, rsp = 0xfffffe006445b7e0, rbp = 0xfffffe006445b860 ---
__mtx_lock_sleep() at __mtx_lock_sleep+0xcd/frame 0xfffffe006445b860
pf_find_state() at pf_find_state+0x1dd/frame 0xfffffe006445b8b0
pf_test_state_tcp() at pf_test_state_tcp+0x1cc/frame 0xfffffe006445ba10
pf_test() at pf_test+0x1102/frame 0xfffffe006445bb90
pf_check_out() at pf_check_out+0x22/frame 0xfffffe006445bbb0
pfil_mbuf_out() at pfil_mbuf_out+0x35/frame 0xfffffe006445bbe0
ip_output() at ip_output+0xc3e/frame 0xfffffe006445bce0
ip_forward() at ip_forward+0x3d5/frame 0xfffffe006445bd90
ip_input() at ip_input+0x686/frame 0xfffffe006445bdf0
swi_net() at swi_net+0x138/frame 0xfffffe006445be60
ithread_loop() at ithread_loop+0x257/frame 0xfffffe006445bef0
fork_exit() at fork_exit+0x7d/frame 0xfffffe006445bf30
fork_trampoline() at fork_trampoline+0xe/frame 0xfffffe006445bf30
--- trap 0xa5a5a5a5, rip = 0xa5a5a5a5a5a5a5a5, rsp = 0xa5a5a5a5a5a5a5a5, rbp = 0xa5a5a5a5a5a5a5a5 ---
#1 Panic:
Fatal trap 12: page fault while in kernel mode
cpuid = 7; apic id = 07
fault virtual address	= 0xbb1e
fault code		= supervisor read data, page not present
instruction pointer	= 0x20:0xffffffff80fd95f5
stack pointer	        = 0x28:0xfffffe0064474720
frame pointer	        = 0x28:0xfffffe0064474800
code segment		= base 0x0, limit 0xfffff, type 0x1b
			= DPL 0, pres 1, long 1, def32 0, gran 1
processor eflags	= interrupt enabled, resume, IOPL = 0
current process		= 12 (swi1: netisr 5)
rdi: fffff8012464b300 rsi:               14 rdx: fffffe00644749e0
rcx:             bb00  r8: fffff8012464b36e  r9: fffff8016afcc4e0
rax:               40 rbx: fffff8016afcc540 rbp: fffffe0064474800


Fatal trap 12: page fault while in kernel mode
cpuid = 2; apic id = 02
fault virtual address	= 0xef50
fault code		= supervisor read data, page not present
instruction pointer	= 0x20:0xffffffff80cd1c7d
stack pointer	        = 0x0:0xfffffe006445b7e0
frame pointer	        = 0x0:0xfffffe006445b860
code segment		= base 0x0, limit 0xfffff, type 0x1b
			= DPL 0, pres 1, long 1, def32 0, gran 1
processor eflags	= interrupt enabled, resume, IOPL = 0
current process		= 12 (swi1: netisr 2)
rdi: fffffe006f4d9d70 rsi:             eb00 rdx:            50faa
rcx: fffffe006f252000  r8:                a  r9:              602
rax:                0 rbx: fffffe006425aac0 rbp: fffffe006445b860
r10:          5ce37dd r11:                0 r12: fffffe006445b800
r13: fffffe006f4d9d70 r14:             eb00 r15:                0
trap number		= 12
panic: page fault
cpuid = 2
time = 1695389621
KDB: enter: panic
#2 Backtrace:
db:0:kdb.enter.default>  bt
Tracing pid 0 tid 100201 td 0xfffffe0070404720
kdb_enter() at kdb_enter+0x32/frame 0xfffffe000ab2cdb0
vpanic() at vpanic+0x183/frame 0xfffffe000ab2ce00
panic() at panic+0x43/frame 0xfffffe000ab2ce60
dblfault_handler() at dblfault_handler+0x1ce/frame 0xfffffe000ab2cf20
Xdblfault() at Xdblfault+0xd7/frame 0xfffffe000ab2cf20
--- trap 0x17, rip = 0xffffffff8126d51f, rsp = 0xfffffe00a3343688, rbp = 0xfffffe00a3349220 ---
done_load_dr() at done_load_dr+0x1f/frame 0xfffffe00a3349220
#2 Panic:
<118>Mounting ZFS boot environment... done.
<118><jemalloc>: jemalloc_extent.c:1195: Failed assertion: "p[i] == 0"


Fatal trap 12: page fault while in kernel mode

Fatal trap 12: page fault while in kernel mode
cpuid = 2; apic id = 02
cpuid = 5; apic id = 05
fault virtual address	= 0x78
fault code		= supervisor read data, page not present
instruction pointer	= 0x20:0xffffffff8362ca55
stack pointer	        = 0x28:0xfffffe00a354a140
Fatal double fault
rip 0xffffffff8126d51f rsp 0xfffffe00a3343688 rbp 0xfffffe00a3349220
frame pointer	        = 0x28:0xfffffe00a354a160
code segment		= base 0x0, limit 0xfffff, type 0x1b
rax 0xffffffff80d2f2e1 rdx 0xffffffff84016384 rbx 0xfffffe000aafd1c0
rcx 0xfffffe000ab300c0 rsi 0xfffffe0070404720 rdi 0xffffffff8303ef30
fault virtual address	= 0xfffffb2d37dc8a78
r8 0xfffffe0070404c40 r9 0xfffffe00a3348000 r10 0
r11 0x7ff705c8 r12 0xfffffe0070404e20 r13 0xffffffff8309d730
r14 0xfffffe000adb5660 r15 0xffffffff83092d88 rflags 0x10046
cs 0x20 ss 0x28 ds 0x3b es 0x3b fs 0x13 gs 0x1b
fsbase 0 gsbase 0xffffffff84016000 kgsbase 0
cpuid = 6; apic id = 06
panic: double fault
cpuid = 6
time = 1695448028
KDB: enter: panic
I'd guess that the second crash is a result of the first one since it crashed before it finished booting, just after mounting the filesystem.
Is this the first time that has happened?
-
@stephenw10 Yes it is.
This was in relation to this issue. I decided to just do a clean install, so I downloaded the image from Netgate and set up a new machine, then restored the backup I did from the old machine. It worked cleanly without any errors. And then after some days, this came up. -
Any idea what might have been happening when it hit that? Any unusual traffic?
-
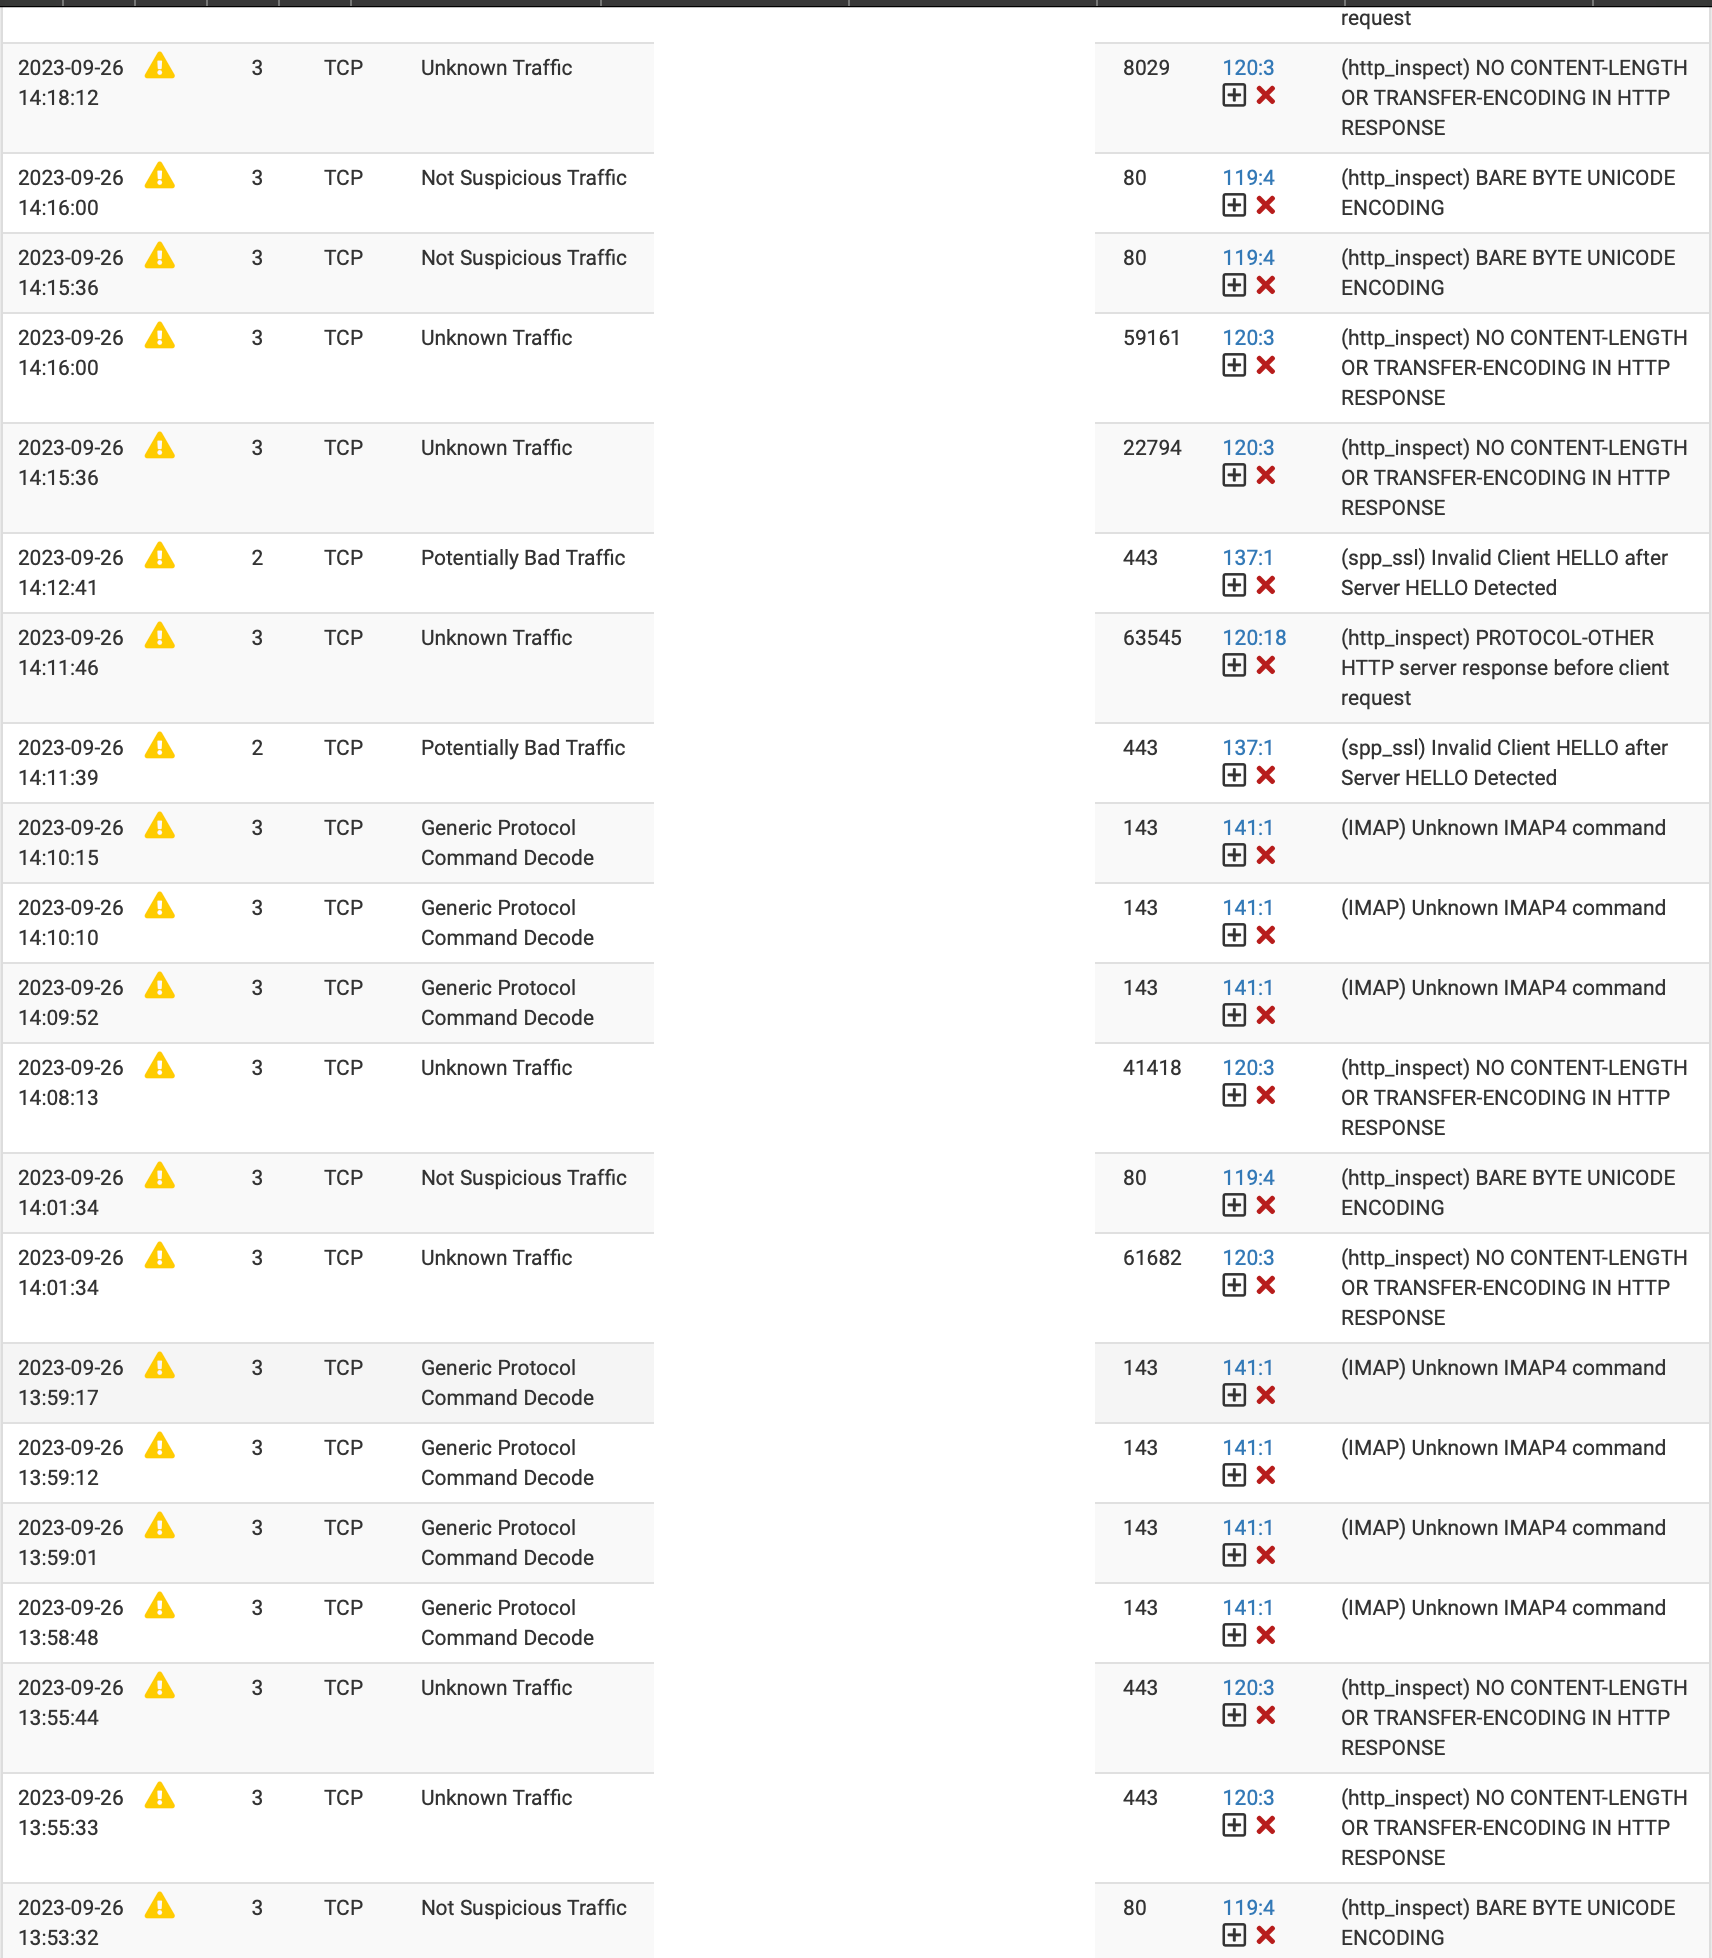
@stephenw10 There was something I noticed.
I suddenly noticed snort was throwing up some alerts - Potentially Bad Traffic and Generic Protocol Command Decode. I uploaded a couple of sample screenshots..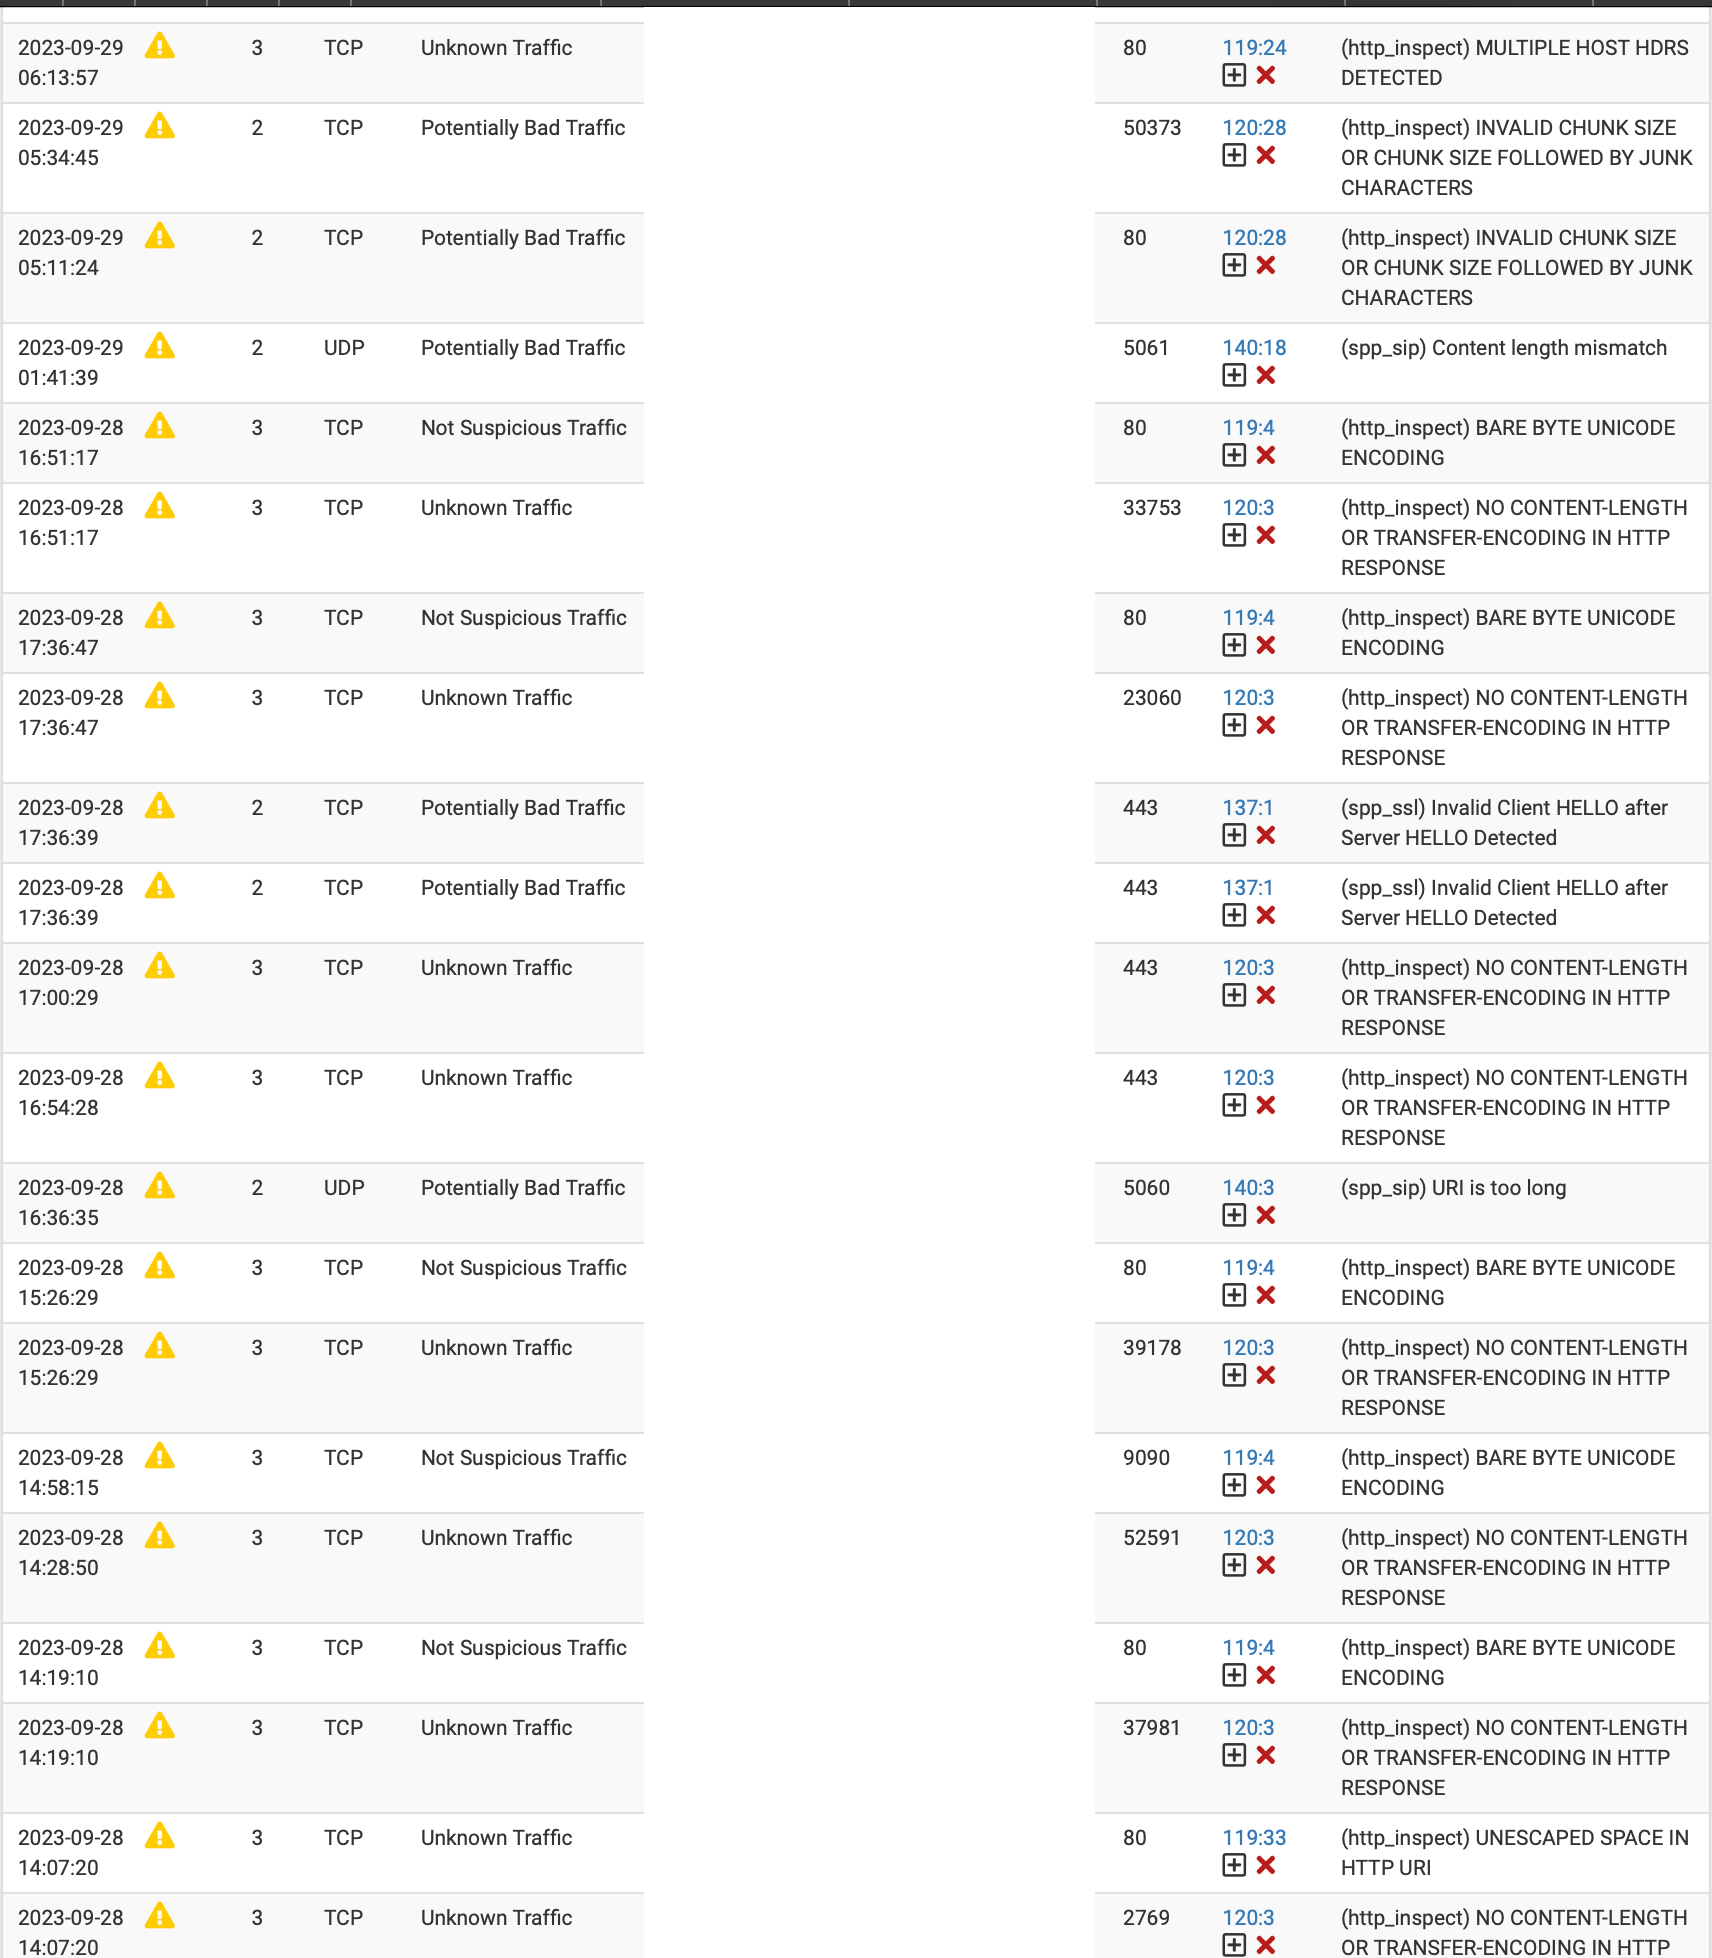
-
I ran it past one of our developers who said something unusual must have happened to reach that because it shouldn't be possible. That was just his first comment, hopefully there will be more when he has time to review it properly.
Steve
-
@stephenw10 Thank you so much.
I look forward to the feedback from you (and your developer team)
-
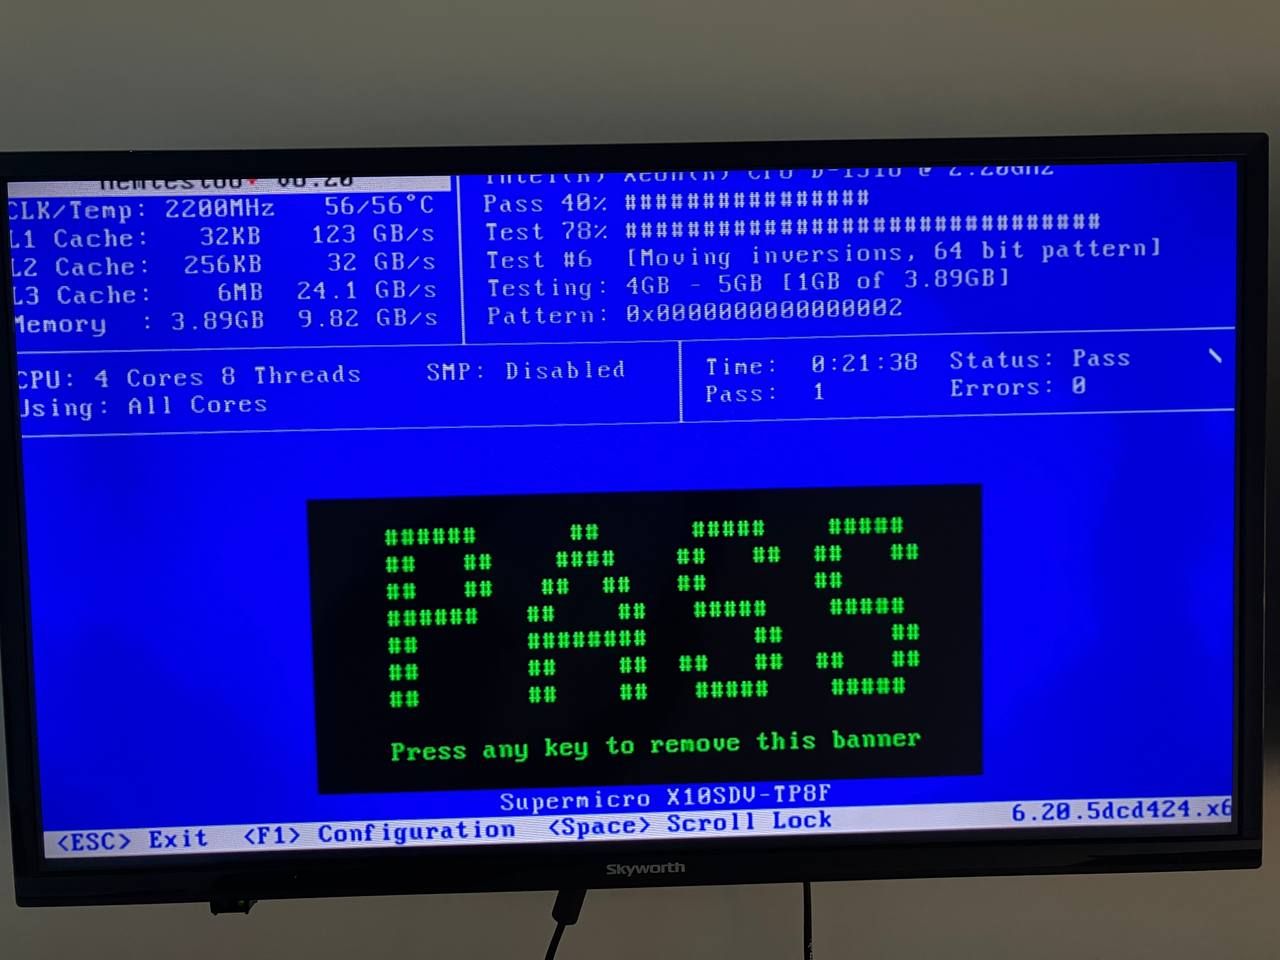
Ok that second crash looks like it could be a hardware issue which means the first crash could also be. If you haven't seen this before or since that might also indicate hardware. Are you able to run a memtest on that hardware?
-
@stephenw10 Hi and apologies for the delay in replying.
I ran memtest on the server - more than once. I ran the basic, and then the advanced (which ran for hours). There was no error at all.
Any update concerning the first crash please ?
? -
No updates I'm afraid. It still looks like harwdare, though clearly not RAM from that test.