Traffic graphs - am I reading this wrong in/out values.
-
So you see the same as me but you think the webgui should just show the patch as invalid rather than revertable?
-
This post is deleted! -
@stephenw10 said in Traffic graphs - am I reading this wrong in/out values.:
up that patch is in but only affects output when using rate not iftop
So still seeing if using RATE vs iftop.. Is there some patch that needs to be applied even when on 23.09.1 ?
I would of thought the patch would of been included?

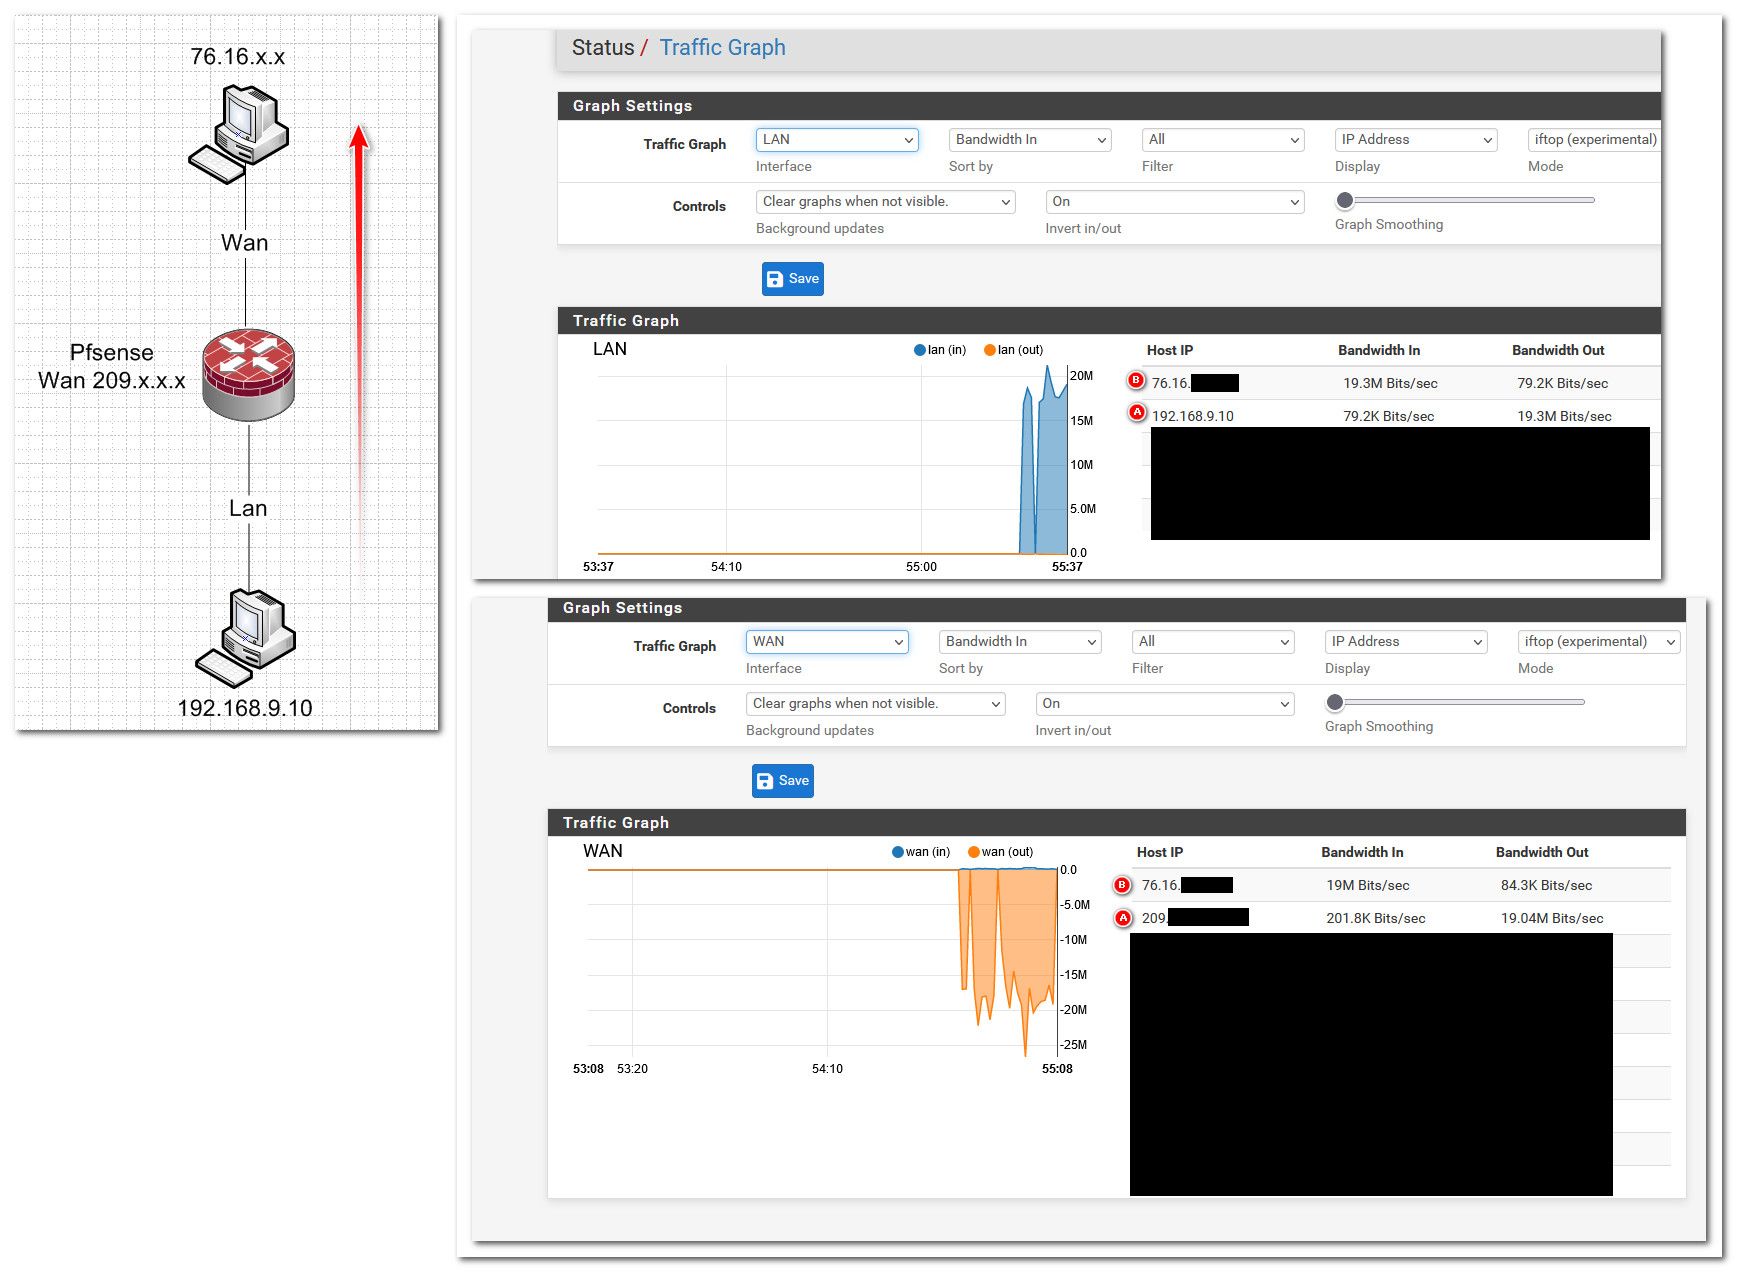
I thought the patch from before was to show the IPs, I don't recall it having anything to do with if the traffic was in or out of an interface.. In the above same thing my 9.10 box is sending like 4Mbps to the internet.. So to the lan interface that top line is correct, but the 2nd line is showing 4Mbps out of the lan..
I send quite of bit of data to the internet most of the time.. My friends and family are almost always watching something off my plex box. Is there a patch I can apply to show the bandwidth in/out correctly?
-
@jrey said in Traffic graphs - am I reading this wrong in/out values.:
This likely need a new thread if we going to continue discussing the patch mechanism rather than the traffic values ;-)
Yes I agree. Open a feature request for it if you want. However that is the expected behaviour it's not a bug.
-
@johnpoz said in Traffic graphs - am I reading this wrong in/out values.:
Is there some patch that needs to be applied even when on 23.09.1 ?
No all the patches are in 23.09.1. Yes, it was to show the expected IPs and didn't change the in/out data.
It could be those column headings are just wrong and exist from some much earlier version. To/From might be better there.
-
Apologies for the thread diversion re:patching
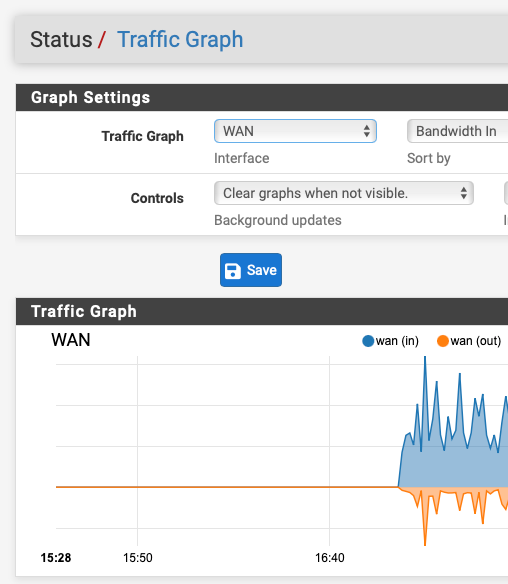
I'm curious about the screen captures you are posting.. when I am testing this I see something more like (likely just optics) because your other devices aren't doing enough traffic to show on the auto scale in comparison)
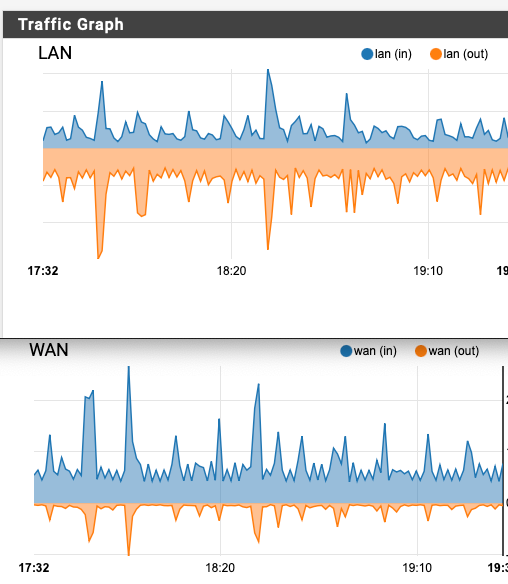
where there is basically traffic on both sides of the base line... and the traffic on LAN and WAN graphs basically matches
top to bottom, bottom to top between the graphs (there is more traffic on the LAN side being displayed because of other traffic between devices that does not go to WAN.Again your display might just be because your graphs are only showing the peak of the one device and the auto scale is not making the other traffic visible.. Let me set up a large stream test but as near as I can tell the orange on the top (LAN) matches the blue on the bottom (WAN) and the blue on the top (LAN) matches the orange on the bottom (WAN). With the slight differences in the wave forms being attributed to either traffic being local to the LAN staying on the LAN, or WAN traffic coming in an not getting to the LAN (blocked)
-
@jrey your looking at a different graph. I am looking under traffic under status, what you posted just look like the traffic widget..
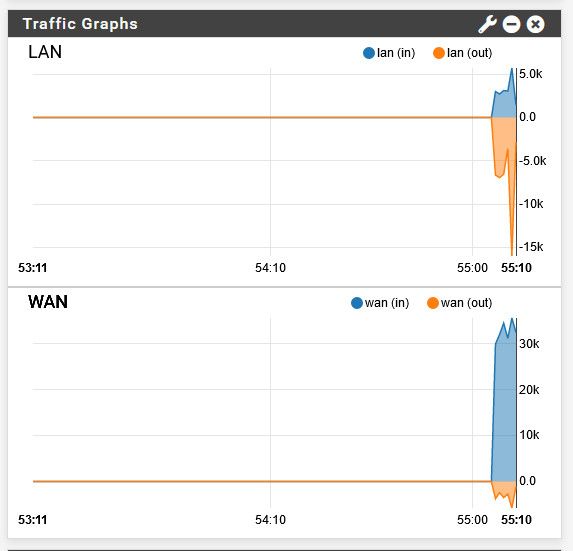
The graphs are correct - its the IP in/out for specific interfaces under status / traffic that seems to be off.
-
no sir, not the widget. I am on exactly the same page as you, with the exact same settings you are showing in your captures. where you have a WAN and a LAN. I'm also using iftop same as you everything same as you are showing. I basically matching your setting on the screens you are showing and looking at the same type of results.
My first image was basically running on two browser and screen is captured side by each, not too far apart (actually one over the other) . so I could visualize the wave forms IPs at the same time. Sorry that made it look like the widget. (it's not)This is where I am
the IP rates (for a given IP) look the same at any given point in visually looking, even though the list moves often. The only slight differences I'm seeing in those value would likely be just other traffic that is not going between the interfaces.
I'm just setting up my test box so I can do a more controlled and isolated test, that wouldn't be impacted by so much other lan/lan only or wan/block type traffic where a lot of devices are in use. (ie I want to remove all the normal background noise and network overhead and just look at one device.
-
@jrey yeah never had an issue with the graphs.. they are correctly showing traffic flow in the correct direction.
-
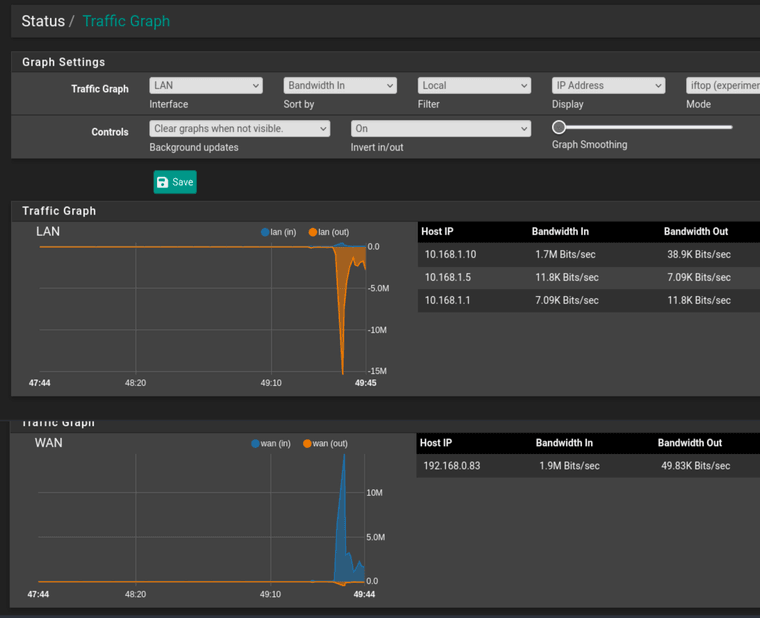
Test box, running a buffer bloat test.
in both cases the gateway monitor is running a monitor to 1.1.1.1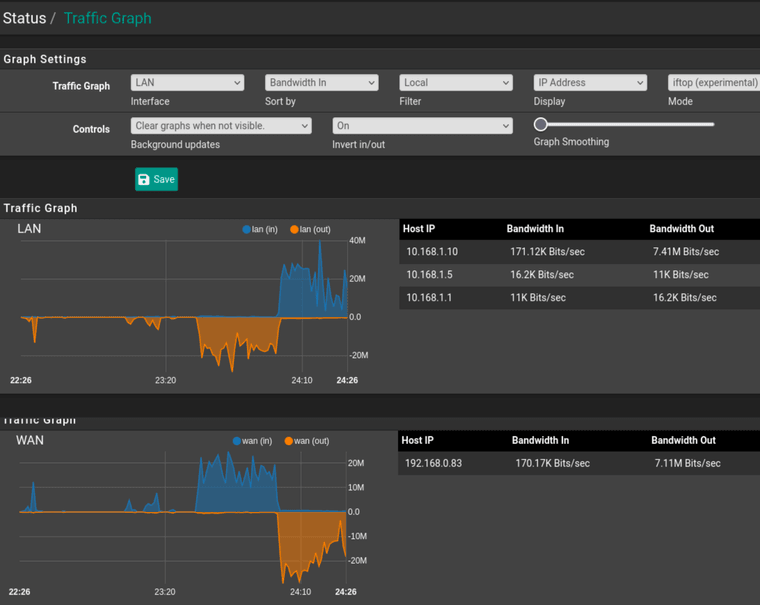
again two browsers overlapping.
on the LAN
1.10 is the system running the bloat test
1.5 is the system running the graphs
1.1 is the pfsense IPon the WAN display
0.83 is the IP currently assigned to the WAN on the pfSense boxchange both graphs to filter remote -- run test again..
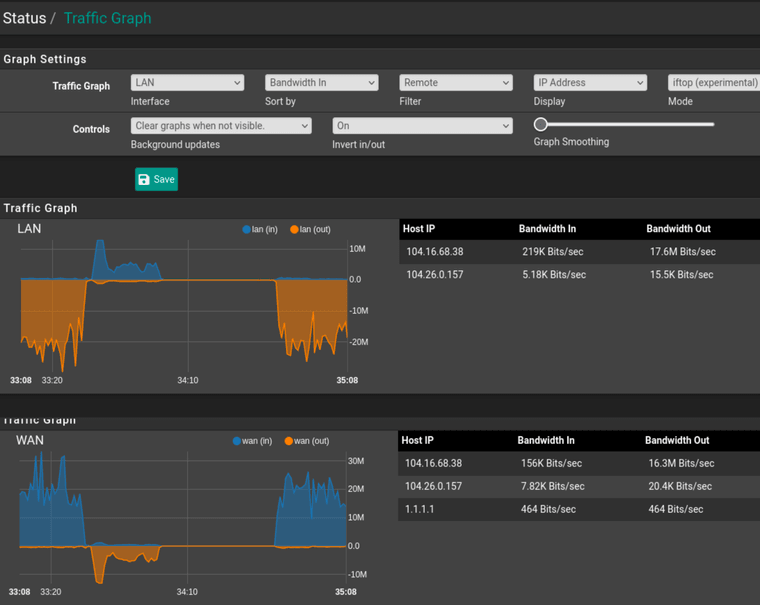
-
@jrey not sure what your trying to show there.. Your saying your not seeing the problem?
here for example..

If your 1.10 is sending data to the internet.. How is that listed as out on the lan interface? That should be shown as IN to the lan interface.. Your wan shows it correctly 0.83 to the internet would be out..
-
I didn't actually say anything about the results.
Just showing you what I'm seeing on a system with little to no other traffic and no masked IP's.
the buffer bloat test as you know downloads first, then uploads.
so those first captures are yes at the point that is nearing the end of uploading test
here is a capture while it is still in the download phase (local filter)
