DNS 8000+ms, troubleshooting help
-
This depends on how the application will work over the network. For example an ICMP packet (a ping) a common use is to send a request and receive a response. Now you have to analyze whether your blockchain is supposed to be receiving data from abroad or not.
-
@s_serra I appreciate your trying to help me but I absolutely do not understand.
-
@srytryagn said in DNS 8000+ms, troubleshooting help:
option for nat reflection set to pure nat.
But are you actually using nat reflection.. There is zero point to setting up nat reflection unless your actually using it.. Do these devices talk to each other, via your public IP and have to be reflected back in.. If they send a lot of traffic that is going to be horrible setup.
Your latency while using the apps points to some sort of network issue, buffer bloat sort of thing.. In your drawing you show another network.. When you turn on your devices or miners or whatever they are - does a machine on network 2 have issues with ping times to say 8.8.8.8.. or just from these devices on network 1 per your drawing.
BTW - I take it you mean switch not hub.. Hubs haven't even really been a thing in what 20 some years..
-
@srytryagn said in DNS 8000+ms, troubleshooting help:
added some DNS alternatives
That is not the default setup then.. Unless you setup dns forwarding in dns, stuff you add in there would only be used by pfsense itself.. if your local dns was down, etc. Its pretty pointless.. You either want to forward or you don't if your wanting to just resolve, having anything other for dns is pointless and doesn't get you really anything.. If your not forwarding your clients are not going to resolve if dns is down or broken on unbound.. Having other dns that pfsense could use would only allow pfsense to check for updates, etc. since that is really the only use it has for dns.. Or if you wanted to resolve some IP in your firewall logs.
-
@johnpoz
-For Pure nat, I suppose if AppA and AppB talk on Loopback, on a single machine, there is no need for reflection. Shall I disable reflection in my NAT port forward setting?-Un-managed switch I mean, called it a hub incorrectly.
-Yes, both Network 1 and Network 2 experience that sever latency/non-web browsing when Both AppA and AppB are on. AppA causes no issues.
{ off topic, but as an aside from this purely network based thread, it is not a miner it is a consensus node (AppA) and a proof of space time node (AppB) hold data and prove you did to the network }
-
@johnpoz Could that be the source of my issues? if it is then BIG thx in advance. How shall I configure DNS in pfSense to test if it solves my issue?
-
@srytryagn said in DNS 8000+ms, troubleshooting help:
How shall I configure DNS in pfSense
Nothing - it works out of the box resolving.. There is nothing really to do with dns on pfsense. It resolves, it caches.. There are some tweaks you could do if like serve zero, set a min ttl, setup qname min, sort of things. But really out of the box is really all you should have to do.. I tweak mine a bit, but then again I have been working with dns since there has been dns.. Your typical users shouldn't have to touch anything and it should work.
but your latency is more than dns, but once something is cached - makes no matter if stuff takes a while because your line is saturated..
As you saw in your google test, you still got good response time, 0 from unbound.. And even talking to 1.1.1.1 was only 18ms..
You need to figure out what is causing say the query to 67.69.235.1 to be 266 ms vs 7 ms.. That points to your network being bogged down.. I am curious where your at that you get 2 ms and 4 ms from 1.1.1.1 and 8.8.8.8 to be honest.. Those are insane low..
I would have to assume your on some sort of fiber connection? Ping time of 2 or 3 ms to google is pretty freaking good.. So either your bogging down your actual internet, or pfsense is working hard and not showing it in the cpu?
I would like to see a sniff on your lan for when you try these tests to see what is actually happening.. Maybe your network is just flooded with something??
-
Yeah this 'feels' like there must be a massive amount of traffic on the LAN for some reason. Do you see the load on pfSense increase significantly?
-
@stephenw10 Load on pfsense, in what way. CPU 3%, Mem 3%, bandwidth 25Mb/s of 1000Mb/s. Seems underutilized.
However another user of the same app reported much lower bandwidth usage than I have, by a factor of 100.
Please let me know what to check, because I am utterly stuck.
-
@johnpoz If I understand correctly your suggestion is sniff lan analyze what is flooding.
I have run packet captures as suggested earlier from someone else, however I am unable to interpret the data or find error.
I am truly stuck :(
What in particular am I looking for in the data ?
-
@srytryagn for one how much of it is there. Can you post it up the pcap..
If your worried about your public IP in the pcap.. You could use say https://www.tracewrangler.com/ to change your public IP in the sniff.
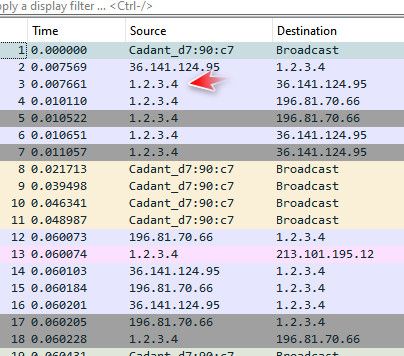
Here I took a simple sniff on my wan so it had my public IP in it.. Changed my public IP 209.x.x.x to be 1.2.3.4
You can strip payload, lots of stuff so the sniff doesn't really have any of your info in it.. But we can see what is going on, and to where, and how much of it, etc. And how fast packets are going out, etc.
I am curious to see if the devices are trying to talk to your public IP and being reflected back in.. But also just curious on the amount of traffic, and what it is that could be bogging down your connection.
-
@srytryagn said in DNS 8000+ms, troubleshooting help:
Load on pfsense, in what way. CPU 3%, Mem 3%, bandwidth 25Mb/s of 1000Mb/s. Seems underutilized.
I mean the relative load, so does it increase when you enable the app? Either the CPU load or the traffic it's seeing?
Check the monitoring graphs in Status > Monitoring.
If all LAN side clients are seeing latency of 8000ms to all external IPs that pretty much has to be some huge traffic load on the router or maybe a switch etc.
-
@stephenw10 said in DNS 8000+ms, troubleshooting help:
maybe a switch etc.
yeah quite possible one of the apps is just flooding the network with garbage, but pfsense itself is not processing this garbage..
Really be curious to see the sniff on lan side interface of pfsense when you turn this thing on and see the latency..
Your network 2 you show there, is there just 1 box connected directly to pfsense interface, does that go through the same switch? if network 1 was flooded with garbage that pfsense was not processing, then network 2 should really see no effects if your switch on network 1 was overloaded, say a loop or something.
Vs looking at just cpu, mem etc... Do say your states sky rocket when you turn this device on? mbuf?
-
To answer you questions 1) Network2 is not on same unmanaged switch, it is an independent LAN, and yes it is grinds to a hault when AppB runs with AppA on a different machine in Network1. 2) States have a lot more entries since I connect w/ 30 peers.
Thanks for suggesting that tool to not show public IP, I could also just dump into excel sheet and share relace it w/ 1.2.3.4. Is there any other critical information I should keep out?
What kind of pcap shall I post that would be most helpful for sorting out what is going on ?
Should I run pcaps with no app, AppA, AppA + AppB ?
Please let me know the specific options and interfaces, IP, Ports etc...
Really looking forward to finding a solution and thanks for helping !
-
@srytryagn A sniff on your lan for everything without your stuff running, and then again with it running would be good to start with for sure.. it defaults to 1000 packets.. Which should be enough to see if network is being flooded with stuff.
The tool would be much better to change your public IP.. And you can also remove payload if you want and truncate the frames.. We really don't need to see what the data is - but helpful to see all the protocols and such.. A spreadsheet would be much more difficult to look at then just opening it in wireshark.
You can look at the anon file it creates to make sure your public IP has been changed, etc.
The tool is pretty good for anonymizing the traffic.. But still see what is taking to what.. For example 1.2.3.4 while clearly made up that is my wan, so with some insight to what your changed to what we can get the details we need of what is trying to talk to what, etc.
States and mbuf are one thing - but do they jump up to insane amounts - I mean 30 peers isn't crazy, unless they are creating like 10k states each to each other, etc.
-
@johnpoz Will do that and post it here soon.
-
@johnpoz File enclosed with No apps and AppA + AppB running.
I have a bunch of other captures, no port fwd, port fed, start AppA, Sync AppA, Running AppA, AppA + AppB.....
Please let me know what the file points to being wrong w/ my setup and how I may repair it, thanks.
-
@srytryagn could you give some insight to what IPs you changed to what..
Your one with stuff off I see 993 packets in a total of 228 ms.. between 10.50.18.154 and 10.50.245.28, that is a lot of packets between 2 devices in short amount of time.. For what I would assume is network not doing anything.. Is one of those IPs your public, one of one these node devices.. Thought you said they were off?
Then in this other one with on, Its hard to follow because there is 166 different conversations in it all with this 192.168.86.26, what is this 192.168.86.26? in a total sniff of 1.4 seconds?
-
In Apps off mode:
10.-50.18.154 = PC on network 2
10.50.245.28 = KVM over IP connected to PC aboveIn Apps on mode:
192.168.86.26 = PC on network 1 running the apps -
@srytryagn said in DNS 8000+ms, troubleshooting help:
10.50.245.28 = KVM over IP connected to PC above
Well is the only traffic really in that sniff.. So that sniff is pretty useless..
So your saying with that 2nd pcap - is when your network is dead?