Need help to understand firewall log
-
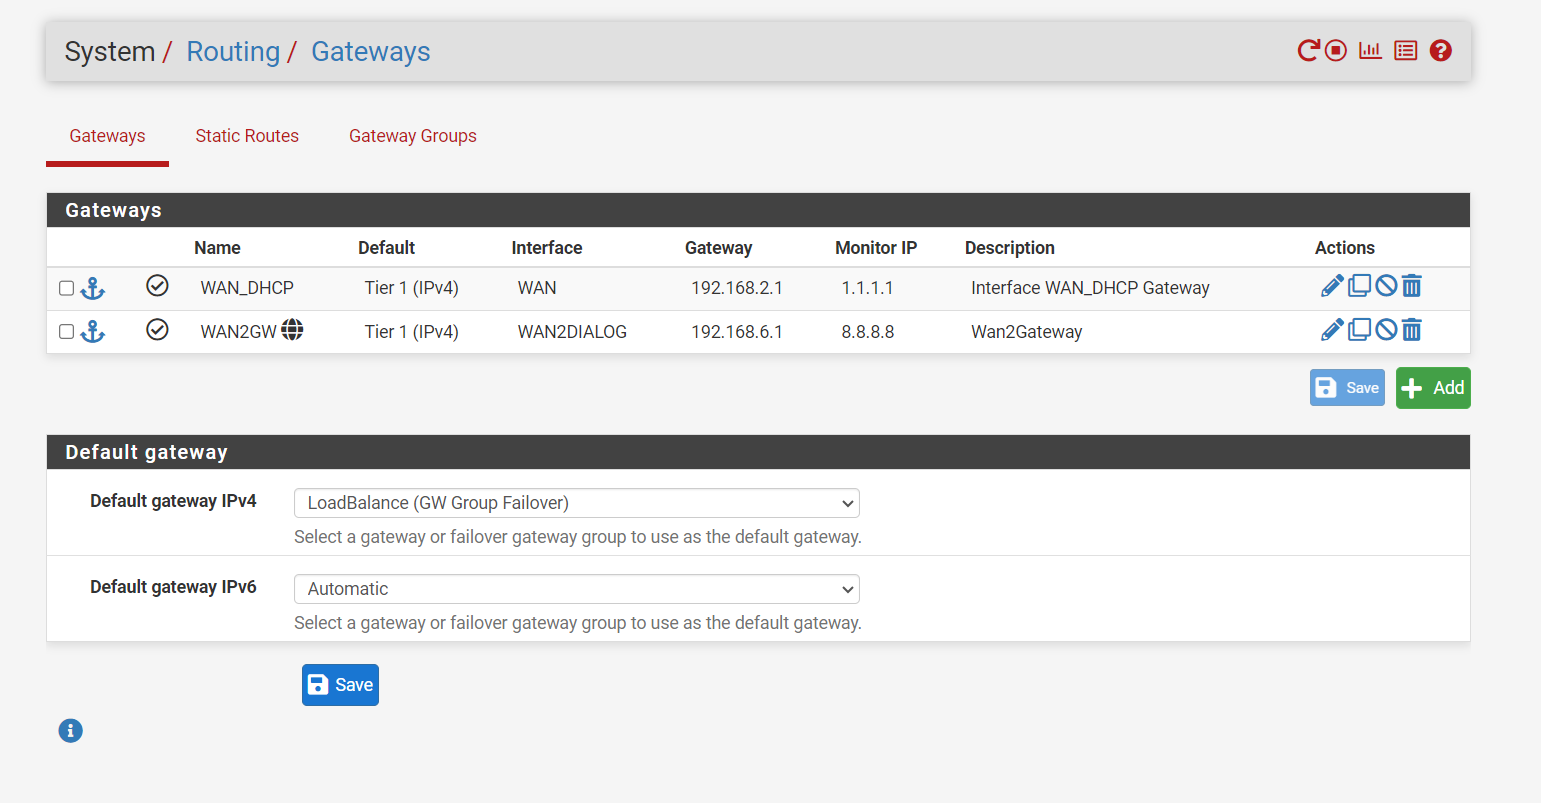
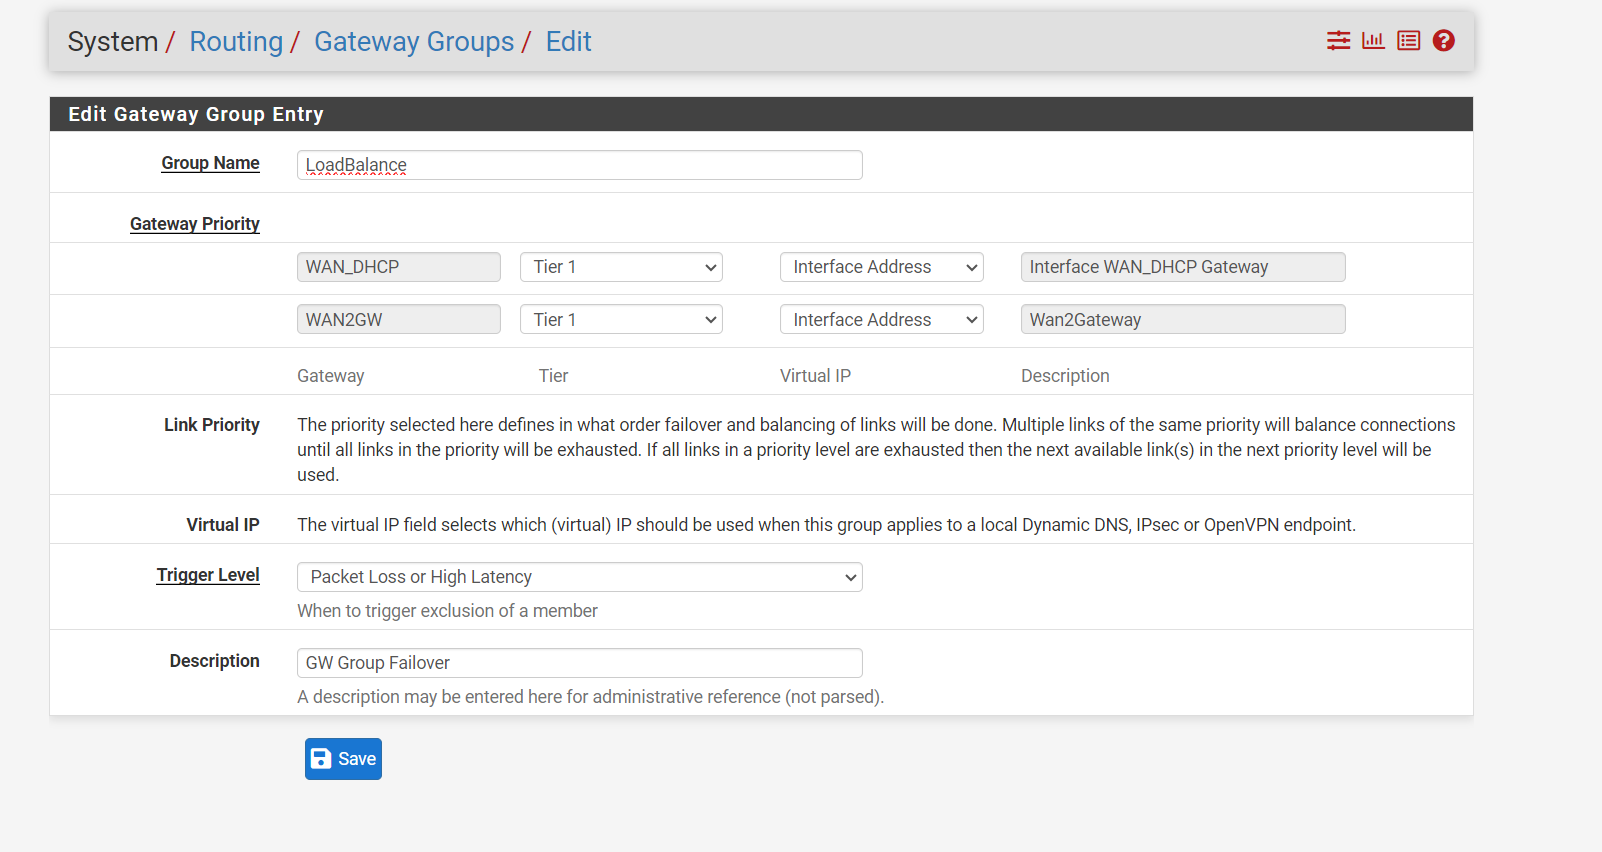
We have two uplink interfaces on our pfSense Netgate 4100 device . Both are from different internet service providers. I configured them as a tier 1 failover load balancing group, so both connections were working initially. Recently, we faced an internet connectivity issue ( January 29th) Connection 1 exceeded its quota limit and stopped working (in Sri Lanka, we have limited monthly quotas. After reaching the limit, the connection speed reduces to 64kbps). Strangely, connection 2 also went down, resulting in a complete internet outage. I want to analyze the logs to understand what actually happened. After rebooting, connection 2 started working again, and adding additional data to connection 1 brought it back online as well. Please review the logs and help me determine the root cause of the issue.
-
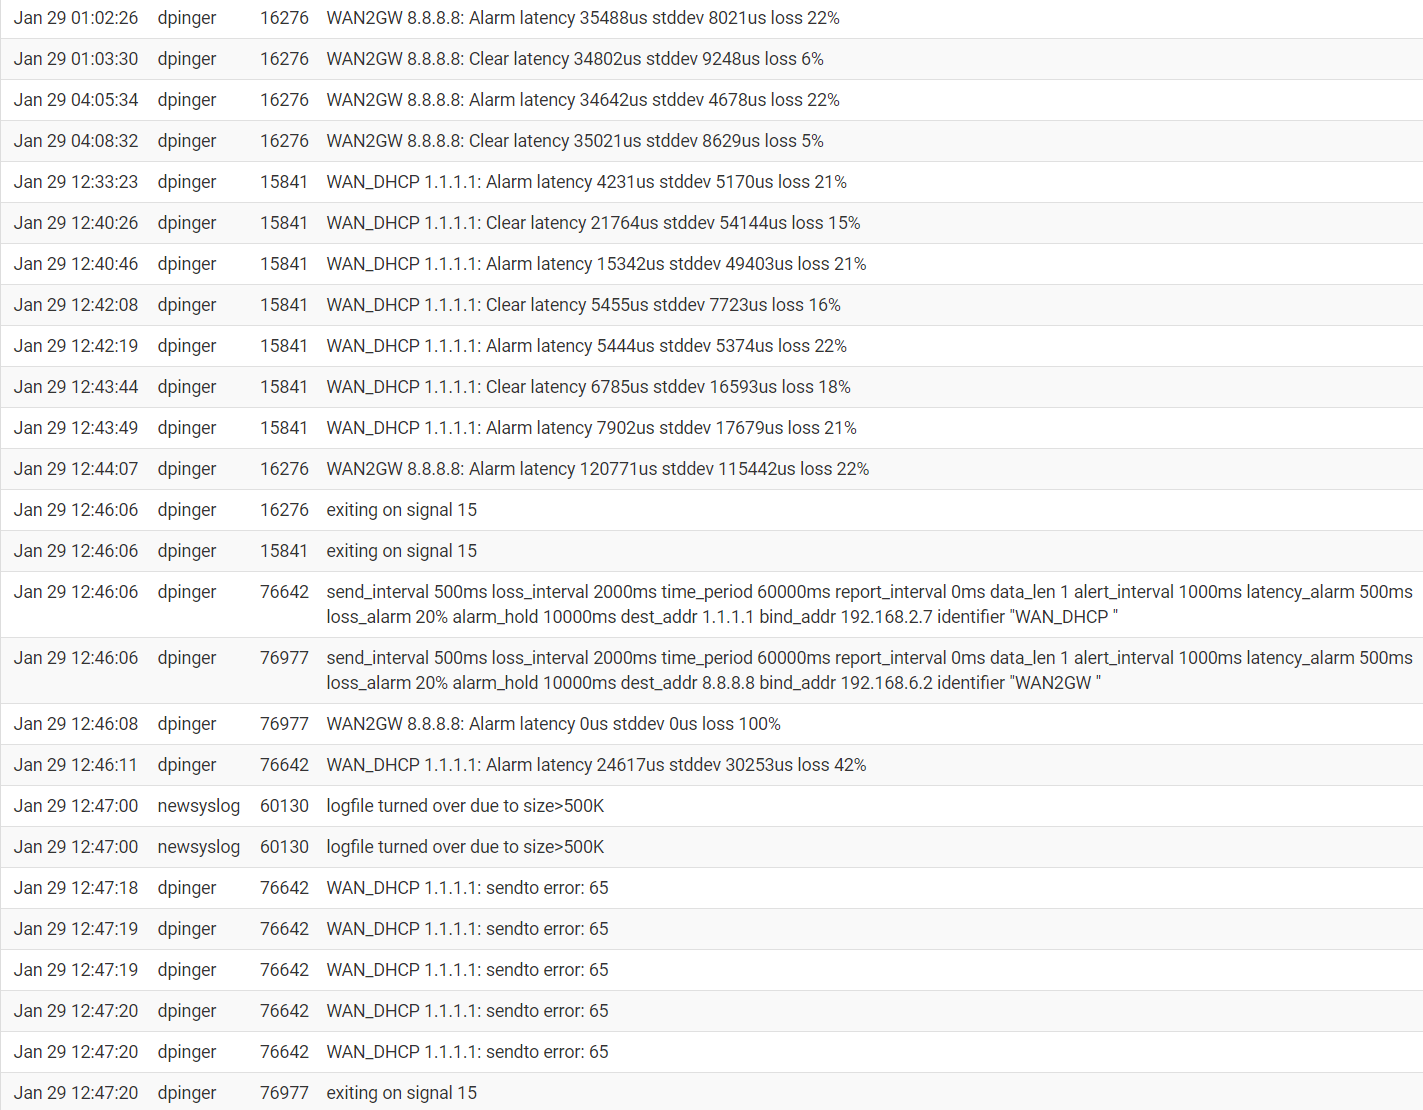
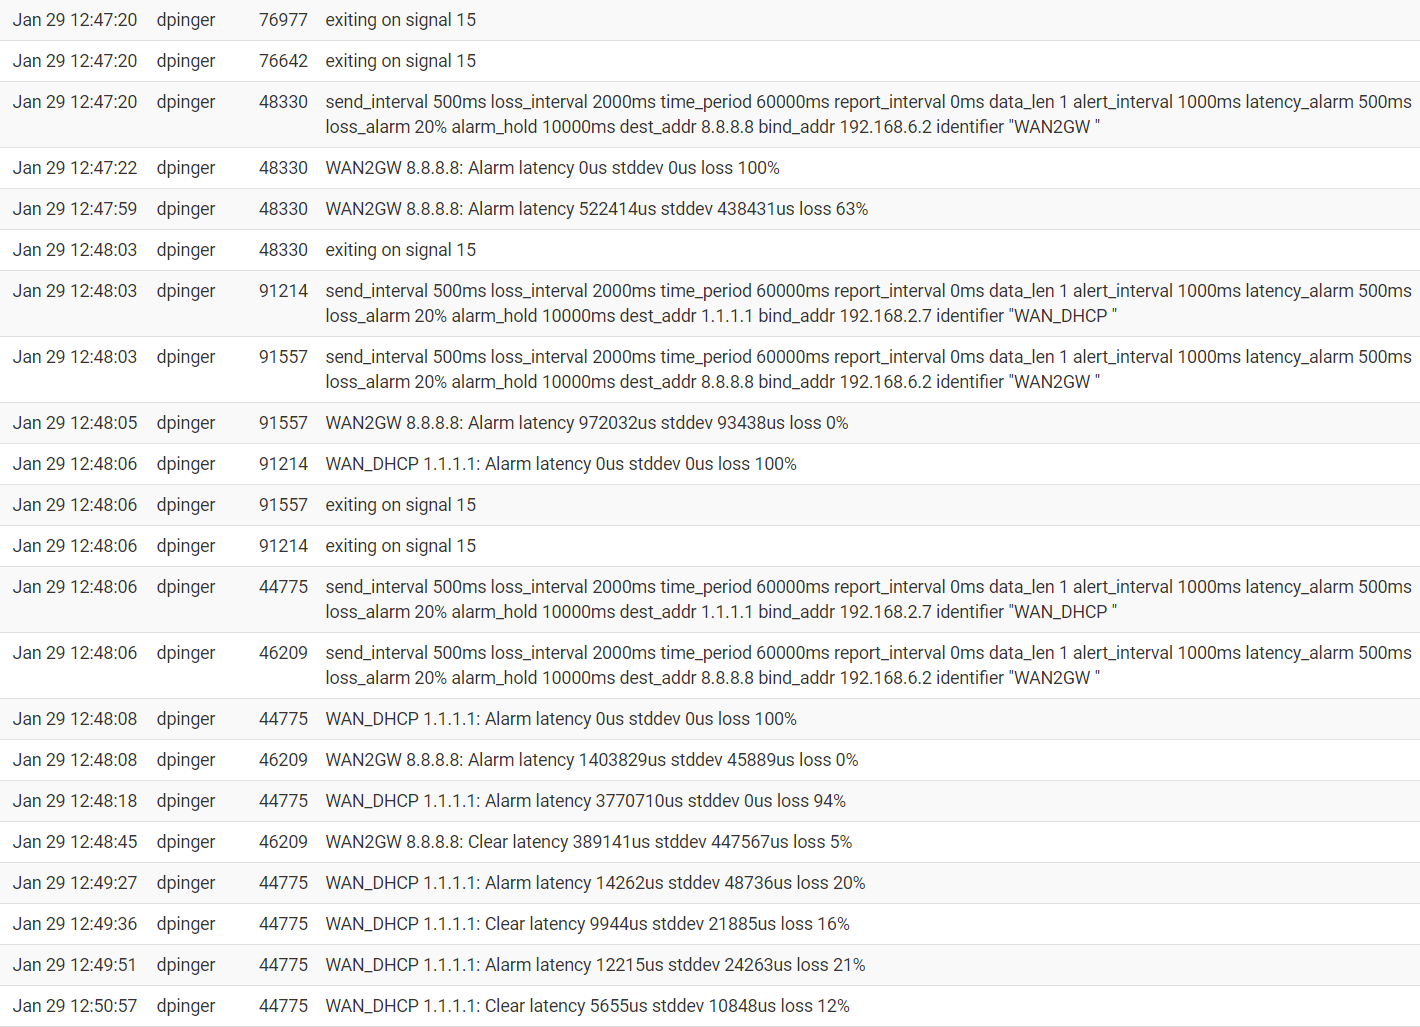
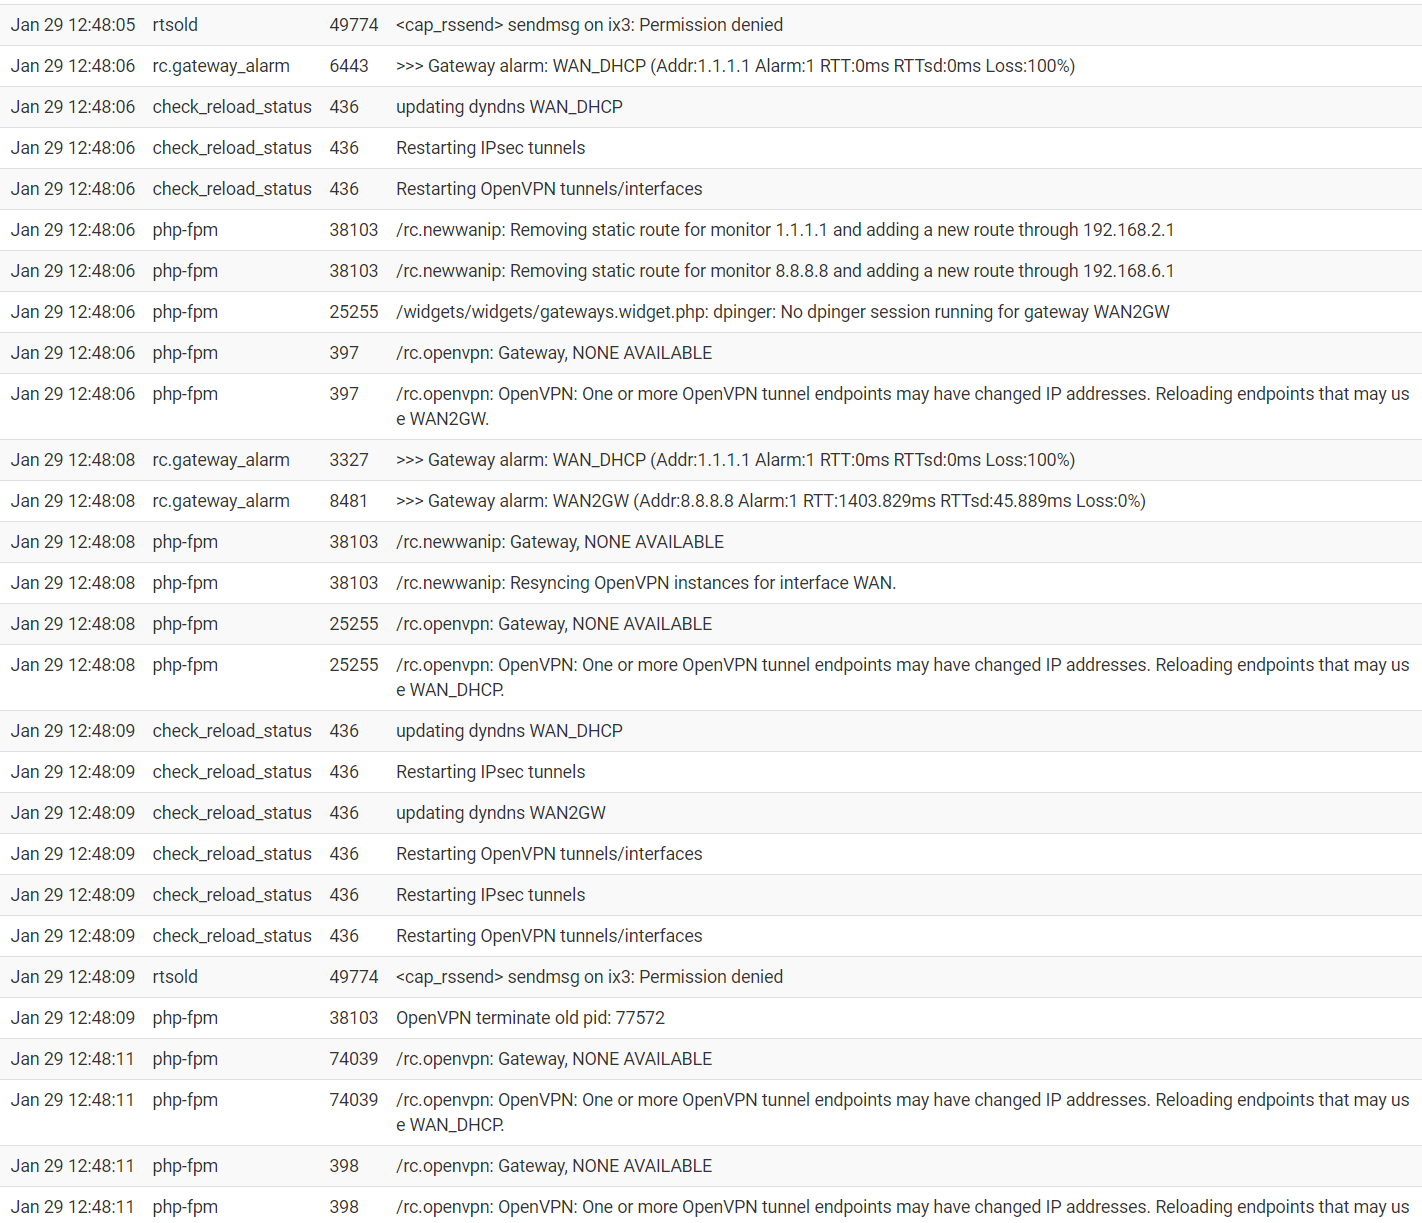
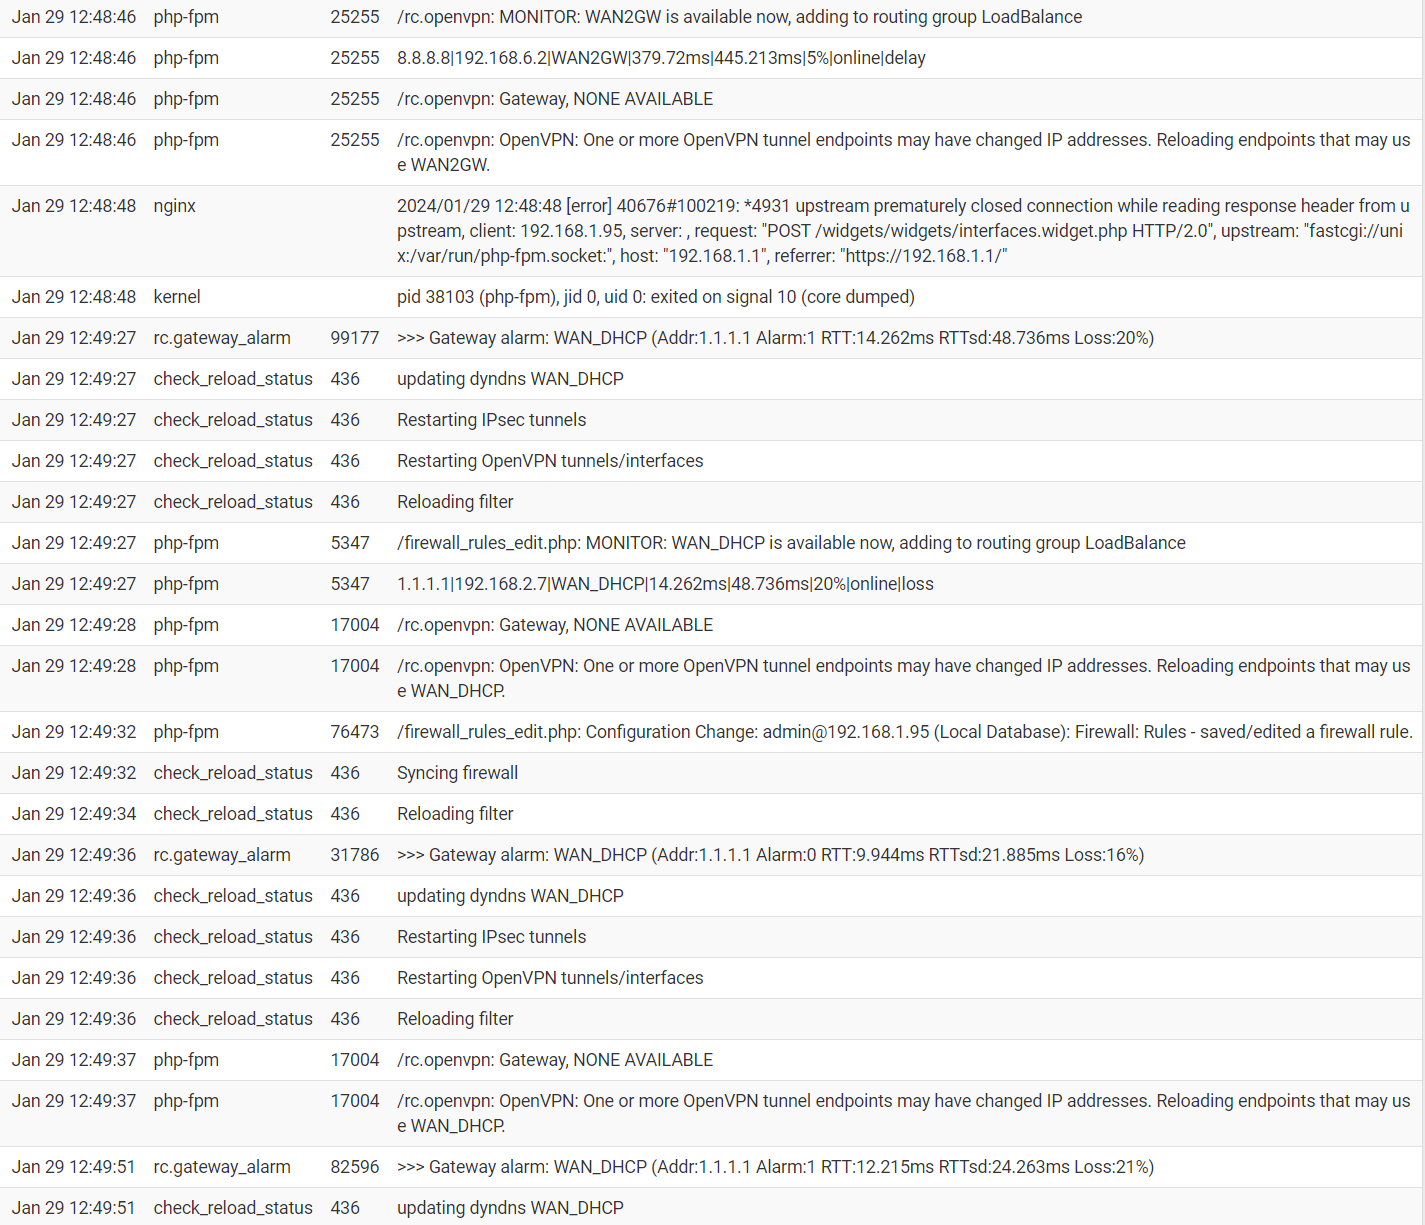
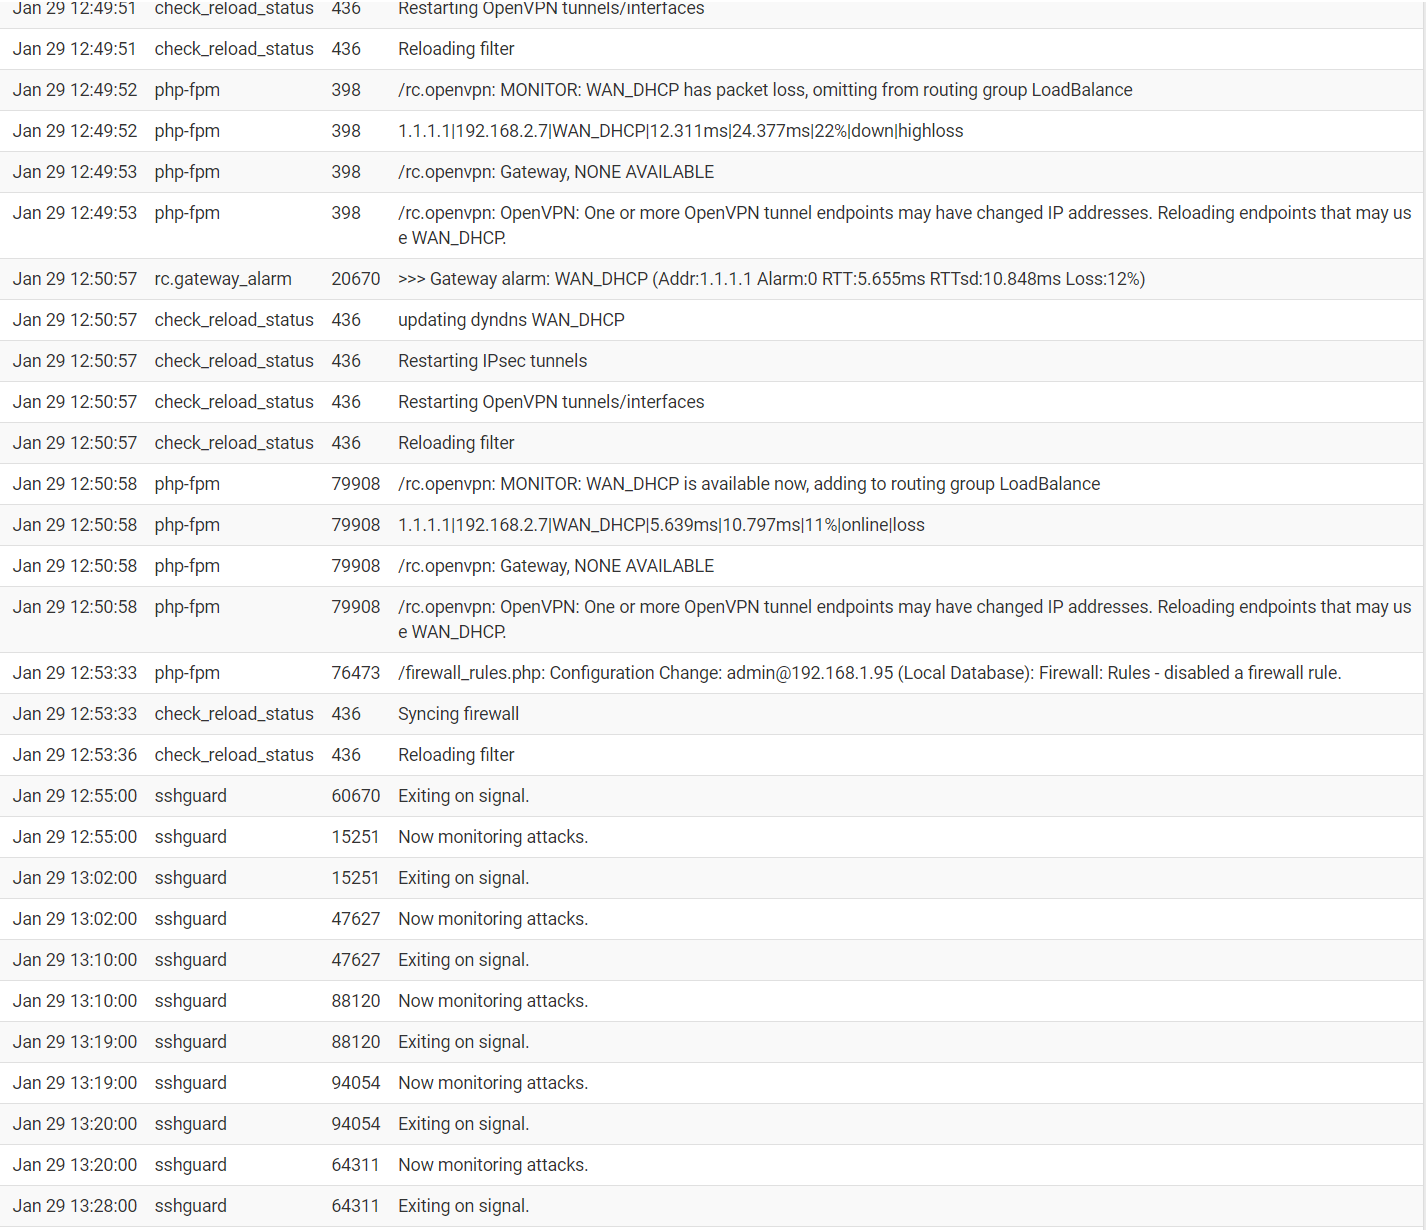
Nothing much in that log other than the packet loss itself. On both WANs. I don't see anything else like link loss or a package restarting etc.
You rebooted after that logged period?
-
@stephenw10
Thanks for your reply! I only rebooted the service provider router, not the pfSense device. What does the long log entry at 12:46:06 mean? Could you explain the numbers 76642 and 76977? below are the all logs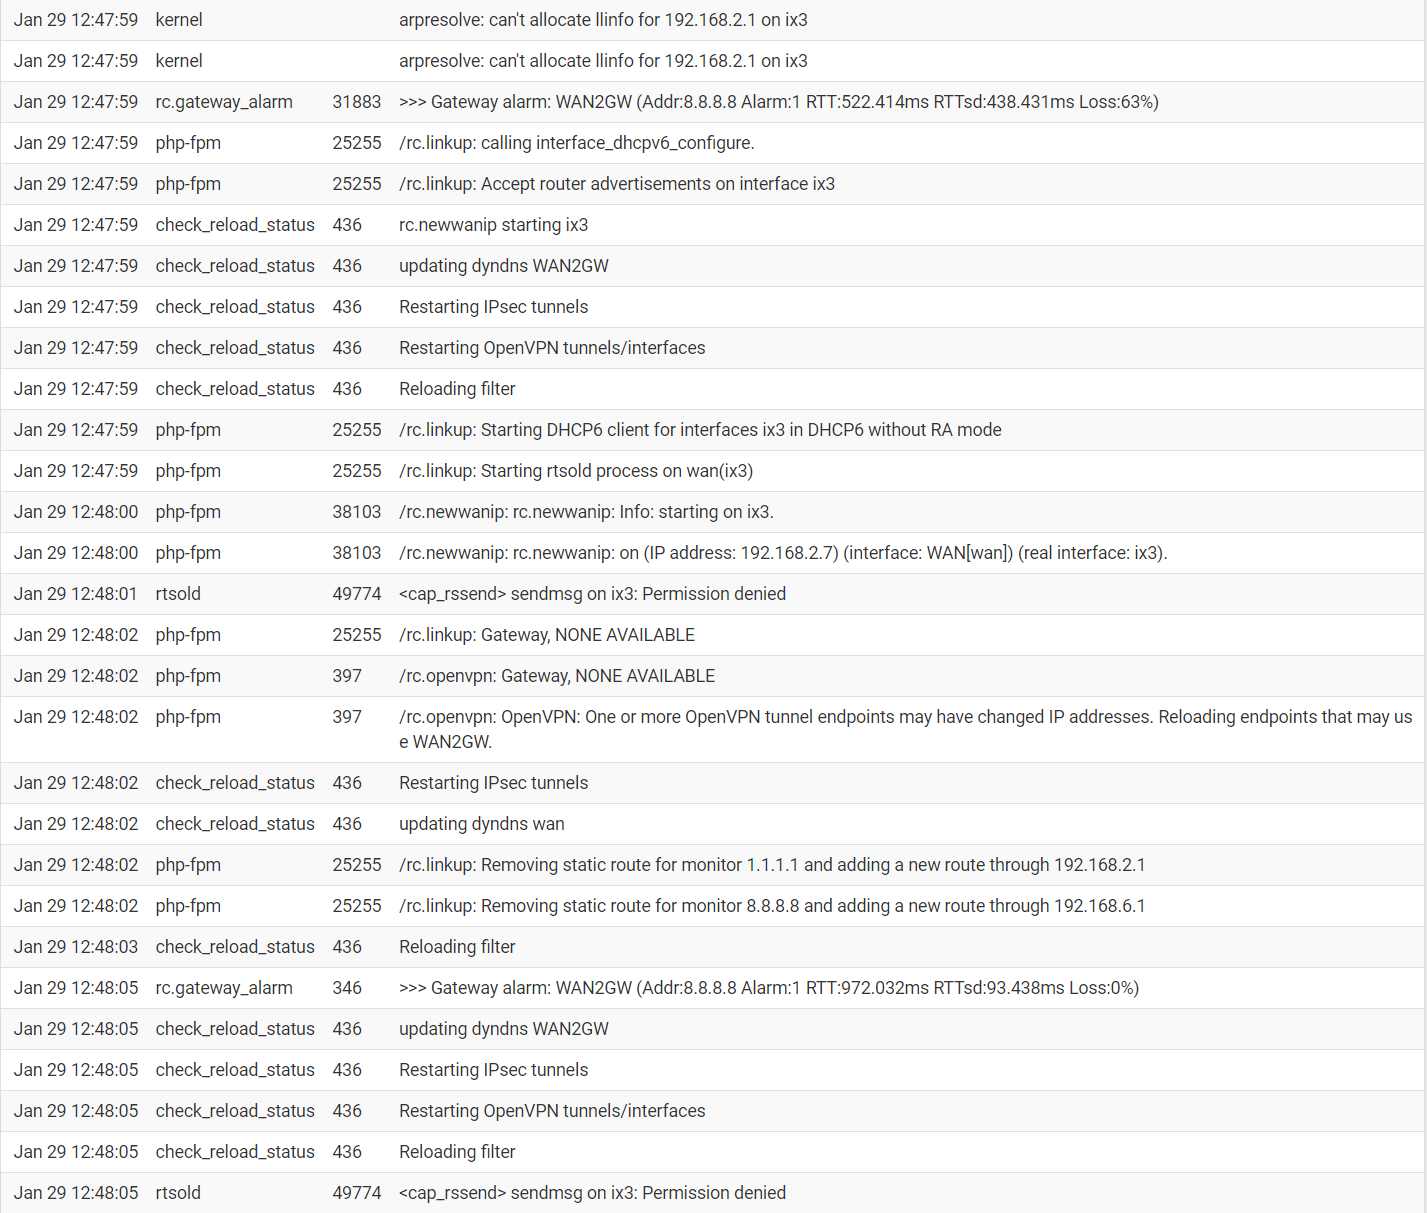
-
@harithruchira said in Need help to understand firewall log:
What does the long log entry at 12:46:06 mean?
That is dpinger, the gateway monitor, restarting. It has two instances, one on each WAN.
@harithruchira said in Need help to understand firewall log:
Could you explain the numbers 76642 and 76977?
Those are the process IDs.
OK so it looks like that first log was only the gateway log and this second log is the full system log?
It's much easier to work with logs like this if you copy and paste them here rather than using screenshots.
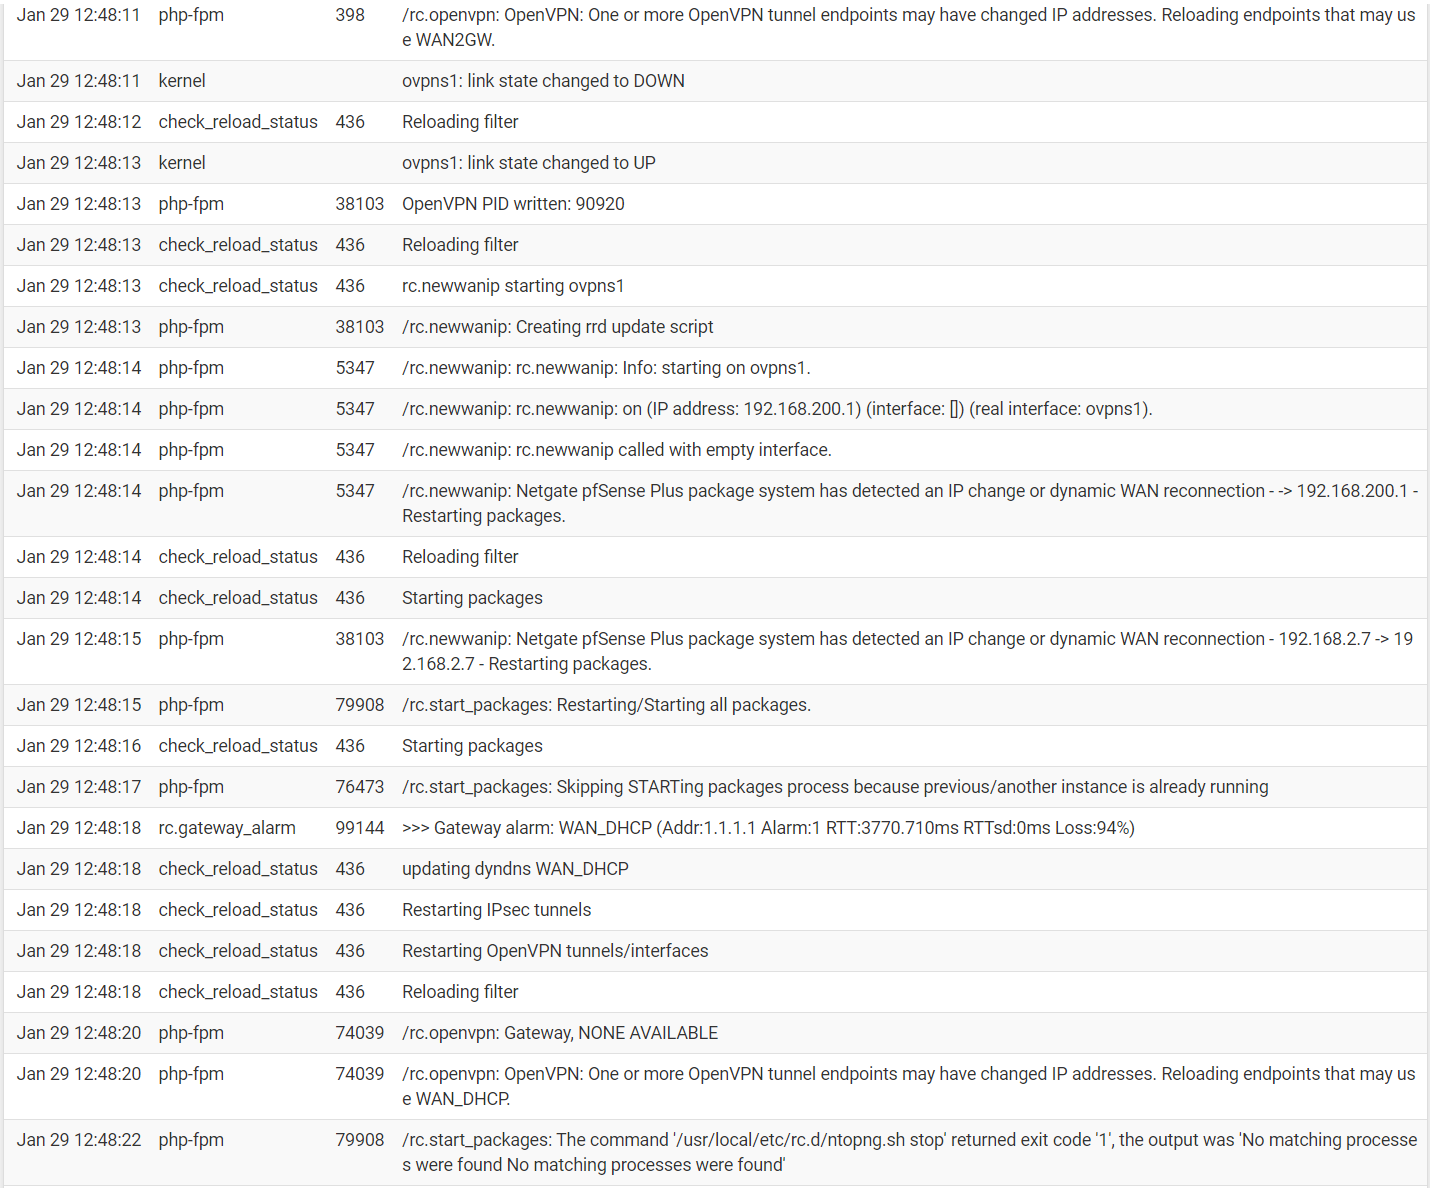
But you can see that includes entries showing ix3 relinking after you presumably rebooted the modem? Whatever was logged before that might show why it went down initially.
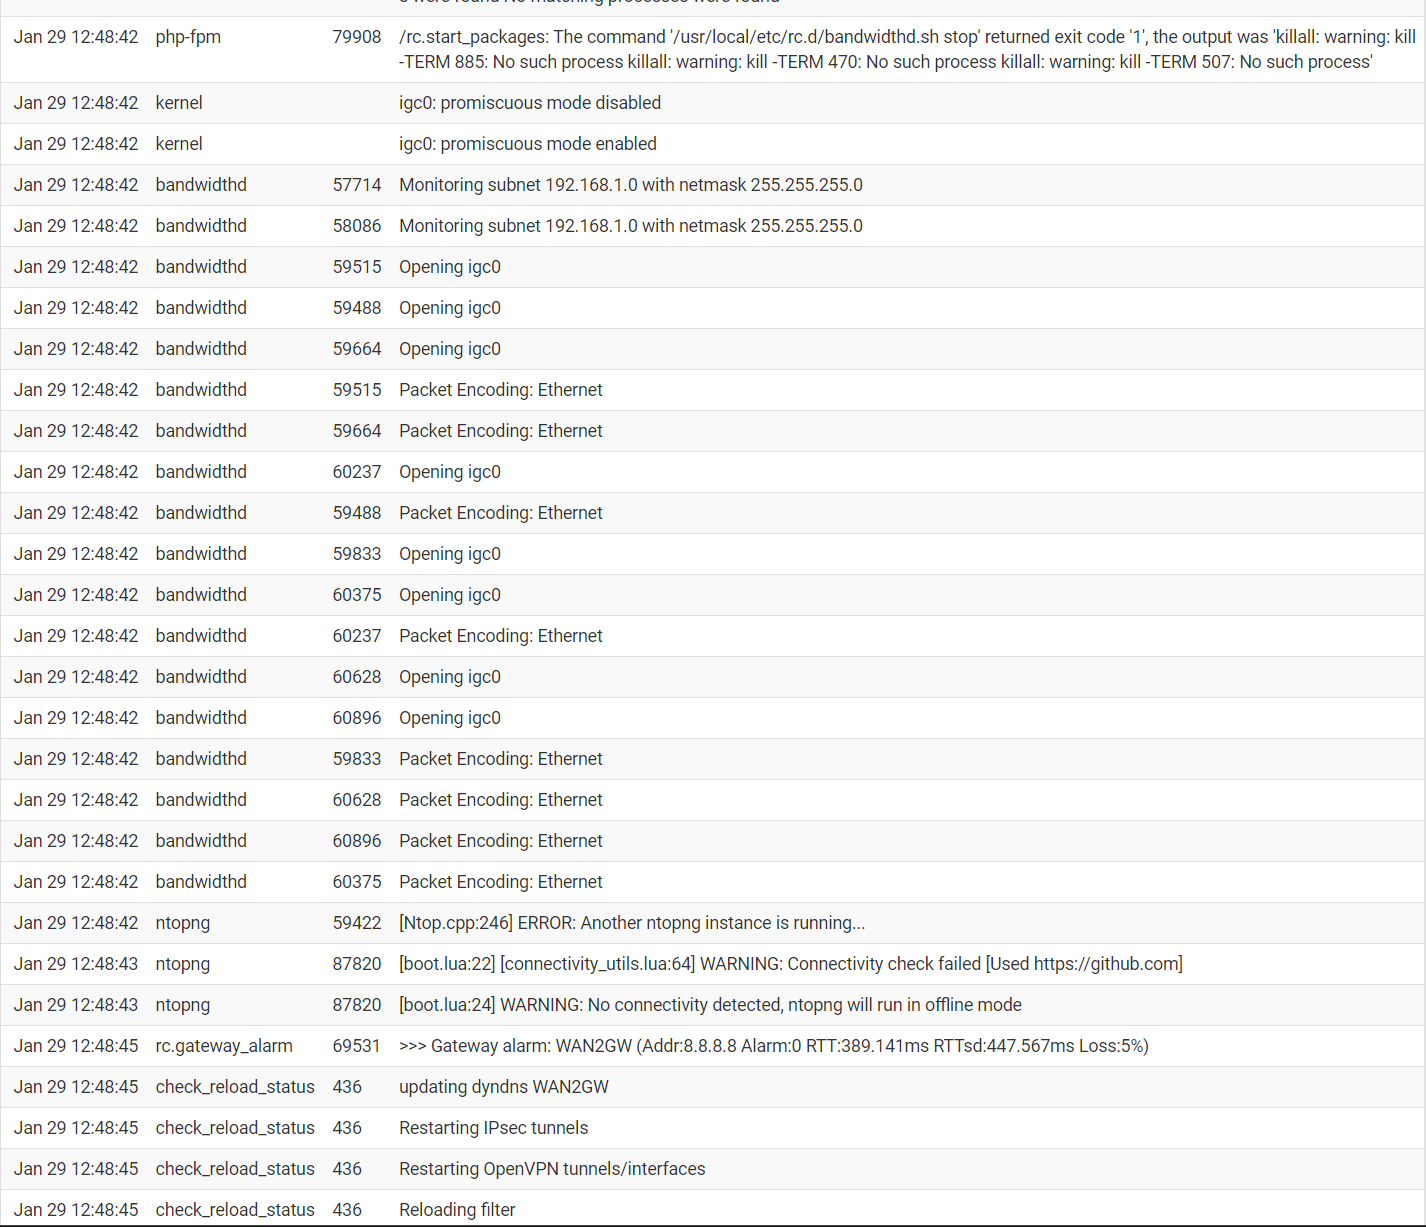
Running both ntopng and bandwidthd at the same time can sometimes be a problem.
The one thing that stands out as an issue is php coredumping at 12:48:48. However it's running again a few seconds later.