Topton N100 Reporting 402 MHz
-
With the realization that I was very much taking my chances with one of these boxes, I haven't found much information on this particular problem and wonder whether anyone may have any insight. Basically, this is one of the Topton N100 boxes, and no matter what I've tried with SpeedShift ans SpeedStep settings, the dashboard never displays anything but the following:
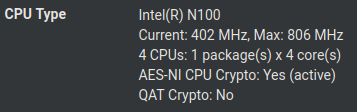
I can't seem to move the needle off 402 MHz, which is absurd. I know from related threads that these values are reported by the BIOS, so I'm sort of expecting it's something there, but I'm not sure what would be so egregiously wrong as to cause this. The reported clock is so low that my mind of course went to thermal throttling, but the core temps seems to me reported accurately (or at least they change values instead of being fixed) and are hovering right around 38C.
I also considered whether these reported values may just be bogus, but the results of running some openssl benchmarks suggest that they are not, as they came out about 5X slower than a machine I have with an older N5105.
Of course I realize the hardware/BIOS may just be garbage and know it's a risky venture with them, any thoughts of things to try or look for would be much appreciated. Thank you!
-
What's actually reporting that speed?
What does:
sysctl -a | grep freqshow? -
@stephenw10 said in Topton N100 Reporting 402 MHz:
sysctl -a | grep freq
Here's the output from
sysctl -a | grep freq:kern.timecounter.tc.TSC.frequency: 806398665 kern.timecounter.tc.ACPI-fast.frequency: 3579545 kern.timecounter.tc.i8254.frequency: 1193182 kern.timecounter.tc.HPET.frequency: 19200000 kern.ntp_pll.time_freq: 65258226878744 kern.ntp_pll.pps_freq: 42568974336000 device cpufreq kern.eventtimer.et.i8254.frequency: 1193182 kern.eventtimer.et.RTC.frequency: 32768 kern.eventtimer.et.HPET4.frequency: 19200000 kern.eventtimer.et.HPET3.frequency: 19200000 kern.eventtimer.et.HPET2.frequency: 19200000 kern.eventtimer.et.HPET1.frequency: 19200000 kern.eventtimer.et.HPET.frequency: 19200000 kern.eventtimer.et.LAPIC.frequency: 806398665 kern.acct_chkfreq: 15 debug.cpufreq.verbose: 0 debug.cpufreq.lowest: 0 debug.uart_poll_freq: 50 machdep.tsc_freq: 806398665 machdep.i8254_freq: 1193182 machdep.acpi_timer_freq: 3579545 dev.cpufreq.3.freq_driver: hwpstate_intel3 dev.cpufreq.3.%parent: cpu3 dev.cpufreq.3.%pnpinfo: dev.cpufreq.3.%location: dev.cpufreq.3.%driver: cpufreq dev.cpufreq.3.%desc: dev.cpufreq.2.freq_driver: hwpstate_intel2 dev.cpufreq.2.%parent: cpu2 dev.cpufreq.2.%pnpinfo: dev.cpufreq.2.%location: dev.cpufreq.2.%driver: cpufreq dev.cpufreq.2.%desc: dev.cpufreq.1.freq_driver: hwpstate_intel1 dev.cpufreq.1.%parent: cpu1 dev.cpufreq.1.%pnpinfo: dev.cpufreq.1.%location: dev.cpufreq.1.%driver: cpufreq dev.cpufreq.1.%desc: dev.cpufreq.0.freq_driver: hwpstate_intel0 dev.cpufreq.0.%parent: cpu0 dev.cpufreq.0.%pnpinfo: dev.cpufreq.0.%location: dev.cpufreq.0.%driver: cpufreq dev.cpufreq.0.%desc: dev.cpufreq.%parent: dev.cpu.3.freq_levels: 806/-1 dev.cpu.3.freq: 402 dev.cpu.2.freq_levels: 806/-1 dev.cpu.2.freq: 402 dev.cpu.1.freq_levels: 806/-1 dev.cpu.1.freq: 402 dev.cpu.0.freq_levels: 806/-1 dev.cpu.0.freq: 402Also, the Processor section of the output from
dmidecodeproperly reports the max speed, and seems to invariably report the current speed as 2871MHz.:Processor Information Socket Designation: U3E1 Type: Central Processor Family: Other Manufacturer: Intel(R) Corporation ID: E0 06 0B 00 FF FB EB BF Version: Intel(R) N100 Voltage: 1.0 V External Clock: 100 MHz Max Speed: 3400 MHz Current Speed: 2871 MHz Status: Populated, Enabled Upgrade: Other L1 Cache Handle: 0x0047 L2 Cache Handle: 0x0048 L3 Cache Handle: 0x0049 Serial Number: To Be Filled By O.E.M. Asset Tag: To Be Filled By O.E.M. Part Number: To Be Filled By O.E.M. Core Count: 4 Core Enabled: 4 Thread Count: 4 Characteristics: 64-bit capable Multi-Core Execute Protection Enhanced Virtualization Power/Performance ControlI'm a bit out of my depth with respect to understanding which information sources purport to provide actual/current values vs. just capabilities too. But the poor showing from the openssl benchmark pushes me toward believing the 402 MHz.
I doubt it's of great interest but here's that benchmark on this N100 machine:
openssl speed -elapsed -evp aes-256-cbc
You have chosen to measure elapsed time instead of user CPU time.
Doing AES-256-CBC for 3s on 16 size blocks: 18371913 AES-256-CBC's in 2.99s
Doing AES-256-CBC for 3s on 64 size blocks: 6408218 AES-256-CBC's in 3.01s
Doing AES-256-CBC for 3s on 256 size blocks: 1650087 AES-256-CBC's in 3.00s
Doing AES-256-CBC for 3s on 1024 size blocks: 416754 AES-256-CBC's in 3.00s
Doing AES-256-CBC for 3s on 8192 size blocks: 51871 AES-256-CBC's in 3.00s
Doing AES-256-CBC for 3s on 16384 size blocks: 26083 AES-256-CBC's in 3.00s
version: 3.0.12
built on: reproducible build, date unspecified
options: bn(64,64)
compiler: clang
CPUINFO: OPENSSL_ia32cap=0x7ffaf3bfffebffff:0x98c007bc239ca7eb
The 'numbers' are in 1000s of bytes per second processed.
type             16 bytes     64 bytes    256 bytes   1024 bytes   8192 bytes  16384 bytes
AES-256-CBC      98239.37k   136353.56k   140807.42k   142252.03k   141642.41k   142447.96k
versus my N5105 machine:
openssl speed -elapsed -evp aes-256-cbc You have chosen to measure elapsed time instead of user CPU time. Doing AES-256-CBC for 3s on 16 size blocks: 92650216 AES-256-CBC's in 3.00s Doing AES-256-CBC for 3s on 64 size blocks: 33541591 AES-256-CBC's in 3.00s Doing AES-256-CBC for 3s on 256 size blocks: 8956986 AES-256-CBC's in 3.00s Doing AES-256-CBC for 3s on 1024 size blocks: 2280647 AES-256-CBC's in 3.00s Doing AES-256-CBC for 3s on 8192 size blocks: 286647 AES-256-CBC's in 3.00s Doing AES-256-CBC for 3s on 16384 size blocks: 143340 AES-256-CBC's in 3.00s version: 3.0.12 built on: reproducible build, date unspecified options: bn(64,64) compiler: clang CPUINFO: OPENSSL_ia32cap=0x4ff8e3bfefebffff:0x184001242394a2c3 The 'numbers' are in 1000s of bytes per second processed. type 16 bytes 64 bytes 256 bytes 1024 bytes 8192 bytes 16384 bytes AES-256-CBC 494134.49k 715553.94k 764329.47k 778460.84k 782737.41k 782827.52k -
Ok try disabling speedshift entirely. It's using that now and will always use it as priority over speedstep if the module is loaded.
-
@stephenw10 Thank you, I'll do that and report back. Might not be until tomorrow as this is a machine I administer for family so need to coordinate when I can reboot it, but I should be able to overnight. Really appreciate the fast input, especially for this wonky hardware that you'd be entirely justified telling me to toss in a lake!
-
@stephenw10 Very interesting. So disabling SpeedShift affected a change, but now it seems stuck at 700MHz:
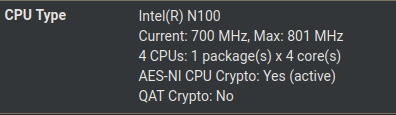
I ran the openssl benchmark again and saw CPU usage jump but the current frequency didn't change, and the benchmark results were still quite poor (effectively unchanged from when it was showing 402 MHz).
The frequency levels in sysctl output changed, but I'm not really sure how to interpret what it means. I'm thinking I probably won't be able to do much more until I can be there physically next weekend and play with the BIOS, but open to any further thoughts, and thanks again :)
dev.cpufreq.3.freq_driver: est3
dev.cpufreq.3.%parent: cpu3
dev.cpufreq.3.%pnpinfo:
dev.cpufreq.3.%location:
dev.cpufreq.3.%driver: cpufreq
dev.cpufreq.3.%desc:
dev.cpufreq.2.freq_driver: est2
dev.cpufreq.2.%parent: cpu2
dev.cpufreq.2.%pnpinfo:
dev.cpufreq.2.%location:
dev.cpufreq.2.%driver: cpufreq
dev.cpufreq.2.%desc:
dev.cpufreq.1.freq_driver: est1
dev.cpufreq.1.%parent: cpu1
dev.cpufreq.1.%pnpinfo:
dev.cpufreq.1.%location:
dev.cpufreq.1.%driver: cpufreq
dev.cpufreq.1.%desc:
dev.cpufreq.0.freq_driver: est0
dev.cpufreq.0.%parent: cpu0
dev.cpufreq.0.%pnpinfo:
dev.cpufreq.0.%location:
dev.cpufreq.0.%driver: cpufreq
dev.cpufreq.0.%desc:
dev.cpufreq.%parent:
dev.cpu.3.temperature: 39.0C
dev.cpu.3.coretemp.throttle_log: 0
dev.cpu.3.coretemp.tjmax: 105.0C
dev.cpu.3.coretemp.resolution: 1
dev.cpu.3.coretemp.delta: 67
dev.cpu.3.cx_method: C1/mwait/hwc C2/mwait/hwc C3/mwait/hwc
dev.cpu.3.cx_usage_counters: 122661 0 0
dev.cpu.3.cx_usage: 100.00% 0.00% 0.00% last 237us
dev.cpu.3.cx_lowest: C1
dev.cpu.3.cx_supported: C1/1/1 C2/2/127 C3/3/1048
dev.cpu.3.freq_levels: 801/6000 800/6000 700/5160
dev.cpu.3.freq: 700
dev.cpu.3.%parent: acpi0
dev.cpu.3.%pnpinfo: _HID=ACPI0007 _UID=3 _CID=none
dev.cpu.3.%location: handle=\_SB_.PR03
dev.cpu.3.%driver: cpu
dev.cpu.3.%desc: ACPI CPU
dev.cpu.2.temperature: 38.0C
dev.cpu.2.coretemp.throttle_log: 0
dev.cpu.2.coretemp.tjmax: 105.0C
dev.cpu.2.coretemp.resolution: 1
dev.cpu.2.coretemp.delta: 66
dev.cpu.2.cx_method: C1/mwait/hwc C2/mwait/hwc C3/mwait/hwc
dev.cpu.2.cx_usage_counters: 174176 0 0
dev.cpu.2.cx_usage: 100.00% 0.00% 0.00% last 155us
dev.cpu.2.cx_lowest: C1
dev.cpu.2.cx_supported: C1/1/1 C2/2/127 C3/3/1048
dev.cpu.2.freq_levels: 801/6000 800/6000 700/5160
dev.cpu.2.freq: 700
dev.cpu.2.%parent: acpi0
dev.cpu.2.%pnpinfo: _HID=ACPI0007 _UID=2 _CID=none
dev.cpu.2.%location: handle=\_SB_.PR02
dev.cpu.2.%driver: cpu
dev.cpu.2.%desc: ACPI CPU
dev.cpu.1.temperature: 39.0C
dev.cpu.1.coretemp.throttle_log: 0
dev.cpu.1.coretemp.tjmax: 105.0C
dev.cpu.1.coretemp.resolution: 1
dev.cpu.1.coretemp.delta: 66
dev.cpu.1.cx_method: C1/mwait/hwc C2/mwait/hwc C3/mwait/hwc
dev.cpu.1.cx_usage_counters: 179952 0 0
dev.cpu.1.cx_usage: 100.00% 0.00% 0.00% last 273us
dev.cpu.1.cx_lowest: C1
dev.cpu.1.cx_supported: C1/1/1 C2/2/127 C3/3/1048
dev.cpu.1.freq_levels: 801/6000 800/6000 700/5160
dev.cpu.1.freq: 700
dev.cpu.1.%parent: acpi0
dev.cpu.1.%pnpinfo: _HID=ACPI0007 _UID=1 _CID=none
dev.cpu.1.%location: handle=\_SB_.PR01
dev.cpu.1.%driver: cpu
dev.cpu.1.%desc: ACPI CPU
dev.cpu.0.temperature: 39.0C
dev.cpu.0.coretemp.throttle_log: 0
dev.cpu.0.coretemp.tjmax: 105.0C
dev.cpu.0.coretemp.resolution: 1
dev.cpu.0.coretemp.delta: 66
dev.cpu.0.cx_method: C1/mwait/hwc C2/mwait/hwc C3/mwait/hwc
dev.cpu.0.cx_usage_counters: 558350 0 0
dev.cpu.0.cx_usage: 100.00% 0.00% 0.00% last 68us
dev.cpu.0.cx_lowest: C1
dev.cpu.0.cx_supported: C1/1/1 C2/2/127 C3/3/1048
dev.cpu.0.freq_levels: 801/6000 800/6000 700/5160
dev.cpu.0.freq: 700
dev.cpu.0.%parent: acpi0
dev.cpu.0.%pnpinfo: _HID=ACPI0007 _UID=0 _CID=none
dev.cpu.0.%location: handle=\_SB_.PR00
dev.cpu.0.%driver: cpu
dev.cpu.0.%desc: ACPI CPU
dev.cpu.%parent:
One other data point is that if I run
powerd -vwhile I kick off the openssl benchmark, I'll get output like this (just an excerpt) and the frequency display from the dashboard goes away entirely. Reported CPU temps move but still not about 40C so unless they're inaccurate, I don't think there's thermal throttling going on.load 146%, current freq 801 MHz ( 0), wanted freq 1602 MHz load 103%, current freq 801 MHz ( 0), wanted freq 1602 MHz load 136%, current freq 801 MHz ( 0), wanted freq 1602 MHz load 103%, current freq 801 MHz ( 0), wanted freq 1602 MHz load 109%, current freq 801 MHz ( 0), wanted freq 1602 MHz load 110%, current freq 801 MHz ( 0), wanted freq 1602 MHz load 114%, current freq 801 MHz ( 0), wanted freq 1602 MHz -
@stephenw10 I also found these two posts, neither of which are clearly directly applicable, but are too eerily dissimilar for me to ignore.
Dell XPS 9550 CPU Multiplier Stuck at 8
Sounds like it may be worth trying to shut the thing down and pull the CMOS battery, and perhaps see whether I have access to this BC_PROCHOT setting in the BIOS.
-
Hmm, 801 in steedstep represents 800+turbo so could be correct. But I'd expect it to be show 801 as current under load.

-
@stephenw10 Yeah I'm beginning to worry there may be a bad sensor that's causing false positive thermal throttling. And I've also found information suggesting that with 13th generation Intel processors there's no way to configure things to ignore this BD_PROCHOT signal. But there does seem to be another indication that there's something odd going on with the sensors. The dashboard shows all 4 cores:
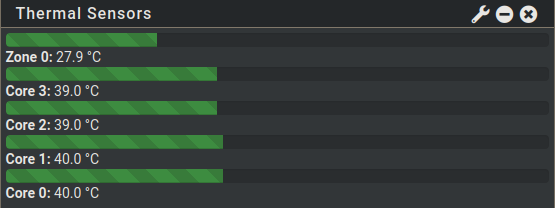
But when I go to Status > Monitoring and look at the thermal sensors, it only shows zone 0, and there's no data past 11:37 on 2/7:
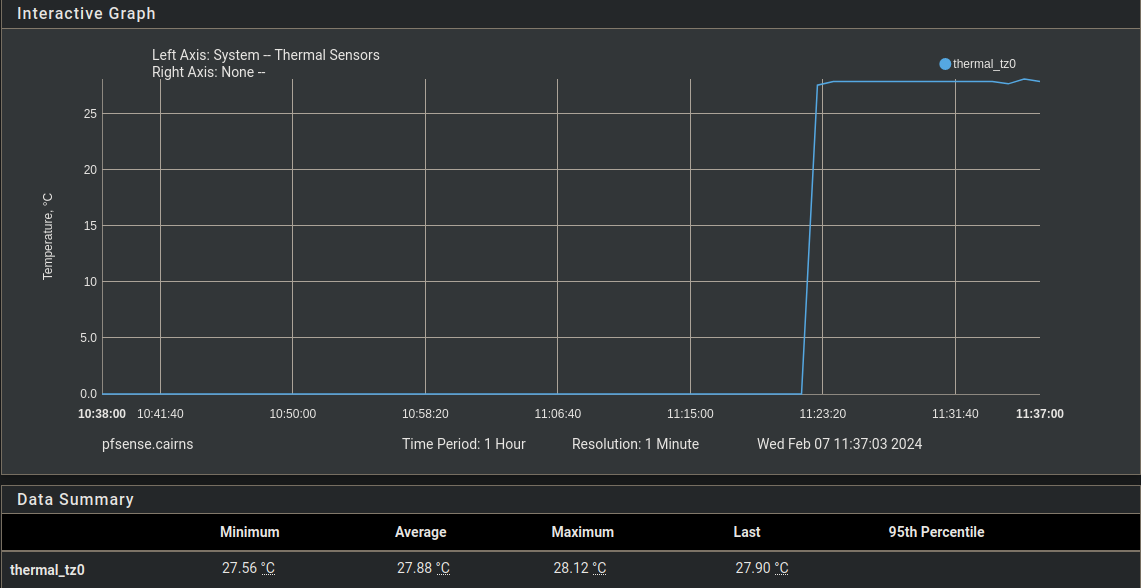
I've double checked that I have the Intel sensor selected in System > Advanced > Miscellaneous so I'm not sure how to interpret that.
-
You should see 'coretemp' entries in the logs if it recognises the CPU core sensors.
[2.7.2-RELEASE][admin@t70.stevew.lan]/root: dmesg | grep coretemp coretemp0: <CPU On-Die Thermal Sensors> on cpu0 coretemp0: Setting TjMax=90 coretemp1: <CPU On-Die Thermal Sensors> on cpu1 coretemp1: Setting TjMax=90 coretemp2: <CPU On-Die Thermal Sensors> on cpu2 coretemp2: Setting TjMax=90 coretemp3: <CPU On-Die Thermal Sensors> on cpu3 coretemp3: Setting TjMax=90 -
@stephenw10 So I have a single line out output from that:
coretemp0: <CPU On-Die Thermal Sensors> on cpu0From your sample though it seems like there should be an entry for each core? Although on my other machine that seems to be working, I also only have an entry for cpu0.
-
There is on that older device yes. The N100 may not present like that though. I'm not sure since I don't have one to test.
-
@stephenw10 Yeah. Well I appreciate all your input. I can't think of much else to try until I can get my hands on the thing this weekend, play around with BIOS settings, maybe try booting Linux from a thumb drive as a point of comparison. Really hoping it's not just a bum sensor that I can't do anything about (or a trash BIOS since these things never have updates). The most amusing part of this is I was updating from a PC Engines apu2e4 and its comparatively anemic 1GHz cores . . . so now I get stuck at sub-1GHz

-
Hmm, I guess I'd try booting something else on it as a test. See if that shows the expected freqs, and how it's setting them.
-
Your Topton is probably made by CWWK, as my 'HUNSN' branded one is, and I had a similar issue at first because the 'C States' weren't enabled in the BIOS, which is what Intel SpeedShift uses to boost and cut power/speed as needed per core, from what I understand. And I wanted to use SpeedShift instead of SpeedStep. Turns out that the 6 ethernet port 'fanless' heatpipe+tall fins version of the CWWK router/pc came with a gimped bios that didn't expose the settings to enable C States. I think the 2 and 4 port versions don't have that issue (was discussed on another forum). Mine showed a speed like 804MHz in PFSense GUI... Now, with a modded bios and C States enabled, it can boost over 3ghz but it now says in PFSense "Max: 2496 MHz". And with C States enabled it does indicate that it can drop below 500MHz and the CPU temperature is in upper 20s C and rarely hits the mid 40s under load. So you may want to double check in the BIOS that C States are enabled and test it while in the CLI as that seems to be more accurate than what PFSense shows in the GUI on these CWWK boxes, if that is what you have...
-
@Tzvia Thank you for this additional information. I'll be sure to check BIOS options first thing when I have physical access to this machine again this weekend. Mine is a 4-port unit, and I did do a cursory check of BIOS settings during installation. I don't recall seeing C-state config, but also at the time I didn't have any particular reason to be looking for it, so hopefully I just missed it. I know the BIOS updates with these things are fraught even when possible, but if it does end up looking like I have a hobbled BIOS as the root cause maybe I'll need to look for one that seems compatible, cross my fingers and flash it, haha.
-
@Tzvia Just a quick follow-up too, not sure whether this means more to you than it does to me, but the sysctl output appears to indicate that it supports C1, C2, and C3. Although I don't know if that could just mean "the processor model supports it" but they could still be disabled in the BIOS. Here's the output pertaining to one of the 4 cores though:
dev.cpu.0.temperature: 38.0C dev.cpu.0.coretemp.throttle_log: 0 dev.cpu.0.coretemp.tjmax: 105.0C dev.cpu.0.coretemp.resolution: 1 dev.cpu.0.coretemp.delta: 67 dev.cpu.0.cx_method: C1/mwait/hwc C2/mwait/hwc C3/mwait/hwc dev.cpu.0.cx_usage_counters: 189006045 0 0 dev.cpu.0.cx_usage: 100.00% 0.00% 0.00% last 50us dev.cpu.0.cx_lowest: C1 dev.cpu.0.cx_supported: C1/1/1 C2/2/127 C3/3/1048 dev.cpu.0.freq_levels: 801/6000 800/6000 700/5160 dev.cpu.0.freq: 700 dev.cpu.0.%parent: acpi0 dev.cpu.0.%pnpinfo: _HID=ACPI0007 _UID=0 _CID=none dev.cpu.0.%location: handle=\_SB_.PR00 dev.cpu.0.%driver: cpu dev.cpu.0.%desc: ACPI CPU -
Mmm, I'm not sure C-states is correct there. P-states are what Speedstep uses, that's shown as
801/6000 800/6000 700/5160for you. Speedshift just changes the levels sing hardware in the CPU rather than software controlled which means it's much faster. -
@stephenw10 Alright, I have this Topton machine back in my possession now, just swapped the old apu2e4 back in for now. I just booted MX Linux from a thumb drive, and it has no problems at all. I can see from inxi that it boosts a single core up to 3400MHz for the openssl speed test, and that speed test is executing about 8X faster than it is under pfSense:
$ openssl speed -elapsed -evp aes-256-cbc
You have chosen to measure elapsed time instead of user CPU time.
Doing AES-256-CBC for 3s on 16 size blocks: 160803402 AES-256-CBC's in 3.00s
Doing AES-256-CBC for 3s on 64 size blocks: 52614619 AES-256-CBC's in 3.00s
Doing AES-256-CBC for 3s on 256 size blocks: 10652587 AES-256-CBC's in 3.00s
Doing AES-256-CBC for 3s on 1024 size blocks: 2021881 AES-256-CBC's in 3.00s
Doing AES-256-CBC for 3s on 8192 size blocks: 246344 AES-256-CBC's in 3.00s
Doing AES-256-CBC for 3s on 16384 size blocks: 121479 AES-256-CBC's in 3.00s
version: 3.0.11
built on: Mon Oct 23 17:52:22 2023 UTC
options: bn(64,64)
compiler: gcc -fPIC -pthread -m64 -Wa,--noexecstack -Wall -fzero-call-used-regs=used-gpr -DOPENSSL_TLS_SECURITY_LEVEL=2 -Wa,--noexecstack -g -O2 -ffile-prefix-map=/build/reproducible-path/openssl-3.0.11=. -fstack-protector-strong -Wformat -Werror=format-security -DOPENSSL_USE_NODELETE -DL_ENDIAN -DOPENSSL_PIC -DOPENSSL_BUILDING_OPENSSL -DNDEBUG -Wdate-time -D_FORTIFY_SOURCE=2
CPUINFO: OPENSSL_ia32cap=0x7ffaf3bfffebffff:0x98c007bc239ca7eb
The 'numbers' are in 1000s of bytes per second processed.
type             16 bytes     64 bytes    256 bytes   1024 bytes   8192 bytes  16384 bytes
AES-256-CBC     857618.14k  1122445.21k   909020.76k   690135.38k   672683.35k   663437.31k
So I think it's safe to say that whatever this is, it's not a hardware issue, and likely not a BIOS setting issue (unless there's some BIOS setting that makes FreeBSD very unhappy but Linux doesn't care about).
Now in pfSense I am of course restoring the config from the apu2e4, but there were really no exotic changes made to it. That said, barring other ideas I could try doing a reinstall of pfSense with no config restore and see whether I still get this behavior. But does this make any obvious sense? Certainly there are others using N100s with pfSense.
I'm trying to think of what to test next and open to any ideas
Thanks again! -
It could still be a BIOS issue. Many will pass different values depending on the running OS. Though historically that has been a Windows issue.
You can try running FreeBSD directly.